. 2020 Dec;30(8):e02205.
doi: 10.1002/eap.2205. Epub 2020 Aug 18.

DNA metabarcoding effectively quantifies diatom responses to nutrients in streams

Affiliations

DNA metabarcoding effectively quantifies diatom responses to nutrients in streams

Nathan J Smucker et al. Ecol Appl. 2020 Dec.

Abstract

Nutrient pollution from human activities remains a common problem facing stream ecosystems. Identifying ecological responses to phosphorus and nitrogen can inform decisions affecting the protection and management of streams and their watersheds. Diatoms are particularly useful because they are a highly diverse group of unicellular algae found in nearly all aquatic environments and are sensitive responders to increased nutrient concentrations. Here, we used DNA metabarcoding of stream diatoms as an approach to quantifying effects of total phosphorus (TP) and total nitrogen (TN). Threshold indicator taxa analysis (TITAN) identified operational taxonomic units (OTUs) that increased or decreased along TP and TN gradients along with nutrient concentrations at which assemblages had substantial changes in the occurrences and relative abundances of OTUs. Boosted regression trees showed that relative abundances of gene sequence reads for OTUs identified by TITAN as low P, high P, low N, or high N diatoms had strong relationships with nutrient concentrations, which provided support for potentially using these groups of diatoms as metrics in monitoring programs. Gradient forest analysis provided complementary information by characterizing multi-taxa assemblage change using multiple predictors and results from random forest models for each OTU. Collectively, these analyses showed that notable changes in diatom assemblage structure and OTUs began around 20 µg TP/L, low P diatoms decreased substantially and community change points occurred from 75 to 150 µg/L, and high P diatoms became increasingly dominant from 150 to 300 µg/L. Diatoms also responded to TN with large decreases in low N diatoms occurring from 280 to 525 µg TN/L and a transition to dominance by high N diatoms from 525-850 µg/L. These diatom responses to TP and TN could be used to inform protection efforts (i.e., anti-degradation) and management goals (i.e., nutrient reduction) in streams and watersheds. Our results add to the growing support for using diatom metabarcoding in monitoring programs.

Keywords: agriculture; algae; bioassessment; biomonitoring; boosted regression trees; gradient forest; nitrogen; periphyton; phosphorus; rbcL; threshold indicator taxa analysis.


Figures

Fig. 1
Fig. 1
Flow chart showing initial data analyses (dark gray boxes) used in subsequent statistics. Light gray ovals show statistics used to characterize nutrient–response relationships, which were collectively used to summarize diatom assemblage change associated with phosphorus and nitrogen (white oval). Threshold indicator taxa analysis (TITAN) conducts indicator species analysis and designates operational taxonomic units (OTUs) as decreasers, increasers, or unreliable (i.e., not significant) or impure (i.e., inconsistent directionality in responses) based on 1,000 bootstraps. For clarity, we renamed decreasers as low P and low N diatoms and increasers as high P and high N diatoms. Environmental variables were predictors and each diatom metric was subsequently used as a response variable in boosted regression trees (BRTs).
Fig. 2
Fig. 2
Nonmetric multidimensional scaling (NMDS) ordination of all samples (n = 342) using relative abundances of OTU rbcL sequences. Spearman correlation overlays show relationships of axes with land cover, nutrients, and diatom metrics (gray lines). Axes are scaled to coincide with the possible range of correlations from −1 to 1. Ag, agriculture; TP, total phosphorus; TN, total nitrogen; HP, LP, HN, and LN, relative abundances of high and low phosphorus and nitrogen diatoms.
Fig. 3
Fig. 3
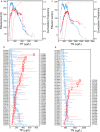
Threshold indicator taxa analysis showing sumZ scores and change points of OTUs for (a, b) TP and (c, d) TN. Filtered refers to results using only OTUs identified as being pure and reliable. Blue shows decreaser sumZ scores and OTUs, red shows increaser sumZ scores and OTUs. In panels a and c. circles show the sumZ scores of decreaser and increaser OTUs at each observed nutrient concentration, and cumulative frequencies show the distribution of assemblage change points (maximum sumZ) from 1,000 bootstraps. In panels b and d, symbols show change points for each OTU scaled according to z scores (i.e., magnitudes of responses), and lines show 5th and 95th quantiles from 1,000 bootstraps. Narrow peaks in sumZ scores, steep increases in the cumulative frequency curves, and multiple OTU change points occurring within a narrow range of concentrations provide evidence of thresholds. Broad peaks in sumZ scores (e.g., “plateaus”), gradual increases in cumulative frequency curves, and gradual addition of OTU change points indicate more gradual responses and a longer gradient of assemblage change. The larger maximum sum z scores for TP showed that TP had greater effects on diatom assemblage change than did TN.
Fig. 4
Fig. 4
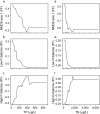
Partial dependence plots from boosted regression trees showing responses of nonmetric multidimensional scaling (NMDS) axis 1 scores and of diatom metrics to TP or TN while controlling for the average effect of other variables. FF, fitted functions. Rug plots show deciles of predictor values.
Fig. 5
Fig. 5
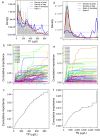
Results from gradient forest analysis showing diatom OTUs and assemblage responses to TP and TN. (a) Compositional change based on aggregating OTU responses were determined by split importance and values along TP and TN gradients (bars) and the ratios (blue lines) of split density (black lines) to data density (red lines). Peaks and regions of standardized split density plots with ratios >1 (horizontal dashed lines) delineate portions of the TN or TP gradient within which OTU compositional change is relatively greater than elsewhere along the nutrient gradient. (b) Cumulative change of individual OTUs is shown based on their splits’ importance distributions, which were scaled by R 2 and standardized by data density for each OTU with the most important OTUs being labeled. (c) Relative rates of overall change in assemblage composition based on cumulative splits importance plots along the TP and TN gradients.
Fig. 6
Fig. 6
Summaries of diatom OTU responses to (a) total phosphorus and (b) total nitrogen. In panel b, x‐axis break is 1,499–3,999 µg/L. Crossed circles are results directly from TITAN (change points [CP] with bootstrapped 5th and 95th quantiles and mid‐points in the portions of cumulative frequency distributions showing the greatest increases in bootstrapped change points). Circles are boosted regression tree (BRT) results showing mid‐points from portions of partial dependence plots with substantial change in response variables. Squares are peaks in standardized splits density plots in gradient forest (GF) analysis. Colors denote responses by low nutrient diatom OTUs (blue), high nutrient diatom OTUs (red), and assemblage change (gray; GF and nonmetric multidimensional scaling [NMDS]). Horizontal lines represent the range within which notable responses occurred (or 5th and 95th quantiles of TITAN change points). Diatom responses occurred at multiple points along the TP or TN gradient and these are denoted as BRT1, BRT2…, GF1, GF2…, and sumZ1, sumZ2. Vertical dashed gray lines demarcate portions of TP and TN gradients within which substantial changes in diatom assemblage occurred (see Summary of diatom responses in Results).

References

    1. Apothéloz‐Perret‐Gentil, L. , Cordonier A., Straub F., Iseli J., Esling P., and Pawlowski J.. 2017. Taxonomy‐free molecular diatom index for high‐throughput eDNA biomonitoring. Molecular Ecology Resources 17:1231–1242. - PubMed
    1. Baker, M. E. , and King R. S.. 2010. A new method for detecting and interpreting biodiversity and ecological community thresholds. Methods in Ecology and Evolution 1:25–37.
    1. Baker, M. E. , King R. S., and Kahle D..2015. TITAN2: Threshold Indicator Taxa Analysis. https://cran.r‐project.org/web/packages/TITAN2/TITAN2.pdf
    1. Becker, M. E. , Becker T. J., and Bellucci C. J.. 2019. Diatom tolerance metrics to identify total phosphorus as candidate cause of aquatic life impairment in Connecticut, USA freshwater streams. Ecological Indicators 93:638–646.
    1. Breiman, L. 2001. Random forests. Machine Learning 45:5–32.

Publication types

LinkOut - more resources