Observational Study
. 2020 Jun 29;12(13):13529-13554.
doi: 10.18632/aging.103461. Epub 2020 Jun 29.

Quantitative proteomics analysis of young and elderly skin with DIA mass spectrometry reveals new skin aging-related proteins

Affiliations
Observational Study

Quantitative proteomics analysis of young and elderly skin with DIA mass spectrometry reveals new skin aging-related proteins

Jing Ma et al. Aging (Albany NY). .

Abstract

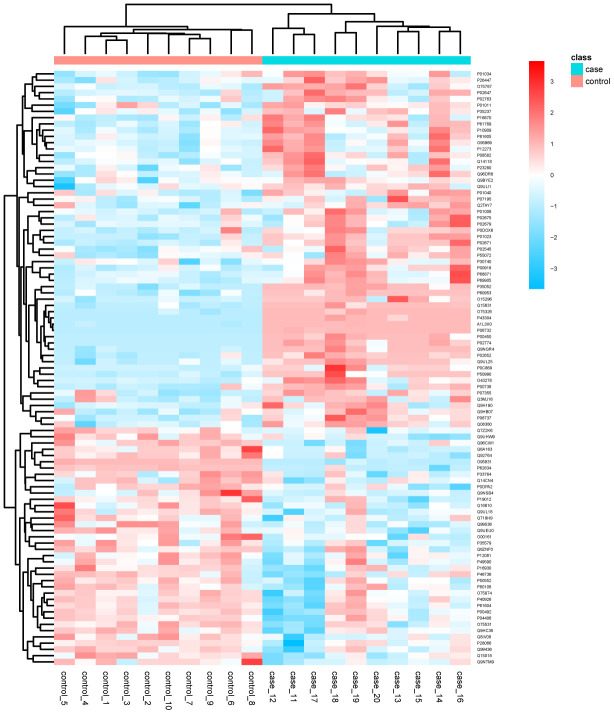
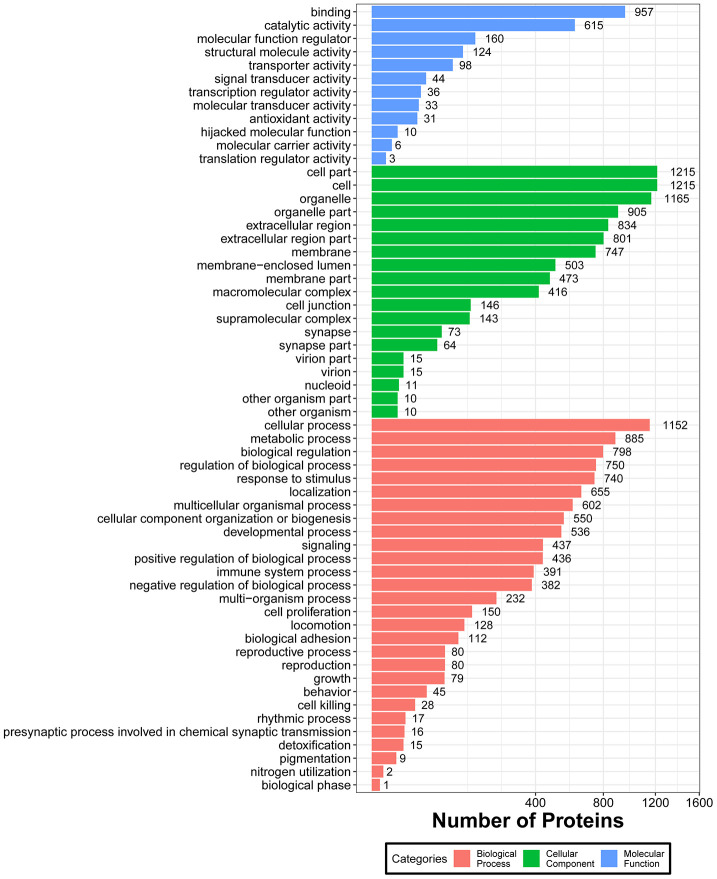
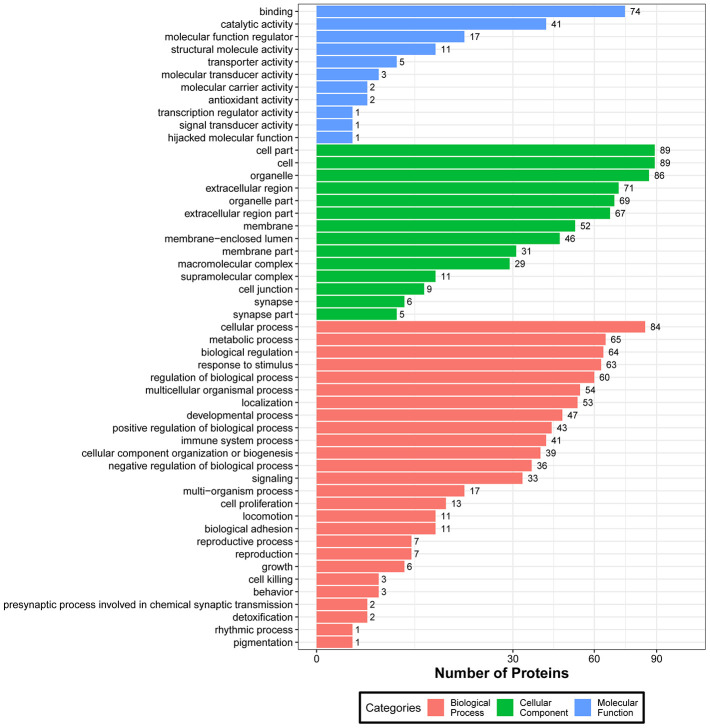
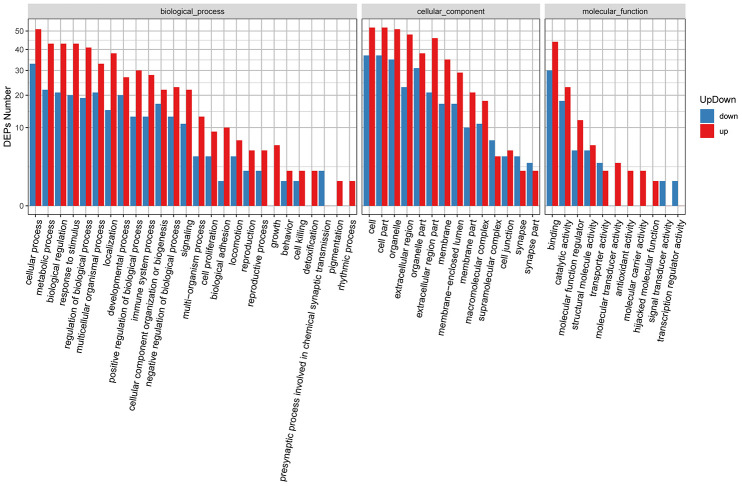
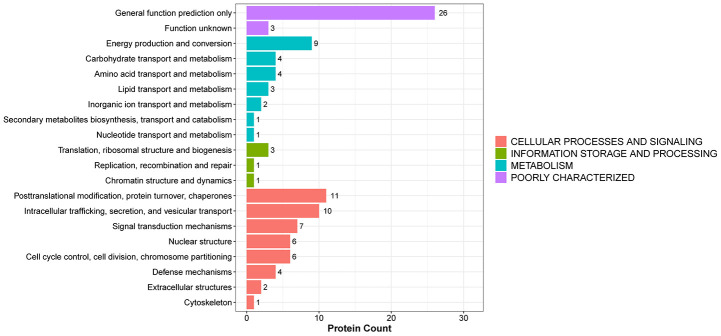
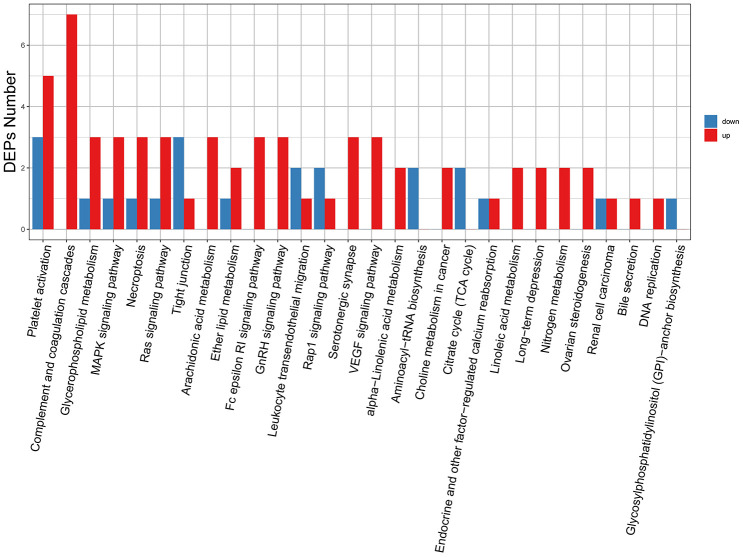
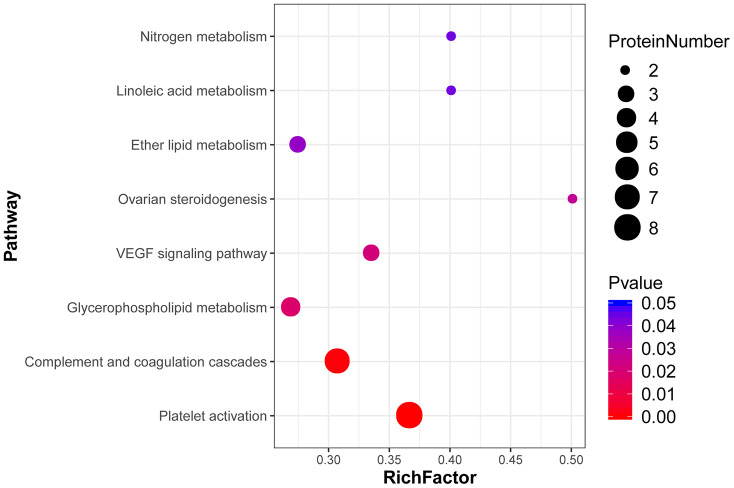
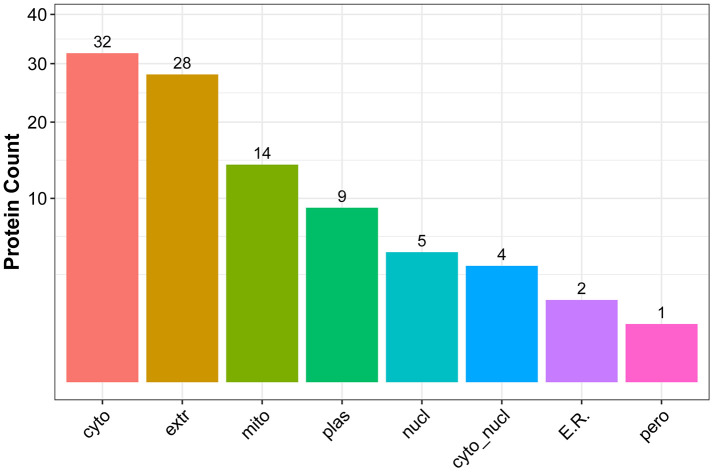
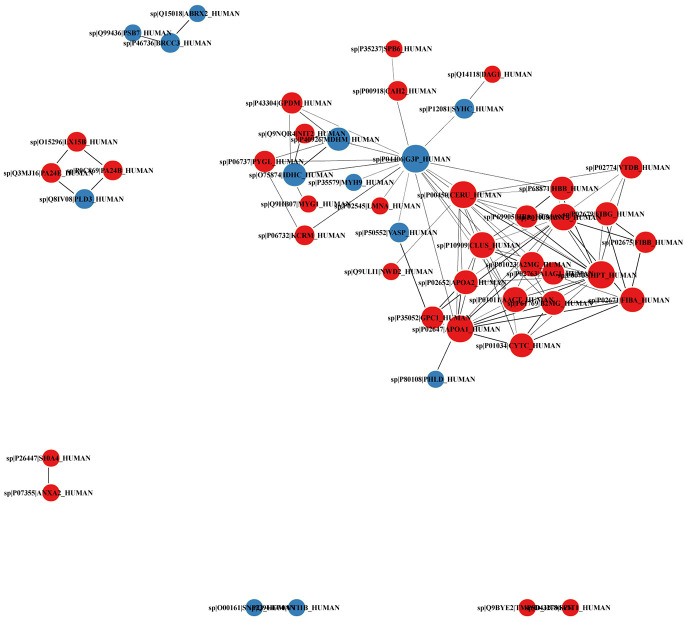
Skin aging is a specific manifestation of the physiological aging process that occurs in virtually all organisms. In this study, we used data independent acquisition mass spectrometry to perform a comparative analysis of protein expression in volar forearm skin samples from of 20 healthy young and elderly Chinese individuals. Our quantitative proteomic analysis identified a total of 95 differentially expressed proteins (DEPs) in aged skin compared to young skin. Enrichment analyses of these DEPs (57 upregulated and 38 downregulated proteins) based on the GO, KEGG, and KOG databases revealed functional clusters associated with immunity and inflammation, oxidative stress, biosynthesis and metabolism, proteases, cell proliferation, cell differentiation, and apoptosis. We also found that GAPDH, which was downregulated in aged skin samples, was the top hub gene in a protein-protein interaction network analysis. Some of the DEPs identified herein had been previously correlated with aging of the skin and other organs, while others may represent novel age-related entities. Our non-invasive proteomics analysis of human epidermal proteins may guide future research on skin aging to help develop treatments for age-related skin conditions and rejuvenation.

Keywords: aging; epidermal proteins; mass spectrometer; proteome; skin rejuvenation and aging.


Conflict of interest statement

CONFLICTS OF INTEREST: The authors declare that they have no conflicts of interest.

Figures

Figure 1
Figure 1
Identification of DEPs in aged skin samples. The X axis represents protein difference (log2-transformed fold changes), and the Y axis the corresponding -log10-transformed P values. Red dots indicate significantly upregulated proteins, green dots denote significantly downregulated proteins, and gray dots symbolize proteins with no significant change.
Figure 2
Figure 2
Cluster analysis chart of the identified DEPs. Higher red and blue intensities indicate higher degree of upregulation and downregulation, respectively.
Figure 3
Figure 3
Functional GO classification of all the identified skin proteins.
Figure 4
Figure 4
Functional GO classification of DEPs.
Figure 5
Figure 5
GO classification of upregulated and downregulated DEPs.
Figure 6
Figure 6
KOG functional annotation of DEPs.
Figure 7
Figure 7
KEGG pathway classification of DEPs. The x-axis represents pathway annotation entries, and the y-axis represents the number of DEPs enriched for each pathway term.
Figure 8
Figure 8
Top 8 pathways enriched in DEPs from aged skin. The x-axis indicates the enrichment factor (RichFactor), i.e. the number of DEPs annotated to each pathway divided by all identified proteins annotated to the same pathway. The larger the value, the greater the proportion of DEPs annotated to each pathway. Dot sizes represent the number of DEPs annotated to each pathway.
Figure 9
Figure 9
Subcellular localization of DEPs. The x-axis represents subcellular structure entries and the y-axis represents the number of DEPs.
Figure 10
Figure 10
PPI network diagram of DEPs. Red and blue nodes indicate upregulated and downregulated proteins, respectively. The size of the circles indicates node degree.

References

    1. Rinnerthaler M, Streubel MK, Bischof J, Richter K. Skin aging, gene expression and calcium. Exp Gerontol. 2015; 68:59–65. 10.1016/j.exger.2014.09.015 - DOI - PubMed
    1. Ribero S, Mangino M, Bataille V. Skin phenotypes can offer some insight about the association between telomere length and cancer susceptibility. Med Hypotheses. 2016; 97:7–10. 10.1016/j.mehy.2016.10.010 - DOI - PubMed
    1. Avantaggiato A, Bertuzzi G, Vitiello U, Iannucci G, Pasin M, Pascali M, Cervelli V, Carinci F. Role of antioxidants in dermal aging: an in vitro study by q-RT-PCR. Aesthetic Plast Surg. 2014; 38:1011–16. 10.1007/s00266-014-0380-9 - DOI - PubMed
    1. Kammeyer A, Luiten RM. Oxidation events and skin aging. Ageing Res Rev. 2015; 21:16–29. 10.1016/j.arr.2015.01.001 - DOI - PubMed
    1. Choi YJ, Moon KM, Chung KW, Jeong JW, Park D, Kim DH, Yu BP, Chung HY. The underlying mechanism of proinflammatory NF-κB activation by the mTORC2/Akt/IKKα pathway during skin aging. Oncotarget. 2016; 7:52685–94. 10.18632/oncotarget.10943 - DOI - PMC - PubMed

Publication types

MeSH terms