. 2020 Oct 5;59(41):18194-18200.
doi: 10.1002/anie.202006881. Epub 2020 Aug 13.

Cryogenic OrbiSIMS Localizes Semi-Volatile Molecules in Biological Tissues

Affiliations

Cryogenic OrbiSIMS Localizes Semi-Volatile Molecules in Biological Tissues

Clare L Newell et al. Angew Chem Int Ed Engl. .

Abstract

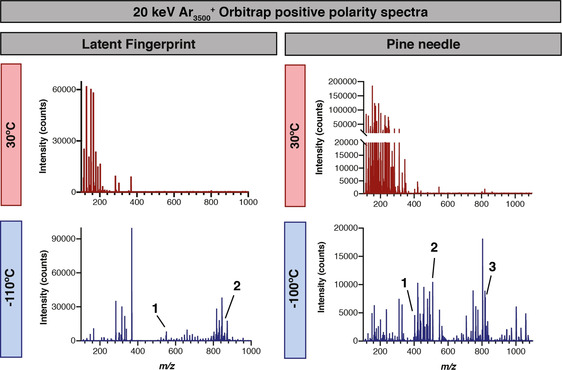
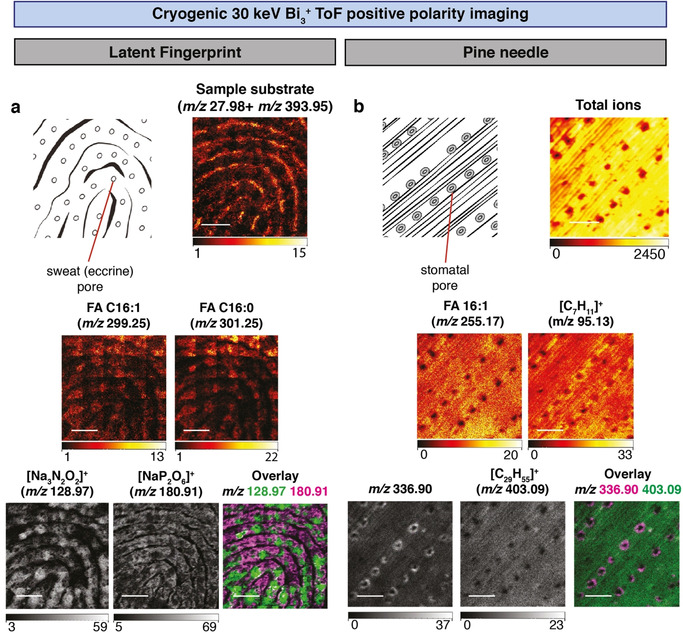
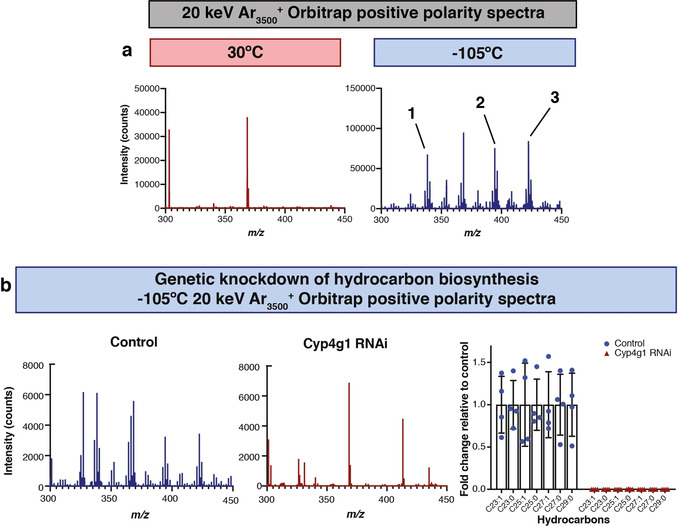
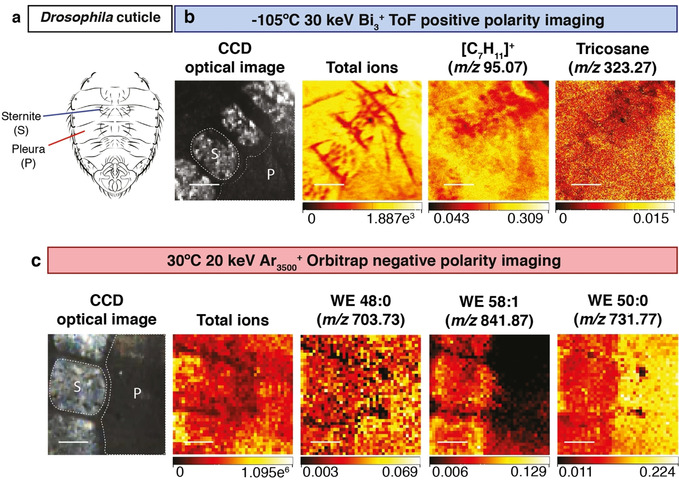
OrbiSIMS is a recently developed instrument for label-free imaging of chemicals with micron spatial resolution and high mass resolution. We report a cryogenic workflow for OrbiSIMS (Cryo-OrbiSIMS) that improves chemical detection of lipids and other biomolecules in tissues. Cryo-OrbiSIMS boosts ionization yield and decreases ion-beam induced fragmentation, greatly improving the detection of biomolecules such as triacylglycerides. It also increases chemical coverage to include molecules with intermediate or high vapor pressures, such as free fatty acids and semi-volatile organic compounds (SVOCs). We find that Cryo-OrbiSIMS reveals the hitherto unknown localization patterns of SVOCs with high spatial and chemical resolution in diverse plant, animal, and human tissues. We also show that Cryo-OrbiSIMS can be combined with genetic analysis to identify enzymes regulating SVOC metabolism. Cryo-OrbiSIMS is applicable to high resolution imaging of a wide variety of non-volatile and semi-volatile molecules across many areas of biomedicine.

Keywords: analytical methods; biological mass spectrometry imaging; lipids; semi-volatile molecules.


Conflict of interest statement

The authors declare no conflict of interest.

Figures

Figure 1
Figure 1
Cryo‐OrbiSIMS decreases molecular fragmentation and increases chemical coverage. Comparison of OrbiSIMS spectra of a latent fingerprint and a pine needle with positive polarity at cryogenic (−100 or −110 °C) and ambient (30 °C) temperatures using a 20 keV Ar3500 + GCIB with a ca. 3 μm spot size from a 400×400 μm field of view and 20×20 pixel resolution. Many more features are detected with cryogenic analysis, including putatively annotated intact triglycerides and semi‐volatile hydrocarbons. Fingerprint putative annotations: (1) m/z 551.5041, [C35H67O4]+ with mass deviation δ 1.4 ppm, C32:0 diacylglyceride adduct [M+H−H2O]+ (2) m/z 855.741, [C53H100O6Na]+ with mass deviation δ−0.25 ppm, C50:1 triacylglyceride adduct [M+Na]+. Pine needle putative annotations: (1) m/z 403.4295, [C29H55]+ with mass deviation δ−0.7 ppm, C29:0 hydrocarbon adduct [M−5 H]+ also identified in GC‐MS as [M]+. alongside a commercial standard (Supplementary Table 1) (2) m/z 509.4561, [C32H61O4]+ with mass deviation δ−0.6 ppm, C29:0 diacylglyceride adduct [M+H−H2O]+. (3) m/z 819.6379, [C48H88N2O6P]+ with mass deviation δ 0.6 ppm, C40:5 phosphatidylcholine adduct [M+NH4−H2O]+. A full list of putative peak annotations and validation methods is available in Supplementary Table 1.
Figure 2
Figure 2
Localization of semi‐volatile molecules in pine needles and latent fingerprints using Cryo‐OrbiSIMS. a) Positive polarity imaging of a latent fingerprint (diagram indicates eccrine pores) using a 30 keV Bi3 + LMIG with an approximate spot size of 0.5 μm and ToF analyzer of a 2.5×2.5 mm field of view with 5120×5120 pixel resolution, binned to 1280×1280 pixels. Sample substrate refers to the sum of m/z 27.98 (Si+) and m/z 393.95 (Au2 +), components of the gold‐coated silicon wafer. Other mass images show four compounds detected at cryogenic but not at ambient temperatures. Fingerprint putative annotations: m/z 299.1956 (detected in Orbitrap and ToF spectra), [C16H29O2Na2]+ (Orbitrap mass deviation δ−0.5 ppm), hexadecenoic acid (FA 16:1) adduct [M+2 Na−H]+. m/z 301.2113 (detected in Orbitrap and ToF spectra), [C16H31O2Na2]+ (Orbitrap mass deviation δ−0.4 ppm), palmitic acid (FA 16:0) adduct [M+2 Na−H]+. m/z 128.97 (detected only in ToF spectra), [Na3N2O2]+ (ToF mass deviation δ 30.6 ppm) localizes close to sweat pores. m/z 180.91 (detected only in ToF spectra), [NaP2O6]+ (ToF mass deviation δ 31.2 ppm) localizes in a pattern excluding sweat pores. Scale bars represent 0.625 mm. b) Positive polarity imaging of a pine needle (Pinus nigra, diagram indicates stomatal pores) using a 30 keV Bi3 + LMIG with an approximate spot size of 0.5 μm and ToF analyzer of a 500×500 μm field of view with 1024×1024 pixel resolution, binned to 256×256 pixels. Total ion count image shows position of stomatal pores and m/z 366.90 provides a diagnostic ion for the guard cells surrounding the pores and is detected at cryogenic but not ambient temperature. Pine needle putative annotations: m/z 255.17, [C18H35O2]+, linoleic acid (FA 18:2) adduct [M+H]+ is detected at both cryogenic and ambient temperatures and with the Orbitrap analyzer (m/z 255.2317 and mass deviation δ−0.7 ppm). m/z 95.12, [C7H11]+, likely represents a volatile hydrocarbon fragment and is also detected by EI‐GC‐MS/MS and OrbiSIMS MS/MS analysis of hydrocarbon standards (Supplementary Figure 4). m/z 403.09, [C29H55]+, is a C29:0 hydrocarbon adduct [M−5 H]+ also detected with the Orbitrap analyzer (m/z 403.4295 and mass deviation δ−0.7 ppm) and in the [M]+. form via GC‐MS alongside a commercial standard (Supplementary Table 1). The [M−5 H]+ ion is not the most abundant hydrocarbon adduct but is shown due to clear separation from surrounding peaks. Scale bars represent 125 μm. In both panels, the intensity ranges (in counts) are represented beneath each mass image.
Figure 3
Figure 3
Metabolic regulation of hydrocarbons on the male Drosophila abdominal cuticle. b) OrbiSIMS positive polarity spectra using a 20 keV Ar3500 + GCIB with a spot size of ca. 3 μm highlights that many more features are detected at cryogenic (−105 °C) than at ambient (30 °C) temperatures. Spectra were taken from a field of view of 400×400 μm with 20×20 pixel resolution. Putative annotations: (1) m/z 338.378, [C23H48N]+ with mass deviation δ 1.43 ppm, C23:0 hydrocarbon adduct [M+N]+, (2) m/z 394.440, [C27H56N]+ with mass deviation δ 0.99 ppm, C27:0 hydrocarbon adduct [M+N]+, (3) m/z 422.472, [C29H60N]+ with mass deviation δ 1.04 ppm, C29:0 hydrocarbon adduct [M+N]+. c) Cryo‐OrbiSIMS Orbitrap positive polarity spectra using a 20 keV Ar3500 + GCIB with a spot size of ca. 3 μm show that cuticular hydrocarbon signals are abundant in genetic control animals (control) but strongly decreased in response to RNAi knockdown of a hydrocarbon biosynthetic enzyme (Cyp4g1 RNAi)—see Experimental Section. Graph shows fold changes of C23 to C29 hydrocarbons in Cyp4g1 RNAi animals versus controls. Bars represent mean, error bars are standard deviation. Spectra were taken from a field of view of 400×400 μm with 20×20 pixel resolution.
Figure 4
Figure 4
Restricted localization of wax esters on the male Drosophila abdominal cuticle. a) The cuticle of the male Drosophila abdomen, indicating subdivision into bristle‐bearing ventral plates (sternites) and a bristle‐free lateral region (pleura). b) Cryogenic OrbiSIMS ToF imaging in positive polarity using a 30 keV Bi3 + LMIG with a spot size of ca. 0.5 μm for a 500×500 μm field of view with 1024×1024 pixel resolution, binned to 256×256 pixels. The charge coupled device (CCD) shows the optical image of the acquired area, with sternites and pleura visible and the corresponding total ion counts at each pixel are shown. Abundant cuticular hydrocarbons are widely distributed across the sternites and pleura of the cuticle. Putative annotations: m/z 323.27, [C23H47]+, tricosane adduct [M−H]+, also detected via GC‐MS as [M]+. and confirmed with an analytical standard. m/z 95.07, [C7H11]+, hydrocarbon fragment also detected in EI‐GC/MS and OrbiSIMS Orbitrap MS/MS spectra of hydrocarbon standards (Supplementary Figure 5). Scale bars represent 125 μm c. Ambient OrbiSIMS Orbitrap imaging in negative polarity using a 20 keV Ar3500 + GCIB with a spot size of ca. 3 μm of a 400×400 μm field of view with 40×40 pixels. The charge coupled device (CCD) shows the optical image of the acquired area, with sternites and pleura visible and corresponding total intensities at each pixel are also shown. Putative annotations: m/z 703.7341, [C48H95O2] (mass deviation δ 0.5 ppm), C48:0 saturated wax ester (WE 48:0) near‐uniform across sternites and pleura. m/z 841.8745, [C58H113O2] (mass deviation δ−0.1 ppm), C58:1 unsaturated wax ester (WE 58:1) enriched on sternites. m/z 731.7656, [C50H99O2] (mass deviation δ 0.7 ppm), C50:0 saturated wax ester (WE 50:0) enriched on pleura. Scale bars represent 100 μm.

References

    1. Liberles S. D., Annu. Rev. Physiol. 2014, 76, 151–175. - PMC - PubMed
    1. Yew J. Y., Chung H., Prog. Lipid Res. 2015, 59, 88–105. - PubMed
    1. Xu H., Turlings T. C. J., Trends Plant Sci. 2018, 23, 100–111. - PubMed
    1. Lucattini L., Poma G., Covaci A., de Boer J., Lamoree M. H., Leonards P. E. G., Chemosphere 2018, 201, 466–482. - PubMed
    1. Vrkoslav V., Muck A., Cvačka J., Svatoš A., J. Am. Soc. Mass Spectrom. 2010, 21, 220–231. - PubMed

Publication types

MeSH terms

Substances

LinkOut - more resources