. 2020 Jun 30;15(6):e0235360.
doi: 10.1371/journal.pone.0235360. eCollection 2020.

Sodium-calcium exchanger 1 is the key molecule for urinary potassium excretion against acute hyperkalemia

Affiliations

Sodium-calcium exchanger 1 is the key molecule for urinary potassium excretion against acute hyperkalemia

Wakana Shoda et al. PLoS One. .

Abstract

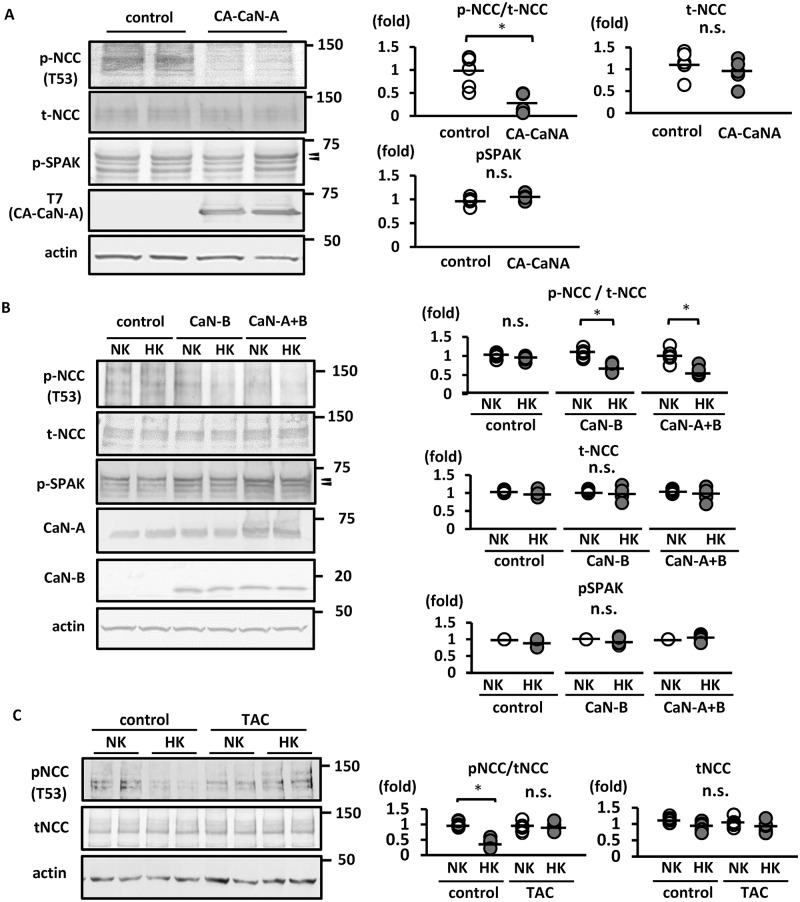
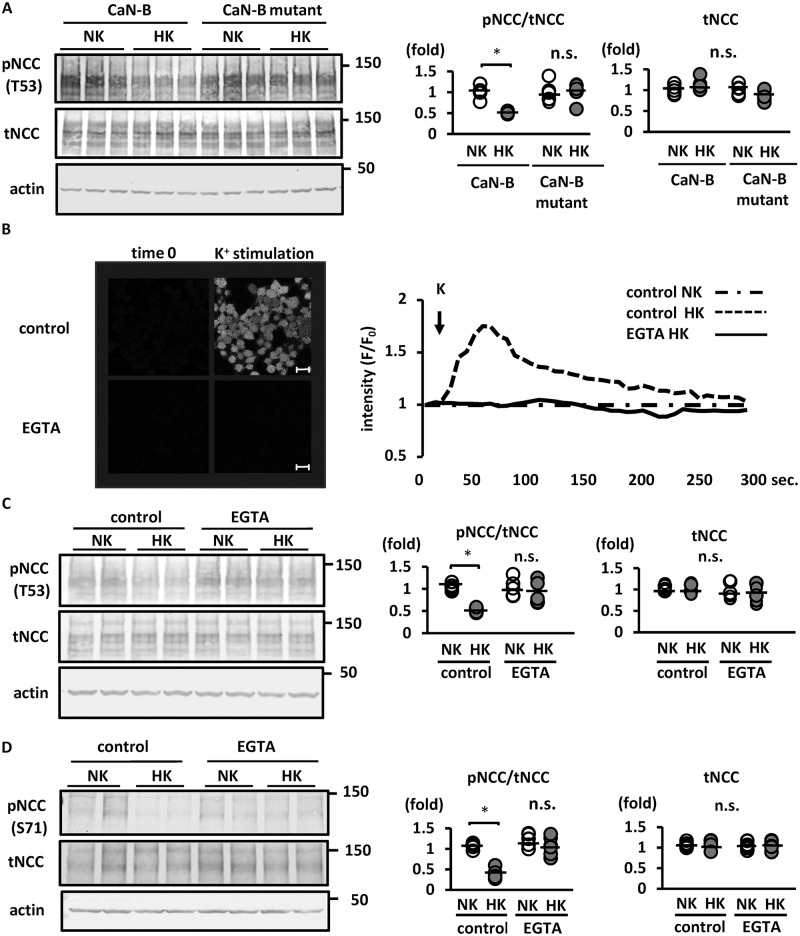
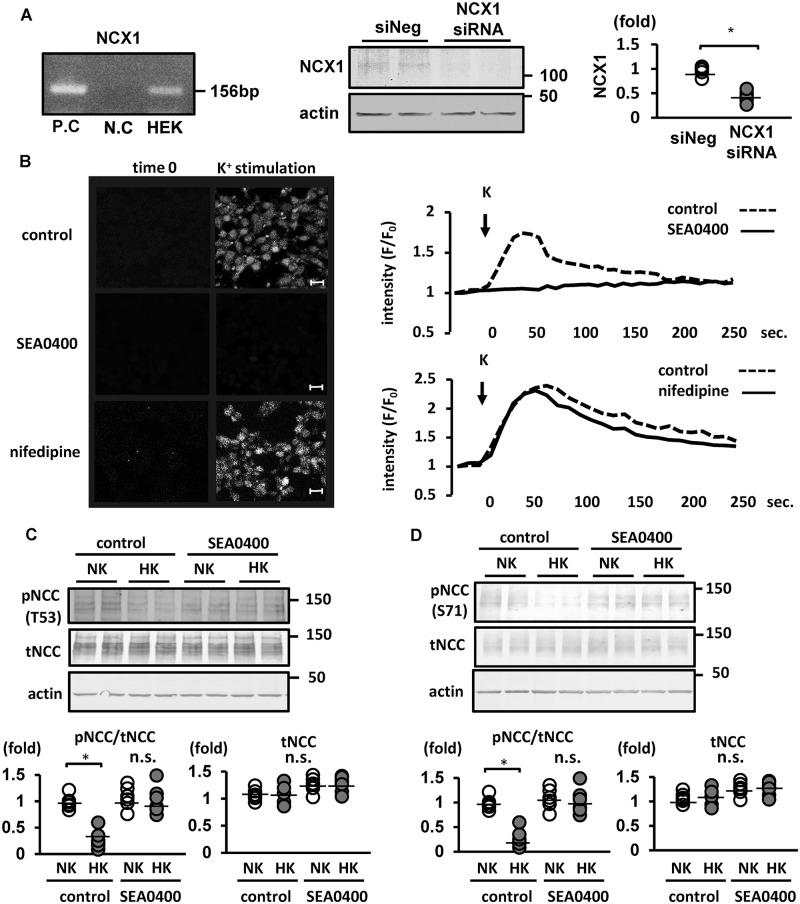
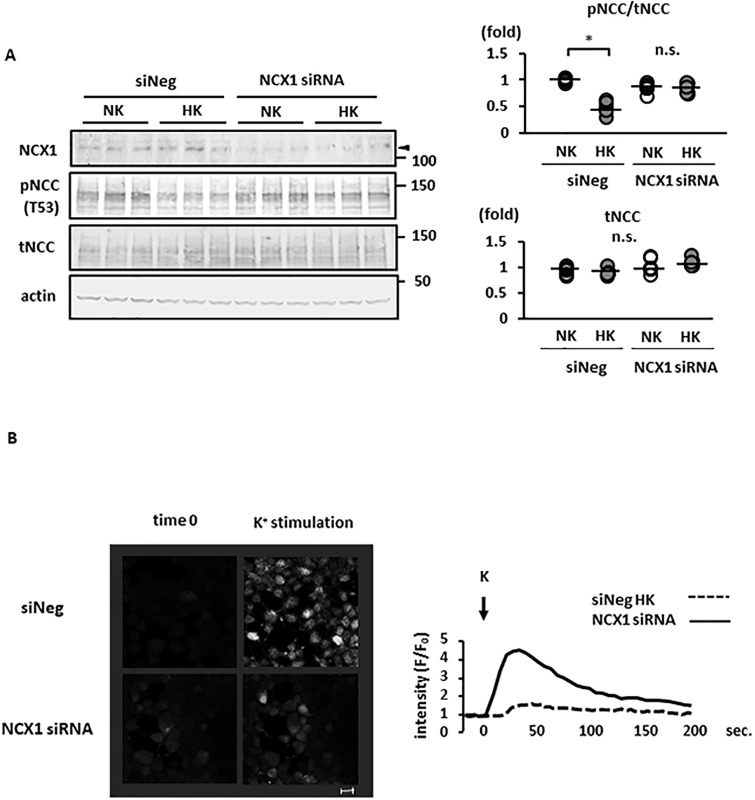
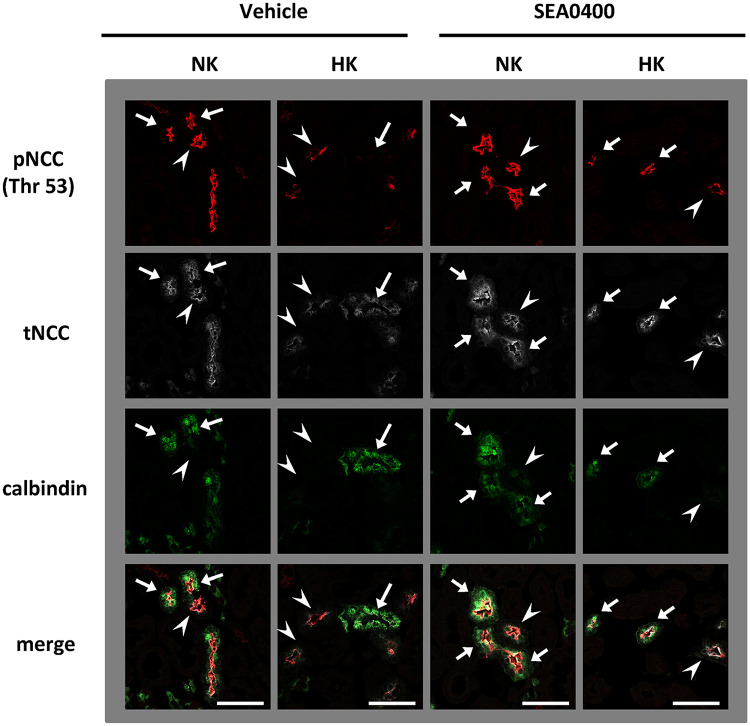
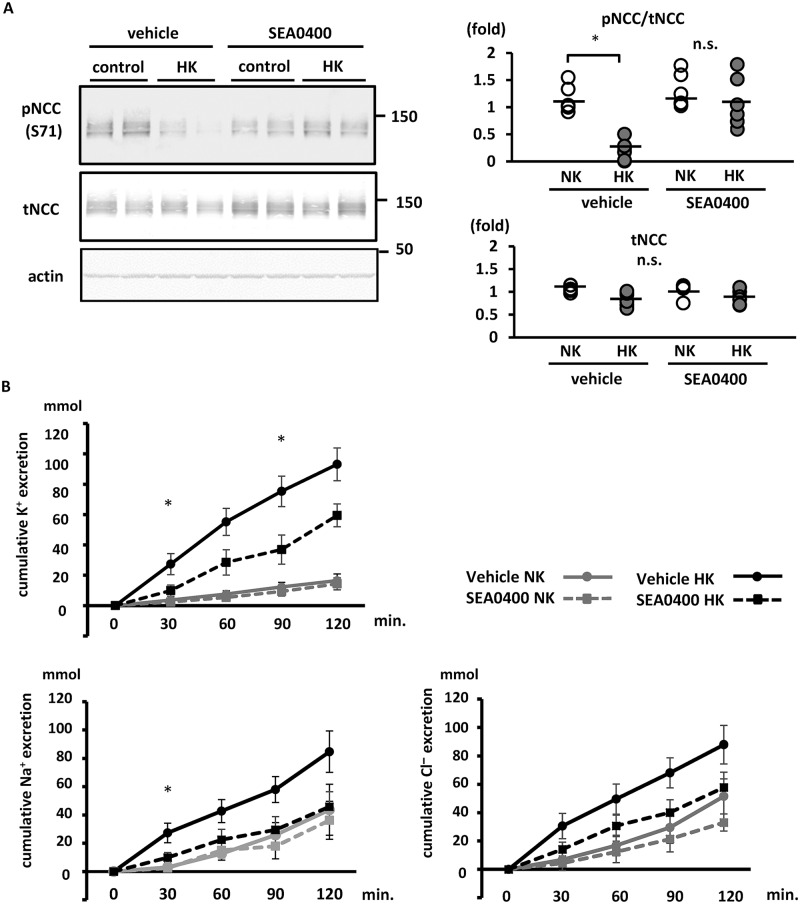
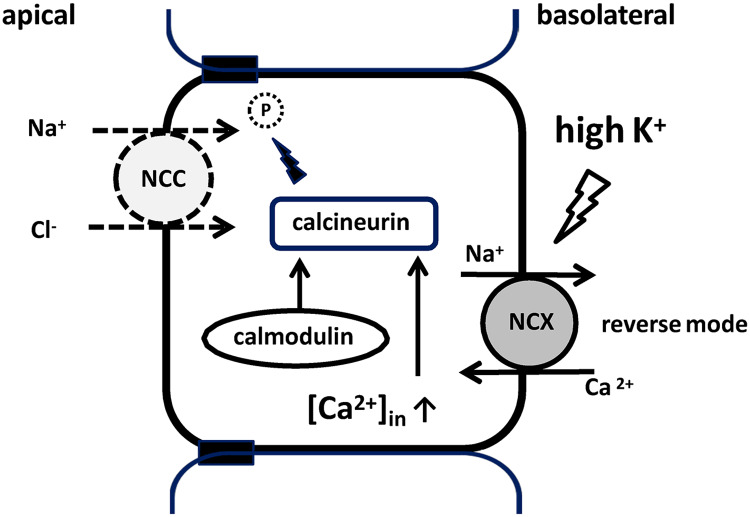
The sodium (Na+)-chloride cotransporter (NCC) expressed in the distal convoluted tubule (DCT) is a key molecule regulating urinary Na+ and potassium (K+) excretion. We previously reported that high-K+ load rapidly dephosphorylated NCC and promoted urinary K+ excretion in mouse kidneys. This effect was inhibited by calcineurin (CaN) and calmodulin inhibitors. However, the detailed mechanism through which high-K+ signal results in CaN activation remains unknown. We used Flp-In NCC HEK293 cells and mice to evaluate NCC phosphorylation. We analyzed intracellular Ca2+ concentration ([Ca2+]in) using live cell Ca2+ imaging in HEK293 cells. We confirmed that high-K+-induced NCC dephosphorylation was not observed without CaN using Flp-In NCC HEK29 cells. Extracellular Ca2+ reduction with a Ca2+ chelator inhibited high-K+-induced increase in [Ca2+]in and NCC dephosphorylation. We focused on Na+/Ca2+ exchanger (NCX) 1, a bidirectional regulator of cytosolic Ca2+ expressed in DCT. We identified that NCX1 suppression with a specific inhibitor (SEA0400) or siRNA knockdown inhibited K+-induced increase in [Ca2+]in and NCC dephosphorylation. In a mouse study, SEA0400 treatment inhibited K+-induced NCC dephosphorylation. SEA0400 reduced urinary K+ excretion and induced hyperkalemia. Here, we identified NCX1 as a key molecule in urinary K+ excretion promoted by CaN activation and NCC dephosphorylation in response to K+ load.


Conflict of interest statement

The authors have declared that no competing interests exist.

Figures

Fig 1
Fig 1. Calcineurin activity is essential for K+-induced rapid NCC dephosphorylation in Flp-In NCC HEK293 cells.
A. (left) Representative immunoblots of CA-CaN-A overexpressed in Flp-In NCC HEK293 cells. CA-CaN-A significantly decreased the abundance of phosphorylated NCC. The abundance of phosphorylated SPAK shows no significant change in CA-CaN-A overexpression. (right) Quantitative analysis of the total and phosphorylated NCC ratio and phosphorylated SPAK in dot plots (n = 6). *p < 0.05 by unpaired t-test. B. (left) Representative immunoblots of Flp-In NCC HEK293 cells wherein CaN-B or CaN-A+CaN-B were overexpressed. Endogenous CaN-B was not expressed in Flp-In NCC HEK293 cells. Phosphorylated NCC level was decreased following high-K+ stimulation for 15 min in Flp-In NCC HEK293 cells, in which CaN-B or CaN-A+CaN-B were overexpressed. (right) Quantitative analysis of the total and phosphorylated NCC ratio and phosphorylated SPAK in dot plots (n = 6). *p < 0.05 by Tukey’s test after multiple-way ANOVA. C. (left) Representative immunoblots of Flp-In NCC HEK293 cell treated with 1 μM tacrolimus. Treatment with tacrolimus for 1 h inhibited K+-induced NCC dephosphorylation in Flp-In NCC HEK293 cells. (right) Quantitative analysis of the total and phosphorylated NCC ratio in dot plots (n = 6). *p < 0.05 by Tukey’s test after two-way ANOVA. NCC, sodium–chloride cotransporter; pNCC, phosphorylated sodium–chloride cotransporter; tNCC, total sodium–chloride cotransporter; pSPAK, phosphorylated Ste20-related proline/alanine-rich kinase; NK, normal potassium (K+ 3 mM); HK, high potassium (K+ 10 mM); CaN-A, calcineurin A; CaN-B, calcineurin B; CA-CaN-A, constitutively active CaN-A; TAC, tacrolimus; n.s., not significant. Arrow heads indicate p-SPAK bands.
Fig 2
Fig 2. Ca2+ influx after high-K+ stimulation is essential for NCC dephosphorylation in Flp-In NCC HEK293 cells.
A. (left) Representative immunoblots of Ca2+-binding-deficient CaN-B (CaN-B mutant) overexpressed in Flp-In NCC HEK293 cells. Overexpression of Ca2+-binding-deficient CaN-B suppressed K+-induced NCC dephosphorylation. (right) Quantitative analysis of the total and phosphorylated NCC ratio in dot plots (n = 6). *p < 0.05 by Tukey’s test after two-way ANOVA. B. (left) Representative images of Fluo 4 intensity 30 s after K+ administration. K+ (10 mM final concentration) was added to Flp-In NCC HEK293 cells in an EGTA-containing medium or control medium. The increased Fluo 4 fluorescence intensity following addition of K+ was inhibited in the EGTA-containing medium. Scale bars, 20 μm. (right) Representative time-course of Fluo 4 fluorescence intensity. The x and y axes indicate time and Fluo 4 fluorescence intensity, respectively. C. (left) Representative immunoblots of Flp-In NCC HEK293 cells in 5 mM EGTA-containing medium. The high-K+-induced reduction in phosphorylated NCC level was inhibited in the EGTA-containing medium. (right) Quantitative analysis of the total and phosphorylated NCC ratio in dot plots (n = 6). *p < 0.05 by Tukey’s test after two-way ANOVA. D. (left) Representative immunoblots of mouse kidney slices ex vivo. The high-K+-induced reduction in phosphorylated NCC level was inhibited in the EGTA-containing medium. (right) Quantitative analysis of the total and phosphorylated NCC ratio in dot plots (n = 6). *p < 0.05 by Tukey’s test after two-way ANOVA. NCC, sodium–chloride cotransporter; pNCC, phosphorylated sodium–chloride cotransporter; tNCC, total sodium–chloride cotransporter; NK, normal potassium (K+ 3 mM); HK, high potassium (K+ 10 mM); CaN-B, calcineurin B; n.s., not significant.
Fig 3
Fig 3. Pharmacological suppression of sodium–calcium exchanger (NCX) 1 inhibited the increase in [Ca2+]in and sodium–chloride cotransporter (NCC) dephosphorylation following high-K+ stimulation in Flp-In NCC HEK293 cells.
A. (left) mRNA expression of NCX1 was observed in Flp-In NCC HEK293 cells. Samples containing distilled water and human brain cDNA were used as negative and positive controls, respectively. P.C., positive control; N.C., negative control. (middle) Representative immunoblots of NCX1 in Flp-In NCC HEK293 cells with NCX1 siRNA. (right) Quantitative analysis of protein levels of NCX1 in Flp-In NCC HEK293 cells with NCX1 siRNA (n = 6). NCX1 protein expression was significantly reduced after NCX1 silencing with siRNA (n = 6). siNeg, negative control with siRNA, * represents significant differences at p <0.05 using an unpaired t-test. B. (left) Representative images of Fluo-4 fluorescence intensity 30 s after K+ administration. A 10 mM final concentration of K+ was added to Flp-In NCC HEK293 cells with/without 1 μM SEA0400. Increased Fluo-4 fluorescence intensity following K+ administration was inhibited through treatment with SEA0400. Scale bars, 20 μm. (right) Representative time-course of Fluo-4 fluorescence intensity. The x and y axes indicate time and Fluo-4 fluorescence intensity, respectively. Nifedipine (1 μM) was used as the negative control. C. (upper) Representative immunoblots of a Flp-In NCC HEK293 cell treated with 1 μM SEA0400. Treatment with SEA0400 inhibited K+-induced NCC dephosphorylation. (lower) Quantitative analysis of the total and phosphorylated NCC in dot plots (n = 6). *p < 0.05 by Tukey’s test after two-way ANOVA. n.s., not significant. NK, normal potassium (K+ 3 mM); HK, high potassium (K+ 10 mM). D. (upper) Representative immunoblots of mouse kidney slices ex vivo. Treatment with 50 μM SEA0400 inhibited K+-induced NCC dephosphorylation. (lower) Quantitative analysis of the total and phosphorylated NCC in dot plots (n = 6). *p < 0.05 by Tukey’s test after two-way ANOVA. n.s., not significant. NK, normal potassium (K+ 3 mM); HK, high potassium (K+ 10 mM).
Fig 4
Fig 4. Sodium–calcium exchanger (NCX) 1 silencing with small interfering RNA (siRNA) suppressed K+-induced sodium–chloride cotransporter (NCC) dephosphorylation.
A. (left) Representative immunoblots of Flp-In NCC HEK293 cells with NCX1 siRNA, which inhibited K+-induced NCC dephosphorylation. (right) Quantitative analysis of the total and phosphorylated NCC in dot plots (n = 6). * represents significant differences at p <0.05 using Tukey’s test after a two-way ANOVA. n.s., not significant. B. (left) Representative images of Fluo-4 fluorescence intensity 30 s after K+ administration. K+ was added to Flp-In NCC HEK293 cells with NCX1 siRNA and the negative control siRNA (siNeg). The increase in Fluo-4 fluorescence intensity following K+ administration was attenuated in NCX1-silenced cells. Scale bars, 20 μm. (right) Representative time-course of Fluo-4 fluorescence intensity. The x and y axes indicate time and Fluo 4 fluorescence intensity, respectively. NK, normal potassium (K+ 3 mM); HK, high potassium (K+ 10 mM).
Fig 5
Fig 5. K+-induced NCC dephosphorylation is observed mainly in late DCT.
Representative immunofluorescences. Calbindin was used as a marker of late DCT. NCC expressed early DCT (arrow heads) and late DCT (arrows). K+-induced NCC dephosphorylation was observed mainly in late DCT. The K+-induced dephosphorylation of NCC in late DCT was inhibited by SEA0400 treatment. Red: pNCC (Thr 53), white: tNCC, green: Calbindin. Scale bars indicate 50 μm.
Fig 6
Fig 6. Sodium–calcium exchanger (NCX) 1 contributes to the rapid NCC dephosphorylation and kaliuresis following K+ oral administration in mice.
A. (left) Representative immunoblots of total and phosphorylated NCC in mouse kidneys treated with SEA0400. SEA0400 or vehicle was intraperitoneally injected, 1 h before K+ oral gavage. Kidneys were collected 15 min after oral gavage. The rapid NCC dephosphorylation following the K+ load was significantly inhibited by treatment with SEA0400. (right) Quantitative analysis of blots from both the total and phosphorylated NCC in mouse kidneys shown in dot plots (n = 6). *p < 0.05 by Tukey’s test after two-way ANOVA. B. Cumulative analysis of urinary K+, Na+ and Cl excretion following K+ oral gavage (n = 6). Mice were pre-treated with SEA0400 1 h before K+ oral gavage. Following K+ administration, urine was collected every 30 min. In the SEA0400-treated mice, urinary K+ excretion was significantly suppressed at 30 and 90 min after K+ administration. The urinary Na+ excretion was significantly suppressed at 30 min after K+ administration. Urinary Cl excretion was lower at all-time points in SEA0400-treated mice; however, the difference was not statistically significant. Mean ± standard error of the mean. *represents significant differences at p <0.05 using Tukey’s test after a two-way ANOVA at each time point.
Fig 7
Fig 7. K+-induced NCC dephosphorylation via CaN: The proposed mechanism.
High plasma K+ level depolarizes the cell membrane potential, leading to Ca2+ influx through reverse-mode NCX and consequently an increase in [Ca2+]in. The increase in [Ca2+]in activates CaN, which dephosphorylates NCC. Na+, sodium; Ca2+, calcium; K+, potassium; P, phosphorylation; [Ca2+]in, intracellular calcium concentration; NCC, sodium–chloride cotransporter; NCX, sodium–calcium exchanger.

References

    1. Mente A, O’Donnell MJ, Rangarajan S, McQueen MJ, Poirier P, Wielgosz A, et al. Association of urinary sodium and potassium excretion with blood pressure. N Engl J Med. 2014;371(7):601–11. 10.1056/NEJMoa1311989 . - DOI - PubMed
    1. Riphagen IJ, Gijsbers L, van Gastel MD, Kema IP, Gansevoort RT, Navis G, et al. Effects of potassium supplementation on markers of osmoregulation and volume regulation: results of a fully controlled dietary intervention study. J Hypertens. 2016;34(2):215–20. 10.1097/HJH.0000000000000786 . - DOI - PubMed
    1. Aburto NJ, Hanson S, Gutierrez H, Hooper L, Elliott P, Cappuccio FP. Effect of increased potassium intake on cardiovascular risk factors and disease: systematic review and meta-analyses. BMJ. 2013;346:f1378 Epub 2013/04/03. 10.1136/bmj.f1378 - DOI - PMC - PubMed
    1. Geleijnse JM, Witteman JC, Stijnen T, Kloos MW, Hofman A, Grobbee DE. Sodium and potassium intake and risk of cardiovascular events and all-cause mortality: the Rotterdam Study. Eur J Epidemiol. 2007;22(11):763–70. Epub 2007/09/28. 10.1007/s10654-007-9186-2 - DOI - PMC - PubMed
    1. Mente A, O’Donnell M, Rangarajan S, McQueen M, Dagenais G, Wielgosz A, et al. Urinary sodium excretion, blood pressure, cardiovascular disease, and mortality: a community-level prospective epidemiological cohort study. Lancet. 2018;392(10146):496–506. Epub 2018/08/09. 10.1016/S0140-6736(18)31376-X . - DOI - PubMed

Publication types