. 2020 Oct 5;217(10):e20200483.
doi: 10.1084/jem.20200483.

Single-cell analysis of germinal-center B cells informs on lymphoma cell of origin and outcome

Affiliations

Single-cell analysis of germinal-center B cells informs on lymphoma cell of origin and outcome

Antony B Holmes et al. J Exp Med. .

Abstract

In response to T cell-dependent antigens, mature B cells are stimulated to form germinal centers (GCs), the sites of B cell affinity maturation and the cell of origin (COO) of most B cell lymphomas. To explore the dynamics of GC B cell development beyond the known dark zone and light zone compartments, we performed single-cell (sc) transcriptomic analysis on human GC B cells and identified multiple functionally linked subpopulations, including the distinct precursors of memory B cells and plasma cells. The gene expression signatures associated with these GC subpopulations were effective in providing a sc-COO for ∼80% of diffuse large B cell lymphomas (DLBCLs) and identified novel prognostic subgroups of DLBCL.


Conflict of interest statement

Disclosures: N. Compagno is currently employed at Novartis. No other disclosures were reported.

Figures

None
Graphical abstract
Figure S1.
Figure S1.
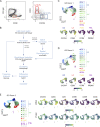
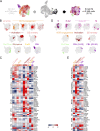
Identification of GC B cell subpopulations by sc-RNAseq and CITE-seq in distinct donors. Related to Fig. 1. (A) Representative counterplots and gating strategy from cytofluorimetric analysis of human GC (CD3/IgD/CD38+), DZ (CD3/IgD/CD38+/CD83lo/CXCR4hi), and LZ (CD3/IgD/CD38+/CD83hi/CXCR4lo) B cells isolated from tonsil tissue are shown. (B) Overview of the computational steps used to analyze sc-RNAseq data indicating the software tools used (black labels). (C) UMAP projection of 4,759 GC B cells (CD3, IgD, CD38+) isolated from Donor 1. Cells are colored by clusters identified by PhenoGraph and assigned to one of the following groups: DZ, intermediate (INT), LZ, PreM, or PBL. UMAP projections colored by the z-scored expression of CXCR4 (DZ), CD83 (LZ), CCR6 (PreM), and PRDM1 (PBL) are displayed below. (D) UMAP projection of 3,609 GC B cells (CD3/IgD/CD38+) isolated from Donor 2. Cells were clustered and colored using the same methods as for Donor 1. Below, the same gene expression markers described for Donor 1 are shown for Donor 2. (E) CITE-seq analysis of 8,871 GC B cells (CD3, IgD, CD38+) isolated from Donor 3. Left: UMAP projection based on mRNA data. Cells were clustered and colored using the same methods as for Donors 1 and 2. Right: UMAP projections colored by normalized z-scored mRNA expression (top) and center log ratio normalized protein expression (bottom) as measured by ADTs for selected markers (CXCR4, CD83, CD9, CCR6, CD69, and CD44).
Figure 1.
Figure 1.
Identification of GC B cell subpopulations by sc-transcriptomic analysis. (A) UMAP projection of sc-RNAseq profiles of 8,368 GC B cells (CD3, IgD, CD38+) isolated from two donors. sc-RNAseq data were merged upon batch effect correction performed by the Seurat package. Clusters in the UMAP plots were identified by PhenoGraph and color coded according to different cell stages: DZ, LZ, intermediate (INT), PreM, and PBL. (B) UMAP projections of the z-scored expression of selected marker genes associated with distinct stages. (C) Heat map displaying the relative expression, as fold change (log2), of selected genes in the GC B cell clusters identified in A. (D–F) Top panels: UMAP projections of GC (D), DZ (E), and LZ (F) B cells color coded based on the expression (black dots) or not (gray dots) of genes associated with the S-G2-M stages of the cell cycle. Bottom panels: the UMAP projections were colored based on the z-scored expression of four representative genes associated with the S-G2-M stages of the cell cycle. See also Fig. S1.
Figure 2.
Figure 2.
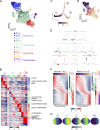
GC B cell developmental stages. (A) UMAP projection and cluster identification from sc-RNAseq profiles of 4,984 GC B cells in G0-G1 stages of the cell cycle. (B) The heat map shows the top 50 up- and down-regulated genes for each cluster. Genes that are significantly differentially expressed in more than one cluster are displayed in association with the cluster in which they show the best fold change. The heat map is colored by the log2 fold change of the average expression. (C) Pseudo-time analysis by Monocle of the sc-RNAseq profiles displayed in A. The projection is colored by normalized pseudo-time. Numbers in the circle identify distinct branches. (D) UMAP projection colored by normalized pseudo-time analysis. (E) Mapping of the PhenoGraph clusters on the pseudo-time plot. (F) Heat map of pseudo-time gene expression changes. On the right, genes are labeled based on the phenotype in which they display the largest log2 fold change. (G) Spatial reconstruction of the inferred locations of GC subpopulations in an idealized GC structure using novoSpaRc. The most likely inferred spatial position of a given cell type is denoted by its normalized score ranging from high (1, yellow) to low (0, blue) confidence values. See also Fig. S2, Table S1, and Table S2.
Figure S2.
Figure S2.
GC B cell developmental stages. Related to Fig. 2. (A) UMAP projection of the 4,984 GC B cells (CD3, IgD, CD38+) in G0-G1 phases of the cell cycle color coded to highlight the individual clusters identified by PhenoGraph (upper panels). The same UMAP projection showing the z-scored gene expression of selected markers (lower panels). (B) GSEA of sc-cluster gene signatures of DZ and LZ. (C) GSEA of intermediate (INT) subpopulations using the expression profile of bulk purified human DZ versus LZ RNAseq samples. (D) GSEA of sc-cluster PreM gene signatures using the expression profile of bulk purified human GC and memory RNAseq samples (left). GSEA of the sc-cluster PBL-b gene signatures using the expression profile of human GC versus tonsillar plasma cells RNAseq samples from Gene Expression Omnibus accession no. GSE114816 (right). The gene signatures include all genes that display a log2 fold change >1.5 or at least the top 50 differentially expressed genes. ES, enrichment score; NES, normalized enrichment score.
Figure 3.
Figure 3.
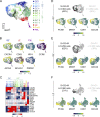
DZ B cell subpopulations. (A) UMAP projection and cluster identification from sc-RNAseq profiles of 8,468 DZ B cells (CD3, IgD, CD38+, CXCR4hi, CD83lo). Black and gray dots mark B cells that respectively express (left) or do not express (right) genes associated with the S-G2-M stages of the cell cycle. UMAP projections and cluster identification were performed independently for cells in the two cell cycle groups. (B) UMAP projection and cluster identification by PhenoGraph of DZ GC B cells that express genes associated with the S-G2-M stages of the cell cycle. (C) Heat map displaying the relative expression fold change (log2) of selected genes in the DZ B cell clusters identified in B. (D) Pathway enrichment analysis for the gene signatures associated with the clusters identified in B. Pathways from KEGG database (KG), Hallmark database (HM), and Biocarta database that are significantly enriched (hypergeometric test with Benjamini-Hochberg correction, q < 0.05) are shown in gray. (E) UMAP projection and cluster identification by PhenoGraph of DZ GC B cells that are at the G0-G1 stages of the cell cycle. (F) Heat map displaying the relative expression fold change (log2) of selected genes in the DZ B cell clusters identified in E. See also Table S3. Ox-Phos, oxidative phosphorylation.
Figure 4.
Figure 4.
LZ B cell subpopulations. (A) UMAP projection and cluster identification from sc-RNAseq profiles of 11,118 LZ B cells (CD3, IgD, CD38+, CXCR4lo, CD83hi). Black and gray dots mark B cells that respectively express (right) or do not express (left) genes associated with the S-G2-M stages of the cell cycle. UMAP projections and cluster identification were performed independently for cells in the two cell cycle groups. (B) UMAP projection and cluster identification by PhenoGraph of LZ GC B cells at the G0-G1 stages of the cell cycle. (C) Heat map displaying the relative expression fold change (log2) of selected genes in LZ B cell clusters identified in B. (D) UMAP projection and cluster identification by PhenoGraph of LZ GC B cells that express genes associated with the S-G2-M stages of the cell cycle. (E) Heat map displaying the relative expression fold change (log2) of selected genes in LZ B cell clusters identified in D. See also Table S4. Ox-Phos, oxidative phosphorylation.
Figure 5.
Figure 5.
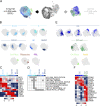
Memory B cell precursors. (A) GSEA of PreM sc-cluster signatures in the expression profiles of purified bulk populations of CCR6+ versus CCR6 LZ GC B cells, memory (Mem) versus LZ GC B cells, and memory versus naive B cells. (B) Heat map displaying, in the GC B cell clusters identified in Fig. 2, the relative expression fold change (log2) of selected PreM signature genes. (C) UMAP projection and cluster identification of 1,542 GC B cells from clusters displaying enrichment for PreM signature genes. (D) Heat map displaying the relative expression fold change (log2) of selected PreM signature genes in the clusters identified in C. (E and F) Immunofluorescence analysis of BANK1, CELF2, and MEF2B (E) or BCL6 (F) in tonsil sections. Nuclei were stained with DAPI. In the high-magnification insets, arrows point to representative cells displaying marker coexpression. Bar plots display the percentage of BANK1+ cells coexpressing the indicated markers. Each bar plot shows the average cell counts and standard deviations in three independent donors. In total, 373 GCs were analyzed for each staining combination. The scale bar corresponds to 100 µm. See also Fig. S3. NES, normalized enrichment score.
Figure S3.
Figure S3.
Memory B cell precursors. Related to Fig. 5. (A) Heat map showing the fold change (log2) of selected genes in the PreM gene signature in the DZ clusters (cells in G0-G1 phases of the cell cycle). (B) Heat map showing the relative expression fold change (log2) of selected genes in the PreM gene signature in the LZ clusters (cells in G0-G1 phases of the cell cycle). (C) Immunofluorescence analysis of BANK1 (red), CELF2 (cyan), and PAX5 (green) in tonsil tissue sections. High magnification at the sc level shows costaining of BANK1/CELF2/PAX5 (insets). Bar plot shows the percentage of BANK1+ cells coexpressing the indicated markers. The average and standard deviation were calculated from the cell counts of 570 GCs in five donors. (D) Immunofluorescence analysis of BANK1 (red), CELF2 (cyan), and MEF2B (green) in tonsil tissue sections. High magnification (insets with yellow border) of the GC border shows the inner part of the GC, marked by the thick dotted line, which has been considered for the analysis. Scale bar = 100 µm. Ox-Phos, oxidative phosphorylation.
Figure 6.
Figure 6.
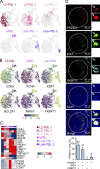
Plasma cell precursors. (A) UMAP projection and PhenoGraph clusters of 1,231 PBLs identified from the analysis of GC B cells. (B) UMAP projections colored based on the z-scored expression of genes associated with distinct stages of PBL development. (C) Heat map displaying the relative expression fold change (log2) of selected genes differentially expressed across the clusters detected in A. (D) Immunofluorescence analysis of PRDM1, IRF4, and FKBP11 in tonsil sections. Nuclei were stained with DAPI. In the high-magnification insets, arrows point to representative cells displaying marker coexpression. The bar plot displays the percentage of PRDM1+ cells coexpressing the indicated markers, and it shows the average cell counts and standard deviations in five donors. In total, 362 GCs were analyzed. The scale bar corresponds to 100 µm. ePBL, early PBL.
Figure S4.
Figure S4.
Development of a classifier based on the sc-RNAseq gene signatures. Related to Fig. 7. (A) Overview of sc-RNAseq classifier algorithm. (B) Classification of purified normal B cell populations (GC, DZ, LZ, and Memory) using bulk gene expression profiles and the GC B cell sc-cluster gene signatures. Each signature is identified by comparing a specific sc-cluster with the “Rest,” which refers to all other clusters. A normalized score from −1 (“Rest”) to 1 (cluster of interest), depending on the similarity to each phenotype, is assigned to each sample. The gray area indicates the region that is not statistically significant from a bootstrap test permuting gene in the signatures randomly 1,000 times. Samples with a more extreme absolute score outside the gray area were assigned to either the cluster phenotype (positive score) or the “Rest” (negative score).
Figure 7.
Figure 7.
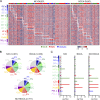
GC B cell signatures define lymphoma subgroups. (A) Heat map summarizing the sc-based classification of two panels of DLBCL primary cases for which bulk RNAseq profiles were previously reported. The datasets included 481 (NCI-DLBCL; Schmitz et al., 2018) and 230 (BCCA-DLBCL; Arthur et al., 2018) expression profiles and were representative of the current COO groups (259 GCB, 333 ABC, and 119 unclassified [Unclass]). Each column represents a DLBCL specimen, and each row displays the relative z-scored expression of an sc-classifier gene. The sc-RNAseq signatures include the top 50 up-regulated and the top 50 down-regulated genes in each GC cluster. The specific sc-clusters are labeled on the left of the heat map, while DLBCL cases are labeled based on the COO classification on the top. DLBCL samples are grouped based on their best classifier score. (B) Distribution of the DLBCL sc-cluster assignments in the NCI, BCCA, and merged datasets. Pies are color coded based on the sc-COO groups. Gray depicts the fraction of DLBCLs that remain unclassified by sc-COO classification. (C) Enrichment analysis in the sc-clusters of NCI, BCCA, or merged DLBCL cases based on their COO assignment (hypergeometric test with Benjamini-Hochberg correction, q < 0.05). See also Fig. S4, Fig. S5, and Table S5.
Figure S5.
Figure S5.
GC B cell signatures define lymphoma subgroups. Related to Figs 7, 8, and 9. (A) Distribution of the GCB, ABC, and unclassified (Unclass) DLBCL groups from the combined NCI and BCCA datasets within each sc-cluster. (B) Enrichment analysis in the GC clusters defined by the sc-signatures of the genetic classes reported in Schmitz et al., 2018 (left panel) or in Chapuy et al., 2018 (right panel) within the NCI-DLBCL dataset. (C) Kaplan-Meier plot for PFS analysis of the COO subgroups in the NCI-DLBCL (upper panel) and BCCA-DLBCL (lower panel) datasets. P values were obtained using a Mantel-Cox test. (D–F) Kaplan-Meier plots for PFS analysis of NCI-DLBCL (D), BCCA-DLBCL (E), and merged NCI+BCCA–DLBCL (F) samples grouped by classifier assignment to one of the 13 sc-COO clusters. (G) Enrichment analysis in the sc-COO subgroups of the DHITsig cases (Ennishi et al., 2019) in the GCB NCI-DLBCL and BCCA-DLBCL. (H) Kaplan-Meier plot for PFS analysis of the DHITsig-positive (pos) and DHITsig-negative (neg) GCB NCI-DLBCL and BCCA-DLBCL cases. (I) DHITsig-positive cases are grouped based on their sc-COO assignment. Groups I to V are defined as follows: Group I (DZ-a); Group II (DZ-b, DZ-c); Group III (INT-a, INT-b, INT-c); Group IV (INT-d, INT-e, LZ-a); and Group V (LZ-b, PreM, PBL-a, PBL-b). EZB, DLBCL with EZH2 mutations and BCL2 translocations; MCD, DLBCL with co-occurrence of MYD88L265P and CD79B mutations; BN2, DLBCL with BCL6 fusions and NOTCH2 mutations; N1, DLBCL with NOTCH1 mutations.
Figure 8.
Figure 8.
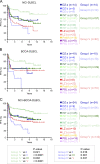
Prognostic value of the sc-COO classification in DLBCL. (A–C) Kaplan-Meier plots for PFS analysis in NCI (n = 190; A), BCCA (n = 166; B), and merged NCI+BCCA (n = 356; C) DLBCL cases classified based on the sc-COO classification. P values were obtained by applying the Mantel-Cox test. See also Fig. S5.
Figure 9.
Figure 9.
Prognostic value of the sc-COO classification in the GCB- and ABC-DLBCL subtypes. (A and B) Kaplan-Meier plots for PFS analysis in GCB-DLBCL (n = 170; A) and ABC-DLBCL (n = 135; B) cases as classified by the sc-COO classifier. P values were obtained by applying the Mantel-Cox test. See also Fig. S5.

References

    1. Aiba Y., Yamazaki T., Okada T., Gotoh K., Sanjo H., Ogata M., and Kurosaki T.. 2006. BANK negatively regulates Akt activation and subsequent B cell responses. Immunity. 24:259–268. 10.1016/j.immuni.2006.01.002 - DOI - PubMed
    1. Alizadeh A.A., Eisen M.B., Davis R.E., Ma C., Lossos I.S., Rosenwald A., Boldrick J.C., Sabet H., Tran T., Yu X., et al. . 2000. Distinct types of diffuse large B-cell lymphoma identified by gene expression profiling. Nature. 403:503–511. 10.1038/35000501 - DOI - PubMed
    1. Allen C.D., Ansel K.M., Low C., Lesley R., Tamamura H., Fujii N., and Cyster J.G.. 2004. Germinal center dark and light zone organization is mediated by CXCR4 and CXCR5. Nat. Immunol. 5:943–952. 10.1038/ni1100 - DOI - PubMed
    1. Allen C.D., Okada T., Tang H.L., and Cyster J.G.. 2007. Imaging of germinal center selection events during affinity maturation. Science. 315:528–531. 10.1126/science.1136736 - DOI - PubMed
    1. Angelin-Duclos C., Cattoretti G., Lin K.I., and Calame K.. 2000. Commitment of B lymphocytes to a plasma cell fate is associated with Blimp-1 expression in vivo. J. Immunol. 165:5462–5471. 10.4049/jimmunol.165.10.5462 - DOI - PubMed

Publication types