. 2020 Aug 6;182(3):655-671.e22.
doi: 10.1016/j.cell.2020.06.001. Epub 2020 Jun 29.

Molecular Pathways of Colon Inflammation Induced by Cancer Immunotherapy

Affiliations

Molecular Pathways of Colon Inflammation Induced by Cancer Immunotherapy

Adrienne M Luoma et al. Cell. .

Abstract

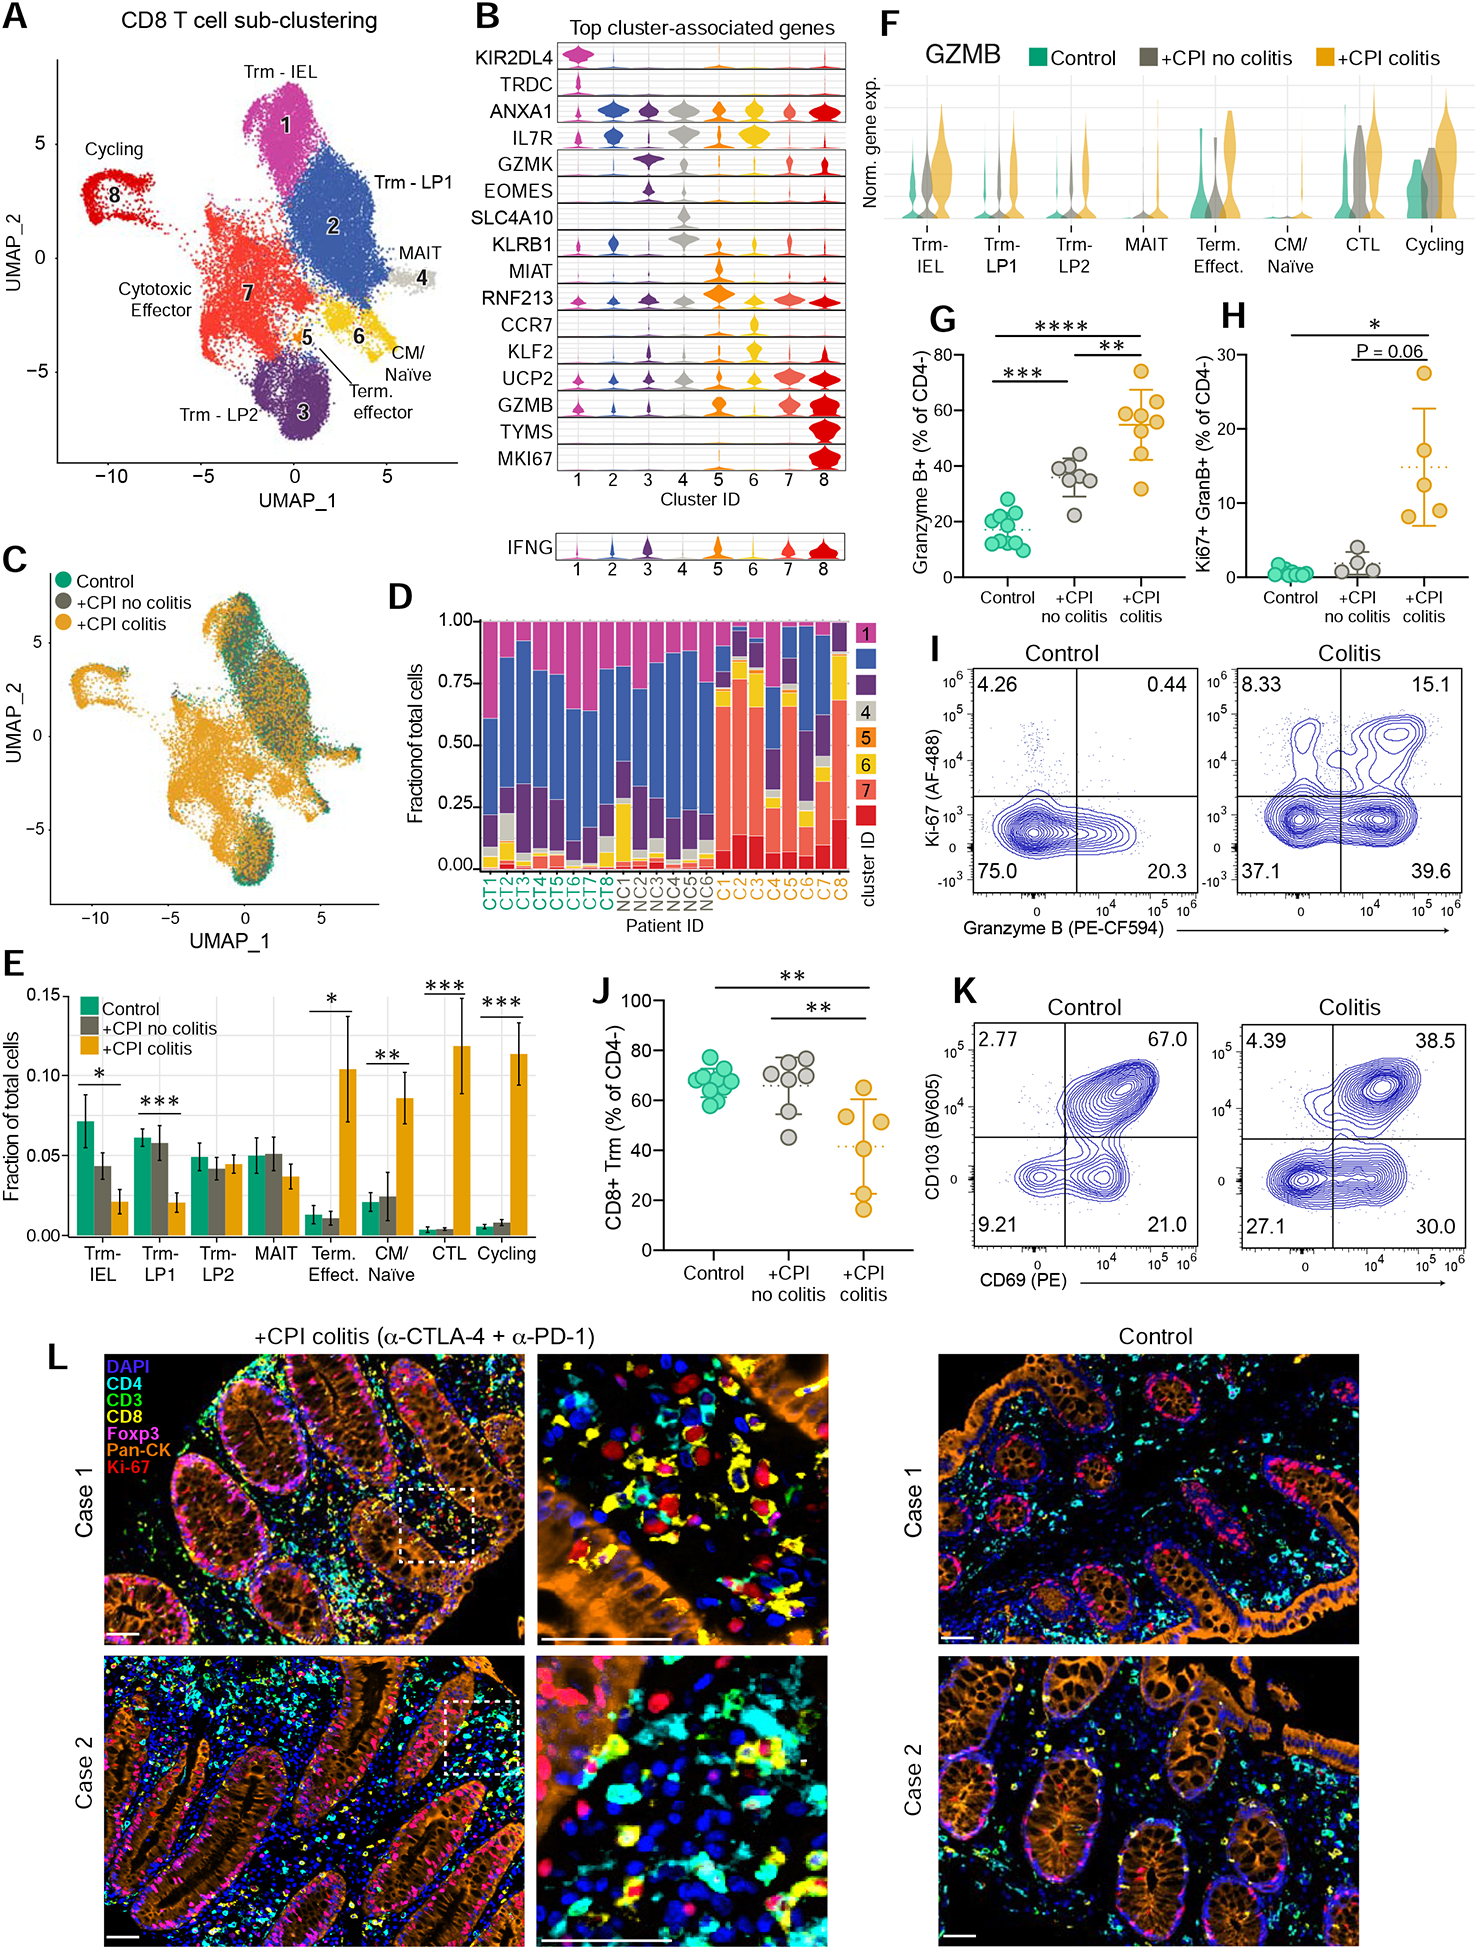
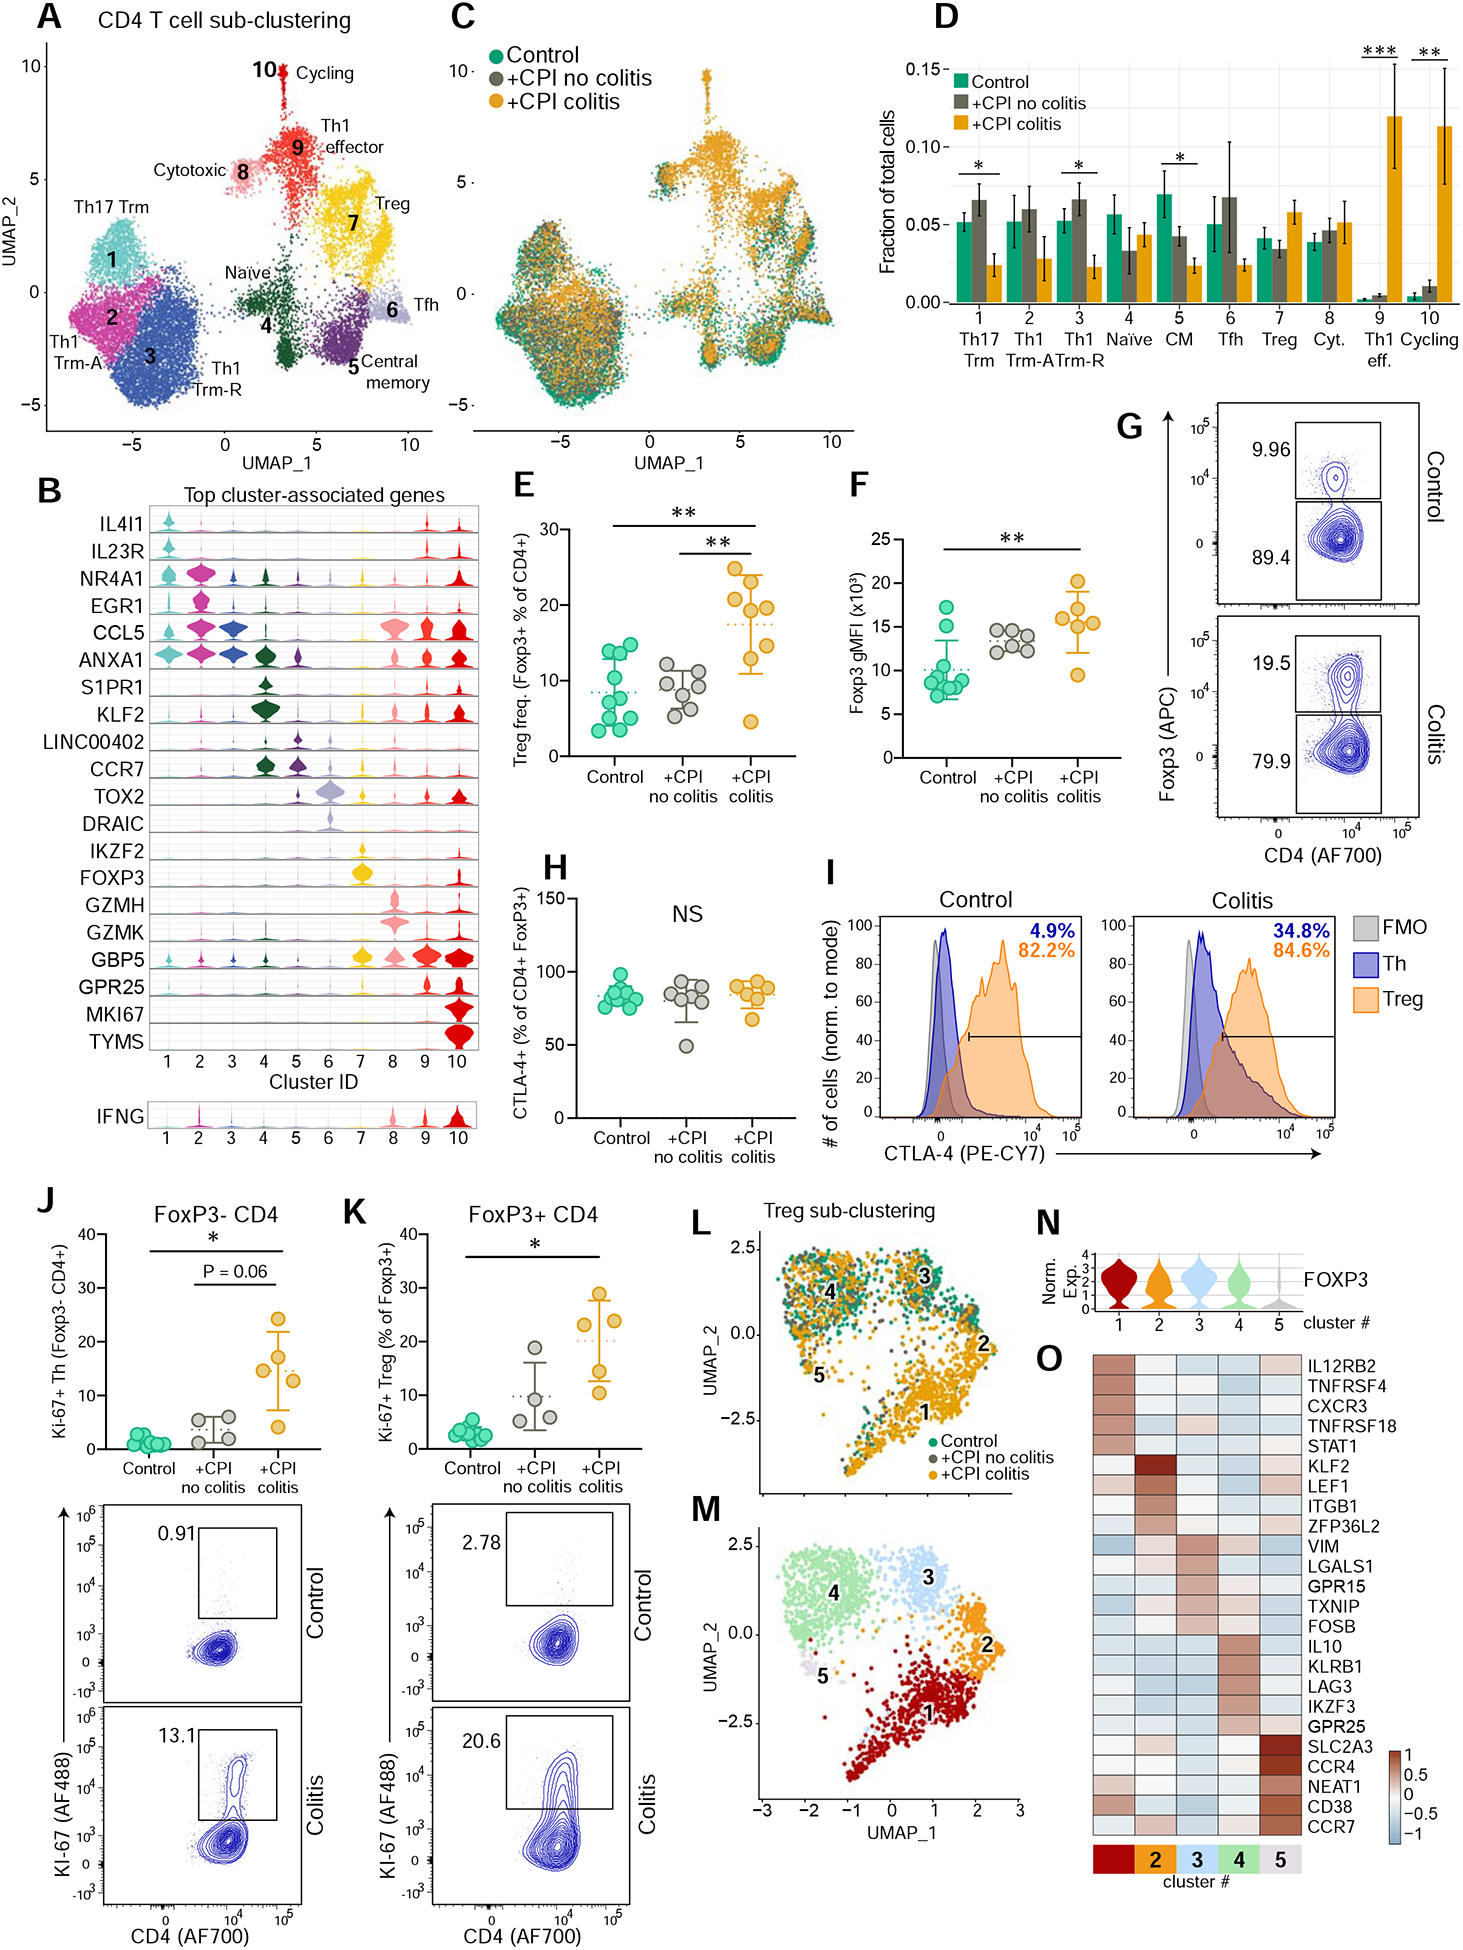
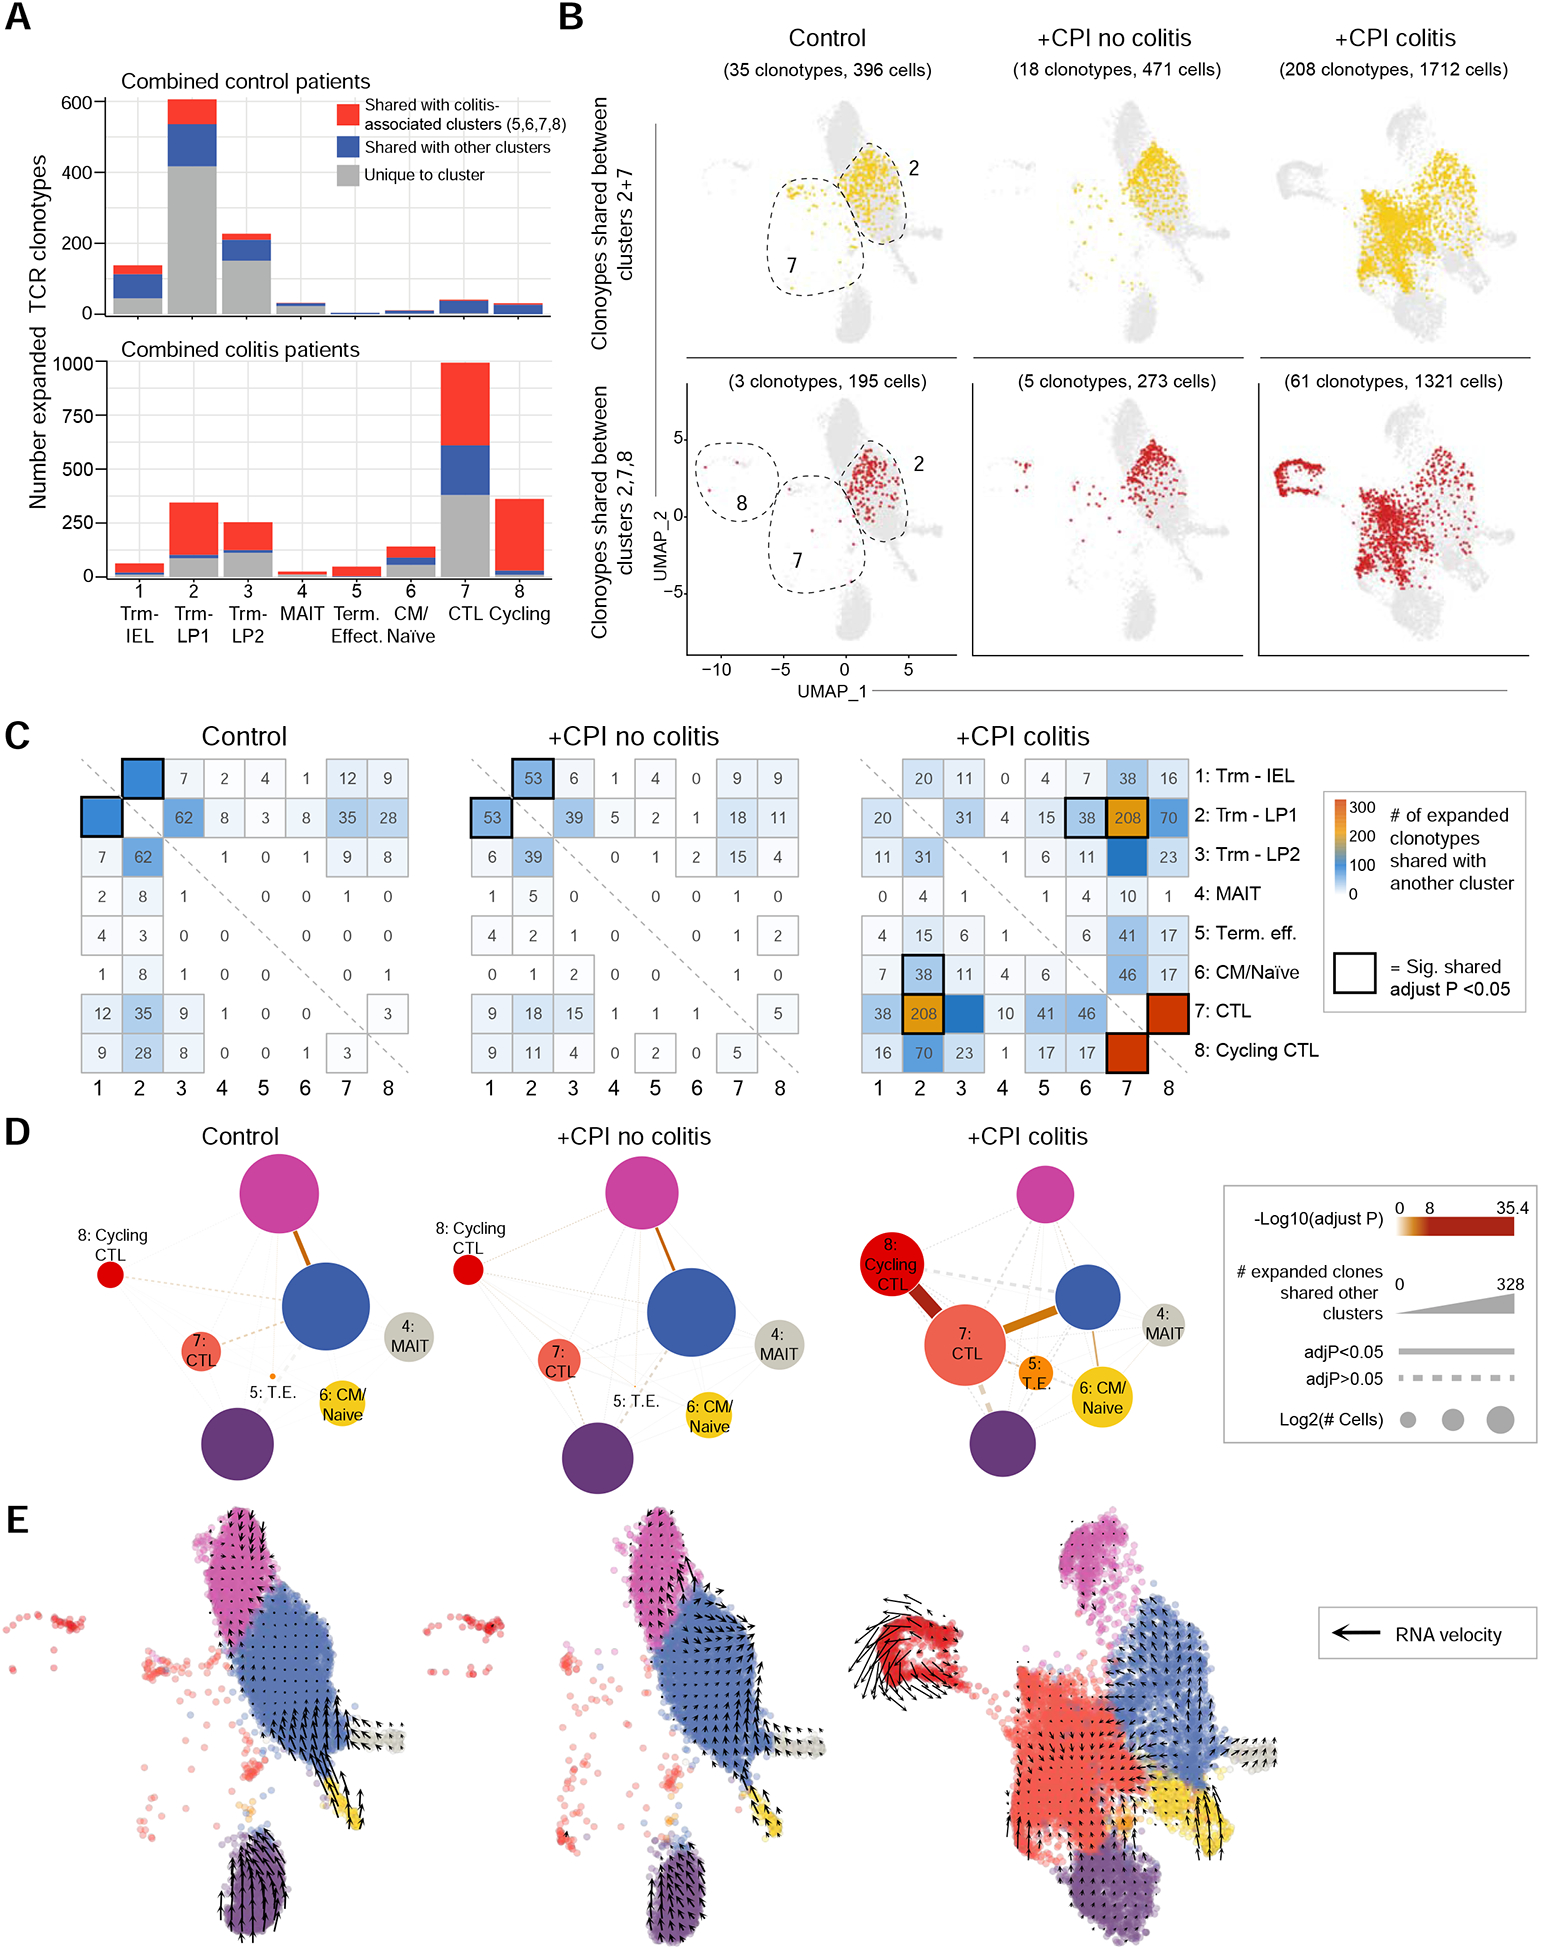
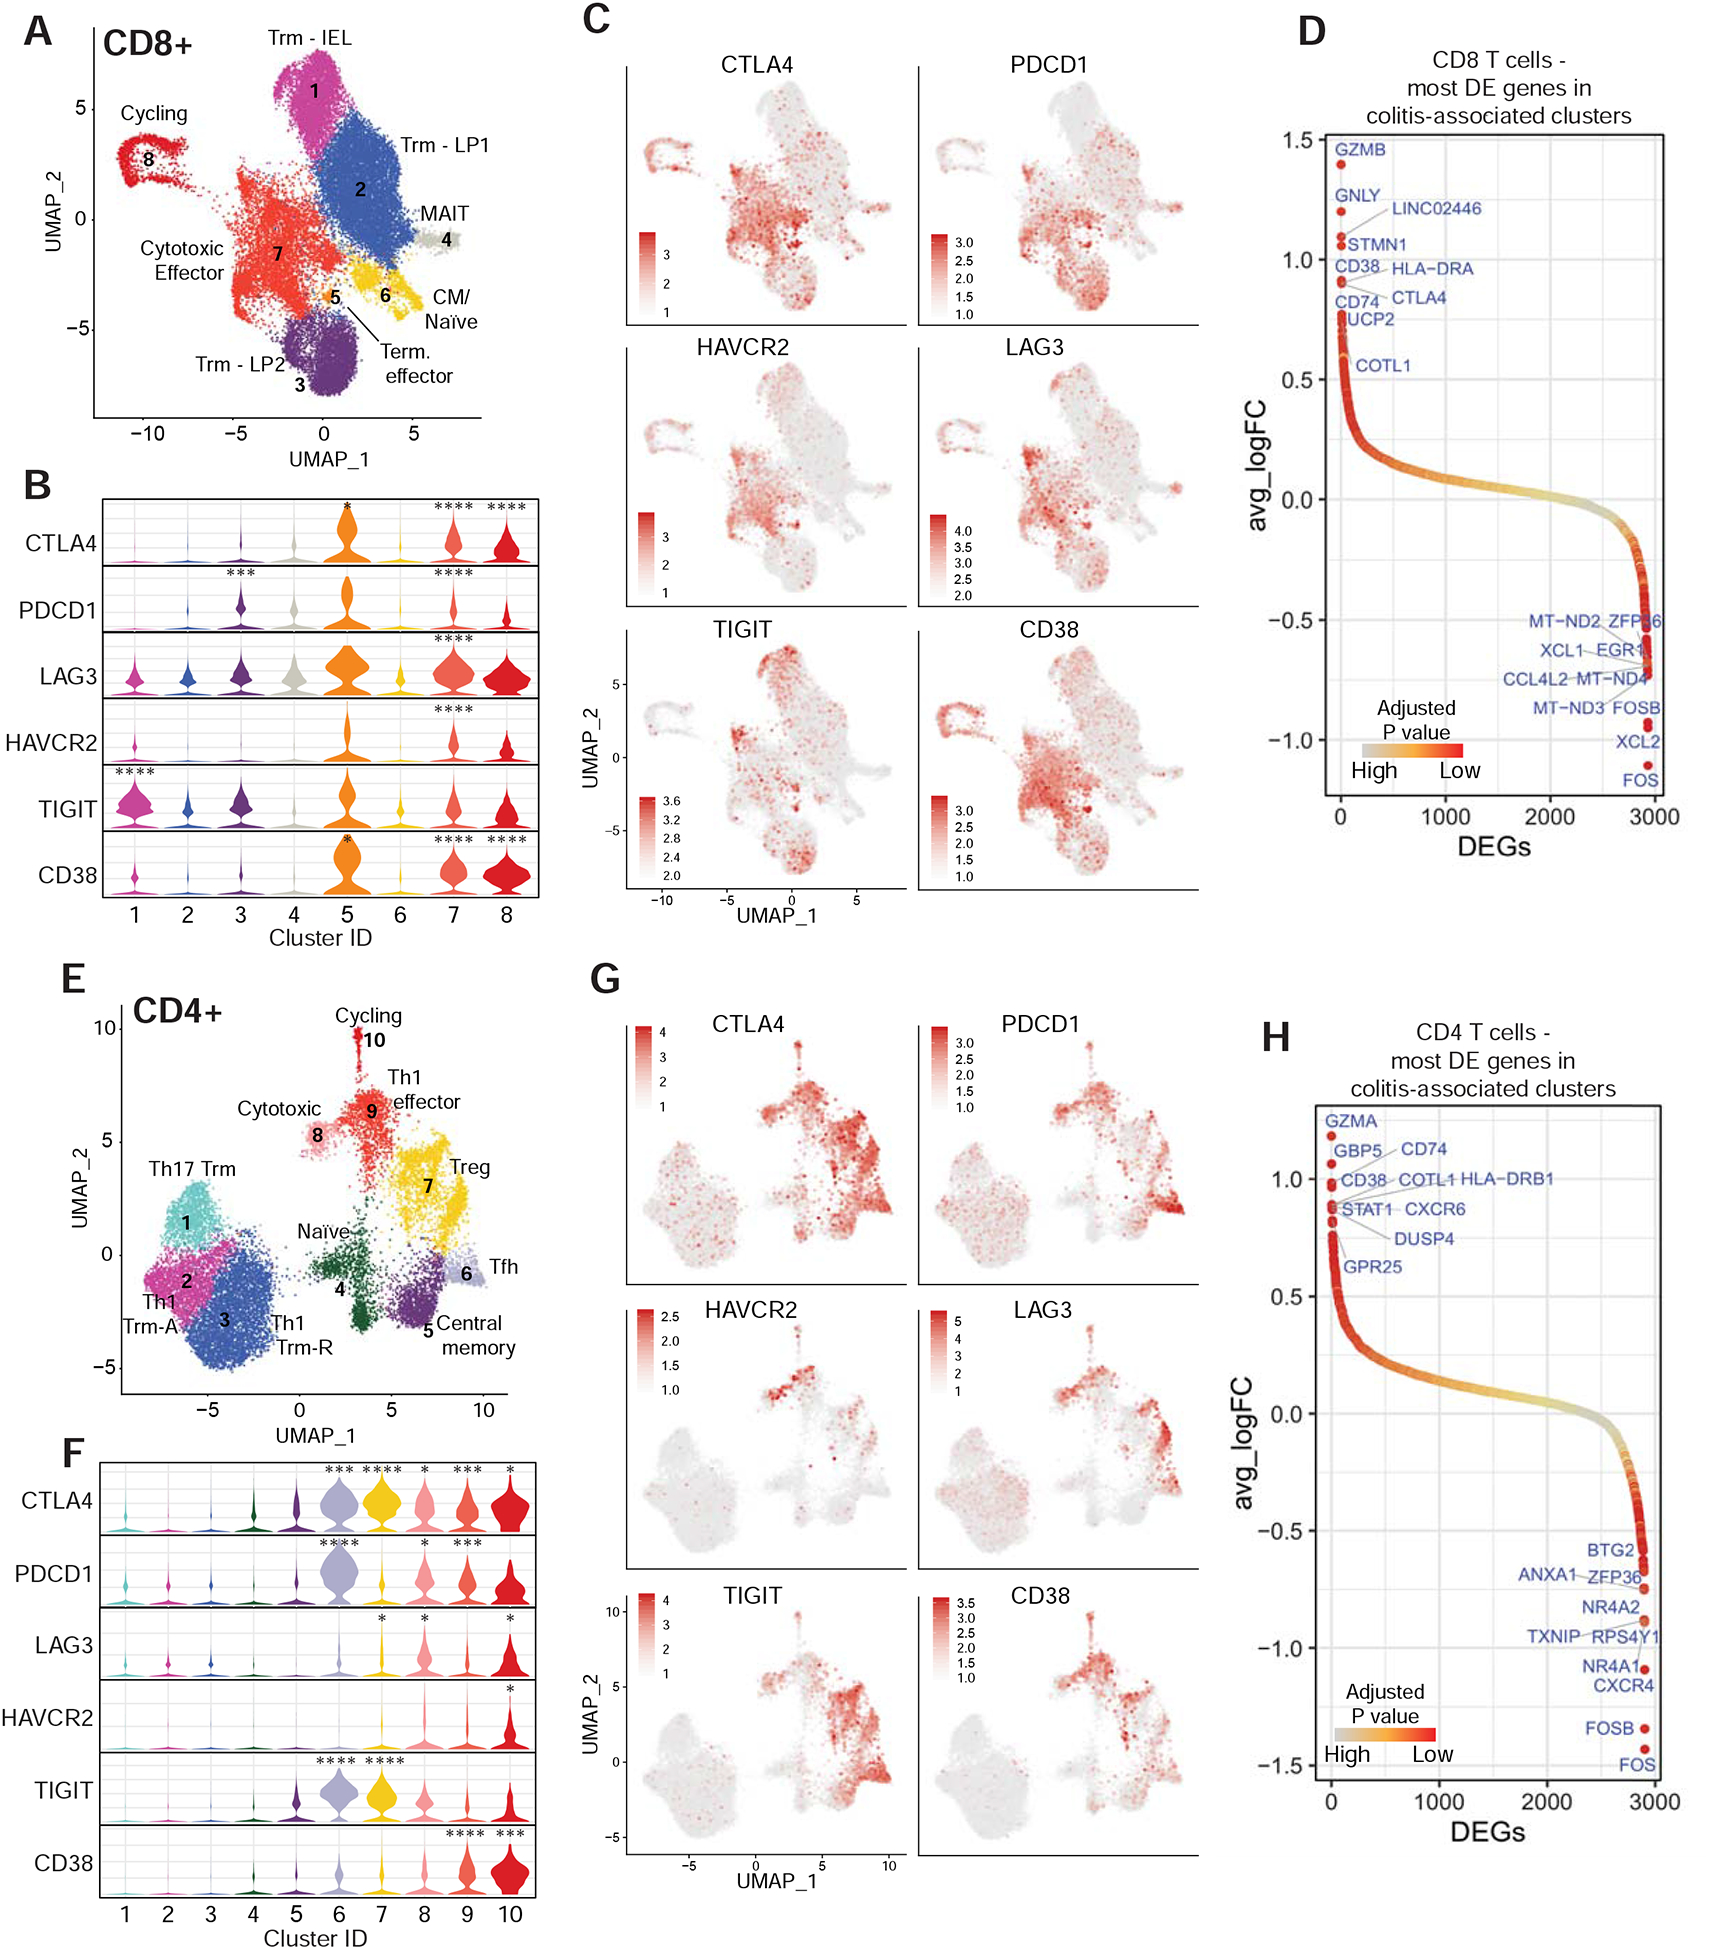
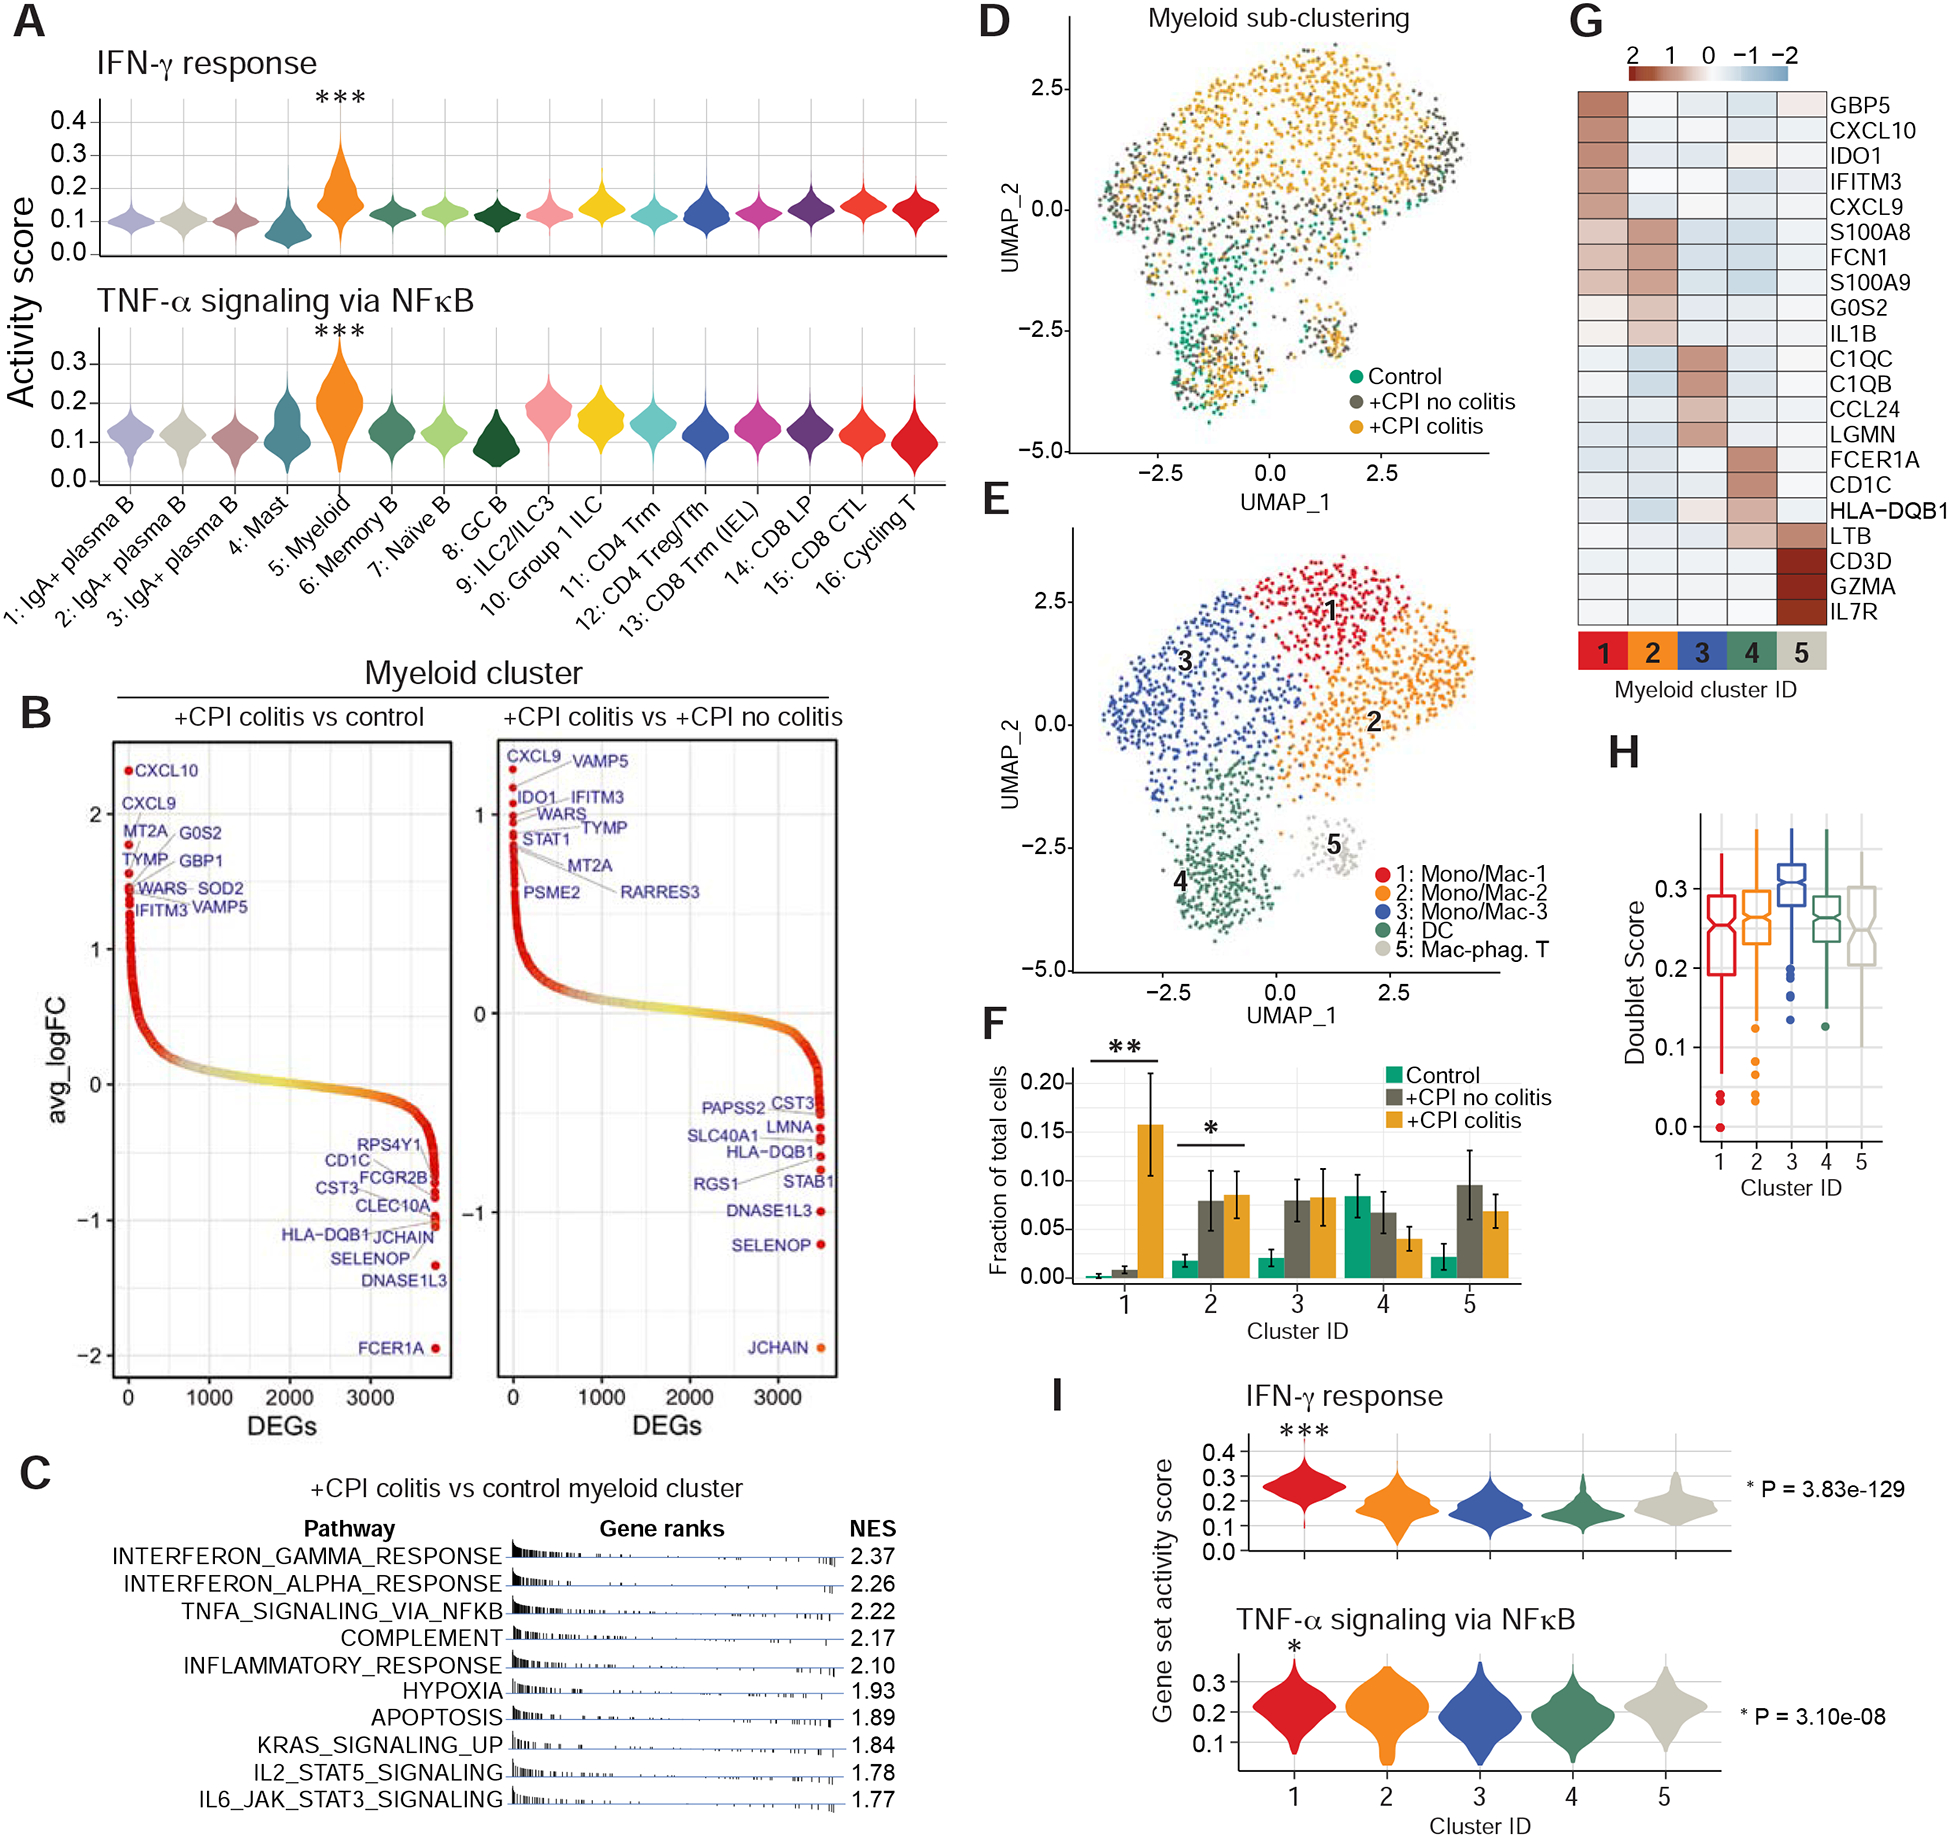
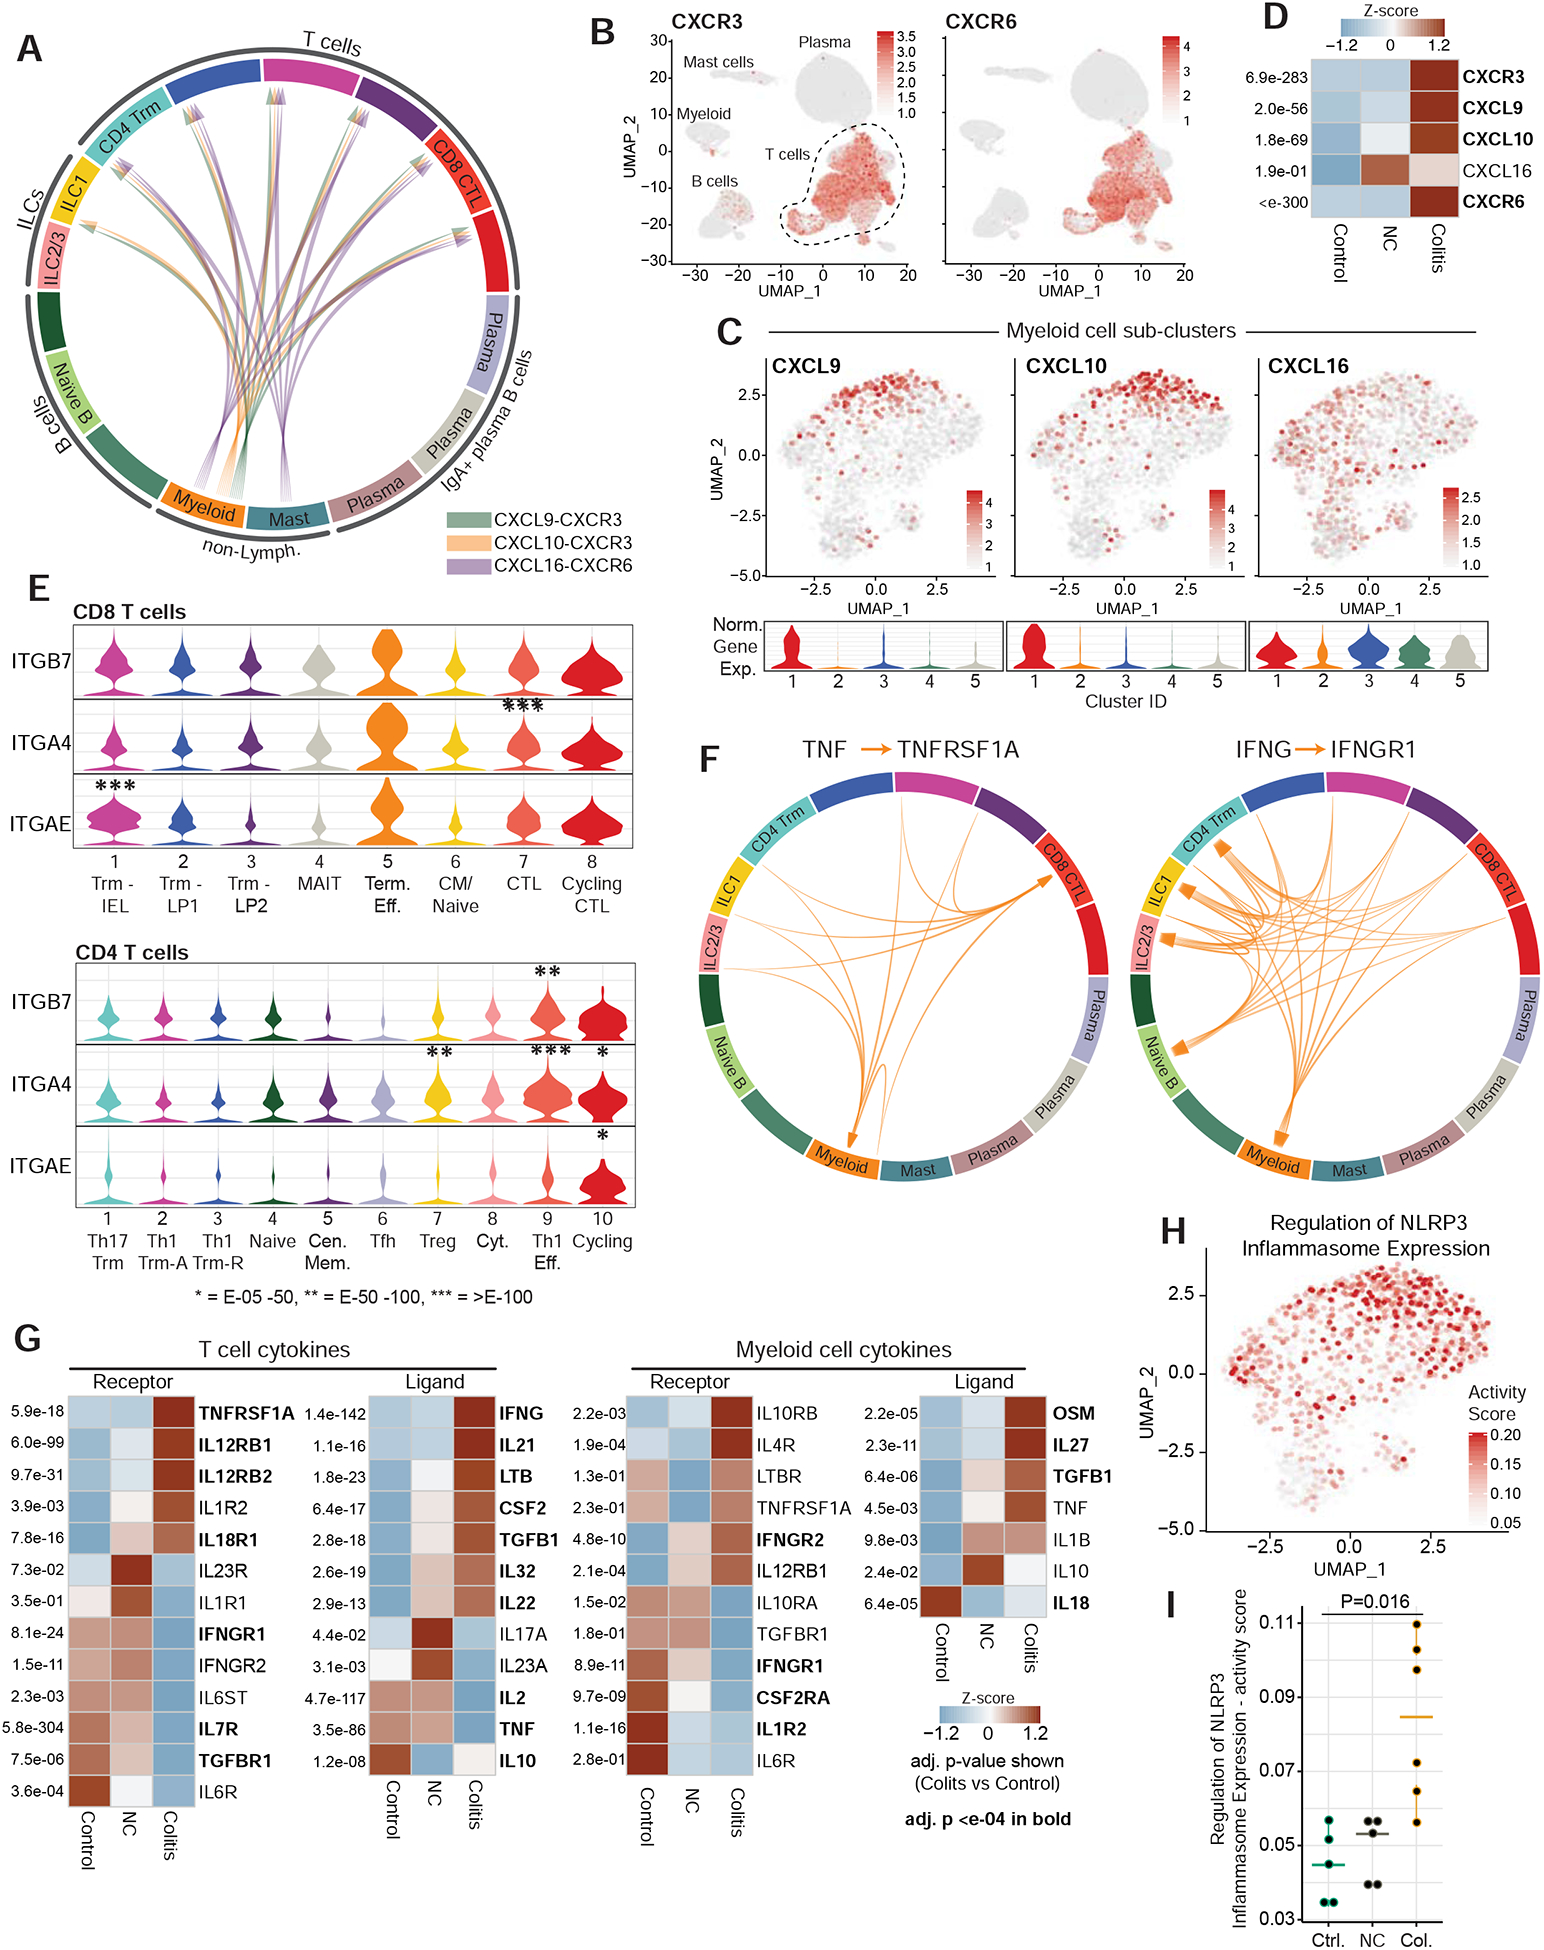
Checkpoint blockade with antibodies specific for the PD-1 and CTLA-4 inhibitory receptors can induce durable responses in a wide range of human cancers. However, the immunological mechanisms responsible for severe inflammatory side effects remain poorly understood. Here we report a comprehensive single-cell analysis of immune cell populations in colitis, a common and severe side effect of checkpoint blockade. We observed a striking accumulation of CD8 T cells with highly cytotoxic and proliferative states and no evidence of regulatory T cell depletion. T cell receptor (TCR) sequence analysis demonstrated that a substantial fraction of colitis-associated CD8 T cells originated from tissue-resident populations, explaining the frequently early onset of colitis symptoms following treatment initiation. Our analysis also identified cytokines, chemokines, and surface receptors that could serve as therapeutic targets for colitis and potentially other inflammatory side effects of checkpoint blockade.

Keywords: CTLA-4; IFNγ; PD-1; TNFα; Trm; cancer; checkpoint blockade; cytotoxic T cells; immune-related adverse events; inflammatory cytokines; irAEs; tissue-resident memory T cells.


Conflict of interest statement

Declaration of Interests K.W.W. serves on the scientific advisory board of TCR2 Therapeutics, T-Scan Therapeutics, and Nextechinvest and receives sponsored research funding from Novartis. He is a scientific co-founder of Immunitas Therapeutics. M.D. receives research funding from Novartis and is on the Scientific Advisory Board for Neoleukin Therapeutics. S.K.D. receives research funding from Novartis, Bristol-Myers Squibb, and Eli Lilly. F.S.H. receives research funding from Bristol-Myers Squibb and Novartis; he also consults for Merck, EMD Serono, Novartis, Takeda, Genentech/Roche, Compass Therapeutics, Apricity, Aduro, Sanofi, Pionyr, 7 Hills Pharma, Verastem, Torque, Rheos Kairos, Psioxus Therapeutics, Amgen, and Pieris Pharmaceutical. O.R. receives research support from Merck and is a speaker for activities supported by educational grants from BMS and Merck. He is a consultant for Merck, Celgene, Five Prime, GSK, GFK, Bayer, Roche/Genentech, Puretech, Imvax, and Sobi. In addition, he has patent “Methods of using pembrolizumab and trebananib” pending. J.A.N. has a provisional patent application for spatial quantification of immune cell infiltration in the tumor microenvironment. R.J.S. has received research funding from Merck and Amgen.

Figures

Figure 1.
Figure 1.. Global analysis of immune cell populations in CPI-colitis
A) Workflow showing biopsy collection sites and processing of single-cell suspensions for scRNA-seq and flow cytometry. Biopsies were obtained from the following colon segments: R=rectum, S=sigmoidal, D=descending. B) Summary of patient cohorts for scRNA-seq analysis. See Tables S1–5 for detailed information. C) Identification of colon CD45+ immune cell clusters across all samples (n=5–6 subjects per cohort). D) Violin plots showing expression of canonical marker genes across clusters, y-axis represents the normalized gene expression value. See Table S6 all marker genes. E) Distribution of CD45+ immune cells across clusters colored based on patient groups. F) Cell cluster frequency shown as a fraction of total cells for each patient. G) Quantification of immune cell distribution across clusters and comparison of patient groups. For each cluster, the average fraction of cells from each patient group is shown, after normalization for total input cell numbers per patient (see Methods). Average and S.E.M. shown for each patient group. Statistical analysis compares control and +CPI colitis patient groups. *p<0.05, **p<0.01, two-sided Wilcoxon test. H) Flow cytometry analysis of CD3+ T cells in colon biopsies (% of live CD45+ cells) in all patients (n=7–10 subjects per group, see Table S5 for details on analyzed cases). *p<0.05, ***p<0.001, one-way ANOVA test. I) Comparison of T cell frequencies as determined by flow cytometry (% of live CD45+ cells) versus scRNA-seq (% of live CD45+ MNC cells) and fit with a linear regression model. See also Figure S1 and Tables S1–4.
Figure 2.
Figure 2.. Colitis-related changes in CD8 T cell cytotoxicity and proliferation programs
A) Sub-clustering of CD8 T cells selected from CD3+ dataset for all subjects (n = 6–8 patients per group) (see STAR Methods). B) Violin plots displaying marker genes of CD8 T cell clusters. For each cluster, the gene with the highest-scoring cell-type specificity score (STAR Methods) and a highly expressed well-defined subset marker are shown. Bottom, IFNG expression shown across clusters. Y-axis represents the normalized gene expression value. See Table S6 for all marker genes. C) Distribution of CD8 T cells across clusters among patient groups. D) Distribution of CD8 T cells across the eight clusters for each patient. E) Quantification of cell cluster frequency representation among patient groups. Average and SEM shown for each patient group. *p<0.05, **p<0.01, ***p<0.001, two-sided Wilcoxon test comparing control and +CPI colitis groups. F) Expression of GZMB across clusters in the three patient groups. G) Quantification of granzyme B+ CD8 T cells by flow cytometry (percentage of CD4 αβTCR+ non-MAIT (Vα7.2+ CD161+) cells, pre-gated on live CD45+ CD3+ cells) for all patients (n=7–10 subjects per group). **p<0 .01, ***p<0.001, ****p<0.0001, one-way ANOVA test. H) Quantification of granzyme B+ Ki-67+ CD8 T cells by flow cytometry gated as in 2I. Ki-67 antibody staining was not performed for initial patients (n=4–10 subjects per group). *p<0.05, one-way Brown-Forsyth and Welch ANOVA test; error bars: SD. I) Representative flow cytometry plots for G and H. J-K) Quantification and representative flow plots of CD103+ CD69+ CD8 Trm cells gated as in 2K (n=6–10 subjects per group). **p<0.01, one-way ANOVA test; error bars: SD. L) Multiplex immunofluorescence images of formalin-fixed paraffin embedded (FFPE) sections from +CPI colitis (treated with α-CTLA-4 and α-PD-1 mAbs) and control patients in a separate cohort (2 representative cases shown for each). Sections were stained with indicated antibodies and counterstained with DAPI. Dashed box represents 4x enlarged area shown in middle panel. White arrows point to cells positive for Ki-67 and CD8. See also Figure S3.
Figure 3.
Figure 3.. Increase in CD4+ effector cells and Tregs in CPI-colitis
A) CD4 T cells were selected from CD3+ dataset for all subjects (n=6–8 patients per group) and sub-clustered. B) Violin plots displaying marker genes for CD4 T cell clusters (see Figure 2B for details). See Table S6 for all marker genes. C) Distribution of CD4 T cells across clusters among patient groups. D) Quantification of cell cluster frequency representation among patient groups. Average and S.E.M. shown for each patient group. * p<0.05, **p<0.01, ***p<0.001, two-sided Wilcoxon test comparing control and +CPI colitis groups. E) Quantification of Treg cells (% of FoxpP3+CD4+ cells, pre-gated on live CD45+ CD3+ γδTCR cells) for all patients (n=7–10 subjects per group). **p<0.01, one-way ANOVA test. F) Geometric mean fluorescence intensity (gMFI) of Foxp3 staining, gated on CD4+ Foxp3+ cells (n=6–10 subjects per group). **p<0.01, one-way ANOVA test. G) Representative flow plots for E and F. H) Quantification of CTLA-4 expression by Treg cells (% of FoxP3+ CD4+ T cells). I) Representative plots for H, showing CTLA-4 levels of FoxP3+ Tregs and Foxp3 Th CD4+ cells, compared with FMO gating control (n=6–10 subjects per group). **p<0.01, one-way ANOVA test. J,K) Quantification and representative flow cytometry plots of Ki-67+ Foxp3 CD4 T cells (J) and Foxp3+ CD4 T cells (K) (n=4–10 subjects per group). * p<0.05, one-way Brown-Forsyth and Welch ANOVA test. L-M) Sub-clustering of Treg cells from cluster 7 from 3A. colored according to patient group (L) and sub-cluster annotation (M). N) Normalized FOXP3 expression across Treg sub-clusters. O) Heatmap showing differentially expressed genes across Treg sub-clusters. From the top 10 cluster-defining genes, five with high relevance to Treg function are shown. See Table S6 for all marker genes. See also Figure S4.
Figure 4.
Figure 4.. Tracking of clonal expansion across CD8 T cell clusters.
A) Sharing of expanded TCR clonotypes across clusters. For each patient and cluster, the number of expanded TCR clonotypes from the CD8+ dataset was calculated and summed up for the indicated patient groups. Expanded clonotypes shared with a colitis-associated cluster (5–8) are colored red, those shared with other clusters (1–4) are colored blue. B) Visualization of TCR clonotypes identified in both Trm and colitis-associated clusters. Top panel shows CD8 T cells with expanded clonotypes present in both clusters 2 and 7; bottom panel shows CD8 T cells with expanded clonotypes present in clusters 2, 7 and 8. Some clonotypes are also shared with other clusters, but only sharing with the indicated clusters is visualized. C) Sharing of expanded TCR clonotypes across all possible combinations of CD8 T cell clusters. Data were aggregated for each of the indicated patient groups. Numbers indicate the number of shared expanded TCR clonotypes for each cluster pair. Bold boxes indicate statistically significant sharing of expanded clonotypes between clusters (adjusted p<0.05, one-sided Fisher’s exact test followed with Benjamini-Hochberg correction). D) Visualization of data from C as a network plot. Nodes represent cell clusters; size of nodes represents the log2 transformed cell numbers from each patient group. The width of connecting lines indicates the number of shared expanded clonotypes between two clusters, color gradient of lines reflects statistical significance of clonotype sharing. E) RNA velocity analysis of gene expression in CD8+ dataset. Arrows denote velocity vectors illustrating potential differentiation paths. See also Figure S5.
Figure 5.
Figure 5.. Analysis of T cell checkpoints and colitis-associated genes.
A) CD8+ T cell cluster representation from 2A as UMAP plot (repeated to aid in analysis of gene expression data). B) Normalized expression of T cell checkpoint genes among CD8+ clusters shown as violin plots. Adj. P value *** = E-100–200, ****
Figure 6.
Figure 6.. Inflammatory gene expression signatures in myeloid cells.
A) Hallmark gene set scores for ‘IFNγ response’ (top) and ‘TNFα signaling via NFkB’ (bottom) computed for all clusters in aggregated CD45+ dataset (all patients combined). *** =p E-100–200, two-sided Wilcoxon test. B) Ranking of significantly differentially expressed genes among myeloid cells in the indicated comparisons of patient groups. Top 10 positively/negatively differentially expressed genes are labelled. See Table S7 for all differentially expressed genes. C) Functional enrichment analysis of hallmark gene sets comparing myeloid cells from +CPI colitis to healthy control patients. NES= normalized enrichment score. D-E) Sub-clustering of myeloid cells from cluster 5 (Figure 1C) colored according to patient group (D) and sub-cluster annotation (E). F) Quantification of myeloid cell distribution frequency and representation among patient groups. Average and S.E.M. shown for each patient group. * p<0.05, *p<0.01, two-sided Wilcoxon test comparing control and +CPI colitis groups. G) Heatmap showing differentially expressed genes across myeloid sub-clusters. Genes of interest from top 10 cluster-defining genes are shown. See Table S6 for all marker genes. H) Cell doublet likelihood was calculated with DoubletFinder showing no significant differences among clusters. I) Hallmark gene set activity scores computed for each myeloid sub-cluster (aggregated cells from all patients). * = E-05–50, *** = E-100–200, two-sided Wilcoxon test.
Figure 7.
Figure 7.. T cell – myeloid cell connectivity and therapeutic targets
A) Analysis of chemokine receptor-ligand pairs across clusters from CD45+ dataset (aggregated dataset from all patients). All shown interactions were statistically significant based on permutation test, and arrows denote directionality from ligand to receptor (see STAR Methods). B) Normalized gene expression for indicated chemokine receptors in CD45+ dataset. C) Normalized expression of indicated chemokine genes in myeloid sub-cluster (feature plot and violin plot for each cluster) D) Heatmap displaying z-score normalized averaged expression of indicated chemokine and chemokine receptor genes among total CD45+ cells, compared among patient groups. Adj. P values are shown. E) Violin plots displaying normalized expression of integrin genes among CD8 (top) and CD4 (bottom) clusters. Adj. P value * = E-05–50, ** = E-50–100, *** = E-100+. F) Analysis of cytokine receptor-ligand pairs across clusters from CD45+ dataset as in A. G) Heatmap showing z-score normalized averaged expression of indicated cytokine and cytokine receptor genes compared among patient groups. Expression shown for either T cell clusters (11–16) or myeloid cluster (5) from CD45+ dataset, as indicated. Adj. P values are shown. H-I) Single-cell gene-set activity score for the positive regulation of NLRP3 inflammasome expression shown for myeloid sub-cluster (combined cells from all patients, H) and quantified for patient groups with two-sided Wilcoxon test, I. See also Figure S7.

References

    1. Abu-Sbeih H, Ali FS, Alsaadi D, Jennings J, Luo W, Gong Z, Richards DM, Charabaty A, and Wang Y (2018). Outcomes of vedolizumab therapy in patients with immune checkpoint inhibitor-induced colitis: a multi-center study. J Immunother Cancer 6, 142. - PMC - PubMed
    1. Aibar S, Gonzalez-Blas CB, Moerman T, Huynh-Thu VA, Imrichova H, Hulselmans G, Rambow F, Marine JC, Geurts P, Aerts J, et al. (2017). SCENIC: single-cell regulatory network inference and clustering. Nat Methods 14, 1083–1086. - PMC - PubMed
    1. Aran D, Looney AP, Liu L, Wu E, Fong V, Hsu A, Chak S, Naikawadi RP, Wolters PJ, Abate AR, et al. (2019). Reference-based analysis of lung single-cell sequencing reveals a transitional profibrotic macrophage. Nat Immunol 20, 163–172. - PMC - PubMed
    1. Arbour KC, Mezquita L, Long N, Rizvi H, Auclin E, Ni A, Martinez-Bernal G, Ferrara R, Lai WV, Hendriks LEL, et al. (2018). Impact of Baseline Steroids on Efficacy of Programmed Cell Death-1 and Programmed Death-Ligand 1 Blockade in Patients With Non-Small-Cell Lung Cancer. J Clin Oncol 36, 2872–2878. - PubMed
    1. Badran YR, Cohen JV, Brastianos PK, Parikh AR, Hong TS, and Dougan M (2019). Concurrent therapy with immune checkpoint inhibitors and TNFalpha blockade in patients with gastrointestinal immune-related adverse events. J Immunother Cancer 7, 226. - PMC - PubMed

Publication types

MeSH terms