. 2020 Oct 7:502:110387.
doi: 10.1016/j.jtbi.2020.110387. Epub 2020 Jun 27.

Switching behaviour in vascular smooth muscle cell-matrix adhesion during oscillatory loading

Affiliations

Switching behaviour in vascular smooth muscle cell-matrix adhesion during oscillatory loading

Linda Irons et al. J Theor Biol. .

Abstract

Integrins regulate mechanotransduction between smooth muscle cells (SMCs) and the extracellular matrix (ECM). SMCs resident in the walls of airways or blood vessels are continuously exposed to dynamic mechanical forces due to breathing or pulsatile blood flow. However, the resulting effects of these forces on integrin dynamics and associated cell-matrix adhesion are not well understood. Here we present experimental results from atomic force microscopy (AFM) experiments, designed to study the integrin response to external oscillatory loading of varying amplitudes applied to live aortic SMCs, together with theoretical results from a mathematical model. In the AFM experiments, a fibronectin-coated probe was used cyclically to indent and retract from the surface of the cell. We observed a transition between states of firm adhesion and of complete detachment as the amplitude of oscillatory loading increased, revealed by qualitative changes in the force timecourses. Interestingly, for some of the SMCs in the experiments, switching behaviour between the two adhesion states is observed during single timecourses at intermediate amplitudes. We obtain two qualitatively similar adhesion states in the mathematical model, where we simulate the cell, integrins and ECM as an evolving system of springs, incorporating local integrin binding dynamics. In the mathematical model, we observe a region of bistability where both the firm adhesion and detachment states can occur depending on the initial adhesion state. The differences are seen to be a result of mechanical cooperativity of integrins and cell deformation. Switching behaviour is a phenomenon associated with bistability in a stochastic system, and bistability in our deterministic mathematical model provides a potential physical explanation for the experimental results. Physiologically, bistability provides a means for transient mechanical stimuli to induce long-term changes in adhesion dynamics-and thereby the cells' ability to transmit force-and we propose further experiments for testing this hypothesis.

Keywords: Bistability; Dynamic loading; Integrins; Mechanotransduction.


Conflict of interest statement

Declaration of Competing Interest The authors declare that they have no known competing financial interests or personal relationships that could have appeared to influence the work reported in this paper.

Figures

Figure 1:
Figure 1:
The cell, bound integrins (collectively) and ECM are represented by a set of springs with spring constants kA, kI(B) and kE, where 0 ≤ B ≤ 1 is an evolving fraction of integrins bound to the cell and the ECM at any time. The springs have deformed lengths LA, LI and LE, respectively, and the vertical integrin extension is L=LILI, where LI is the integrin rest length. Note that the ‘effective spring’ that represents the bound integrin population is nonlinear and has a deformation-dependent stiffness, with its spring constant, kI(B), evolving according to a separate PDE model for the integrin binding dynamics (described below).
Figure 2:
Figure 2:
(a) Illustrative integrin binding (kb(x, L)) and (b) unbinding (ku(x, L)) reaction rates, indicated by colour, as a function of distance. The binding rate (in (a)) is highest when the integrin is at a zero distance from its rest position. The rate of unbinding (in (b)) increases as the distance from rest increases.
Figure 3:
Figure 3:
Experimental data and model results for either rupture or adhesion. (a–c) Experimental rupture. Raw AFM data for a cell with no prebinding, measured whilst the AFM probe was subject to vertical oscillations (with a triangular waveform) of amplitude 1400nm. The force is shown over (a) 10 minutes, (b) the first 3 approach-retract cycles, corresponding to the shaded region in (a), and (c) a limited range of force corresponding to the darker shaded region in (b), allowing us to see the rupture behaviour more clearly. The blue labels (1) and (2) denote approach and retraction, respectively, and (3) shows a contact point. (d–f) Model rupture. Timecourses for (d) the adhesion force (e) the corresponding bound integrin fraction and (f) heights of each of the three layers (Cell, ECM and LT) in the presence of high amplitude (A = 80) approach-retract cycles. In this case a zero initial condition of bound integrins was used, but both saturated and zero initial conditions produce similar results as any preexisting bound integrins rupture during the first retraction. (g, h) Experimental adhesion. Raw AFM data for a cell with no prebinding, with vertical oscillations of amplitude 400nm showing force over (g) 10 minutes and (h) the first 3 approach-retract cycles. (i, j) Model adhesion. Timecourses for (i) adhesion force (j) bound integrin fraction and (k) heights of each of the three layers (Cell, ECM and LT) in the presence of low amplitude (A = 40) approach-retract cycles. The black and grey lines show timecourses for saturated and zero initial conditions respectively, mimicking prebind and non-prebind experimental conditions. All parameter values are in S.4 in the Supplementary Material, where we also discuss differences in model and experimental oscillation amplitudes.
Figure 4:
Figure 4:
(a) Experimental force curves, normalised to take values between 0 and 1, and averaged over all approach-retract cycles and cells. These show the typical behaviours of the adhesion force during approach (0 ≤ t < 5s) and retraction (5 ≤ t < 10s) for amplitudes, A, with the prebind (red) and non-prebind (blue) protocols. Solid lines denote mean values, whereas the shaded regions are within one standard deviation of the mean. Sample sizes, n, for each amplitude are in Table 1. (b) Model force curves, normalised to take values between 0 and 1, once an oscillatory steady state had been reached. These show the periodic behaviours of the adhesion force during approach (0 ≤ t < 5s) and retraction (5 ≤ t < 10s) for amplitudes, A, with the prebind (red) and nonprebind (blue) protocols. All parameter values are in S.4 in the Supplementary Material, where we also discuss differences in model and experimental oscillation amplitudes.
Figure 5:
Figure 5:
Model timecourses for (a) bound integrin fraction and (b) cell height, in the presence of intermediate amplitude (A = 50) approach-retract cycles with saturated (black line) and zero (grey line) initial conditions. All parameter values are in S.4 in the Supplementary Material.
Figure 6:
Figure 6:
(a) Raw force timecourse that undergoes a sudden change at t = 160s. The cell was subject to oscillations of amplitude 1000nm under the prebind protocol. At earlier times, the force curves are characteristic of adhesion curves (Fig. 3g–i). At later times, there is more rupture, characteristic of full detachment curves (Fig. 3a–d). Normalised force curves from the raw timecourse are shown (b) overlayed for each 10 second cycle and (c) presented as a surface plot. We observe two distinct types of curves, where a reduced width corresponds to a reduced time with the bead and cell in contact (similar to the differences in prebind and non-prebind curves at A = 1200nm in Fig. 4a). A switch between the two curve types occurs suddenly after the 16th cycle, which corresponds to t = 160s.
Figure 7:
Figure 7:
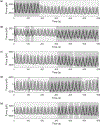
Experimental force timecourses from single cells that show switches in behaviour, subject to amplitudes ranging from 1000nm to 1250nm including prebind and non-prebind cells, as detailed. We used k-means cluster analysis (details below) to classify the 60 individual cycles within each timecourse into two clusters, where darker shaded regions indicate classification into an adhesion cluster. Switching in both directions (adhesion to rupture and rupture to adhesion) is seen, as well as a temporary switch. (a) 1000nm, prebind. At earlier times, the force curves are characteristic of adhesion curves (Fig. 3g–i). At later times (t > 180s), there is increased rupture (Fig. 3a–d) and a drop in magnitude. (b) 1150nm, prebind. After t = 300s, there is a sustained switch to increased adhesion. (c) 1100nm, no prebinding. Initially, rupture events are seen but there is a transition to stronger adhesion shortly after t = 300 seconds. (d) 1150nm, prebinding. There is a temporary transition to stronger adhesion between 250 and 480 seconds. (e) 1250nm, no prebinding. Initially, rupture events are seen but there is a transition to stronger adhesion, which becomes more noticeable over time.
Figure 8:
Figure 8:
(a) Each normalised force curve in Fig. 6 has been fitted to a Gaussian function. (b) The three parameters uniquely defining the Gaussian (Eq. (16)) are plotted in 3D space. A k-means algorithm with k = 2 gives two distinct clusters, with centroids for the adhesion and rupture clusters shown by blue and orange diamonds respectively. (c) Skewness gives a one-dimensional measure of asymmetry (see S.3 in the Supplementary Material), and in this case also clearly separates the two distinct curve types. There is a sudden increase in skewness at the transition from adhesion to rupture curves (after Cycle 16, see Fig. 6), reflecting the more noticeable asymmetry of rupture.

Similar articles

Cited by

References

    1. Arthur D, Vassilvitskii S, 2007. k-means++: The advantages of careful seeding, in: Proceedings of the Eighteenth Annual ACM-SIAM Symposium on Discrete Algorithms, Society for Industrial and Applied Mathematics. pp. 1027–1035.
    1. Baumgartner W, Hinterdorfer P, Ness W, Raab A, Vestweber D, Schindler H, Drenckhahn D, 2000. Cadherin interaction probed by atomic force microscopy. Proceedings of the National Academy of Sciences 97, 4005–4010. - PMC - PubMed
    1. Binnig G, Quate CF, Gerber C, 1986. Atomic force microscope. Physical Review Letters 56, 930. - PubMed
    1. Chan CE, Odde DJ, 2008. Traction dynamics of filopodia on compliant substrates. Science 322, 1687–1691. - PubMed
    1. Dumbauld DW, Shin H, Gallant ND, Michael KE, Radhakrishna H, García AJ, 2010. Contractility modulates cell adhesion strengthening through focal adhesion kinase and assembly of vinculin-containing focal adhesions. Journal of Cellular Physiology 223, 746–756. - PMC - PubMed

Publication types

LinkOut - more resources