. 2020 Aug;584(7821):425-429.
doi: 10.1038/s41586-020-2488-1. Epub 2020 Jun 30.

Suppression of a SARS-CoV-2 outbreak in the Italian municipality of Vo'

Collaborators, Affiliations

Suppression of a SARS-CoV-2 outbreak in the Italian municipality of Vo'

Enrico Lavezzo et al. Nature. 2020 Aug.

Erratum in

  • Author Correction: Suppression of a SARS-CoV-2 outbreak in the Italian municipality of Vo'.
    Lavezzo E, Franchin E, Ciavarella C, Cuomo-Dannenburg G, Barzon L, Del Vecchio C, Rossi L, Manganelli R, Loregian A, Navarin N, Abate D, Sciro M, Merigliano S, De Canale E, Vanuzzo MC, Besutti V, Saluzzo F, Onelia F, Pacenti M, Parisi SG, Carretta G, Donato D, Flor L, Cocchio S, Masi G, Sperduti A, Cattarino L, Salvador R, Nicoletti M, Caldart F, Castelli G, Nieddu E, Labella B, Fava L, Drigo M, Gaythorpe KAM; Imperial College COVID-19 Response Team; Brazzale AR, Toppo S, Trevisan M, Baldo V, Donnelly CA, Ferguson NM, Dorigatti I, Crisanti A. Lavezzo E, et al. Nature. 2021 Feb;590(7844):E11. doi: 10.1038/s41586-020-2956-7. Nature. 2021. PMID: 33452443 Free PMC article. No abstract available.

Abstract

On 21 February 2020, a resident of the municipality of Vo', a small town near Padua (Italy), died of pneumonia due to severe acute respiratory syndrome coronavirus 2 (SARS-CoV-2) infection1. This was the first coronavirus disease 19 (COVID-19)-related death detected in Italy since the detection of SARS-CoV-2 in the Chinese city of Wuhan, Hubei province2. In response, the regional authorities imposed the lockdown of the whole municipality for 14 days3. Here we collected information on the demography, clinical presentation, hospitalization, contact network and the presence of SARS-CoV-2 infection in nasopharyngeal swabs for 85.9% and 71.5% of the population of Vo' at two consecutive time points. From the first survey, which was conducted around the time the town lockdown started, we found a prevalence of infection of 2.6% (95% confidence interval (CI): 2.1-3.3%). From the second survey, which was conducted at the end of the lockdown, we found a prevalence of 1.2% (95% CI: 0.8-1.8%). Notably, 42.5% (95% CI: 31.5-54.6%) of the confirmed SARS-CoV-2 infections detected across the two surveys were asymptomatic (that is, did not have symptoms at the time of swab testing and did not develop symptoms afterwards). The mean serial interval was 7.2 days (95% CI: 5.9-9.6). We found no statistically significant difference in the viral load of symptomatic versus asymptomatic infections (P = 0.62 and 0.74 for E and RdRp genes, respectively, exact Wilcoxon-Mann-Whitney test). This study sheds light on the frequency of asymptomatic SARS-CoV-2 infection, their infectivity (as measured by the viral load) and provides insights into its transmission dynamics and the efficacy of the implemented control measures.


Conflict of interest statement

Competing interests

The authors declare no competing interests.

Figures

Extended Data Fig. 1
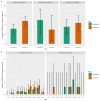
Extended Data Fig. 1. Summary statistics, frequency of symptoms and prevalence by age.
a, Age distributions (in years) of the participants enrolled in the first and second surveys. b, Frequency of individual symptoms (fever x = 29, cough x = 19, sore throat x = 9, headache x = 9, diarrhoea x = 3, malaise x = 2 and conjunctivitis x = 1) among participants with confirmed SARS-CoV-2 infection across the whole study period (that is, the first and second surveys aggregated; n = 80 participants). The error bars represent the 95% exact binomial CI. c, Age distribution of the population recruited and not recruited in the first survey. d, Age distribution of the population recruited and not recruited in the second survey. e, SARS-CoV-2 prevalence by age at the first and second surveys combined (positive x = 0, 5, 6, 9, 7, 23, 21, 25 and 6, tested n = 374, 460, 431, 527, 805, 935, 733, 580 and 310, respectively, in age groups 0–10, 11–20, 21–30, 31–40, 41–50, 51–60, 61–70, 71–80 and 81+ years) and at the first (positive x = 0, 3, 4, 7, 5, 16, 15, 19 and 4, tested n = 217, 250, 240, 286, 439, 496, 384, 318 and 182, respectively, in age groups 0–10, 11–20, 21–30, 31–40, 41–50, 51–60, 61–70, 71–80 and 81+ years) and second (positive x = 0, 2, 2, 2, 2, 7, 6, 6 and 2, tested n = 157, 210, 191, 241, 366, 439, 389, 262 and 128, respectively, in age groups 0–10, 11–20, 21–30, 31–40, 41–50, 51–60, 61–70, 71–80 and 81+ years) surveys separately. The error bars represent the 95% exact binomial CI.
Extended Data Fig. 2
Extended Data Fig. 2. Symptomatic and asymptomatic infection statistics.
a, Relative proportion of asymptomatic and symptomatic SARS-CoV-2 infections among the total number of positive swabs in the first survey (first survey – total cases; asymptomatic x = 29, symptomatic x = 44, tested n = 73), second survey (second survey – total cases; asymptomatic x = 13, symptomatic x = 16, tested n = 29) and among the number of new positive swabs in the second survey (second survey – new cases; asymptomatic x = 5, symptomatic x = 3, tested n = 8). The error bars represent the 95% exact binomial CI. b, Age distribution and relative proportion of asymptomatic and symptomatic SARS-CoV-2-positive infections among the total number of positive swabs in the first survey (first survey – total cases; asymptomatic x = 0, 2, 0, 3, 3, 6, 6, 8 and 1, symptomatic x = 0, 1, 4, 4, 2, 10, 9, 11 and 3, respectively, in age groups 0–10, 11–20, 21–30, 31–40, 41–50, 51–60, 61–70, 71–80 and 81+ years; tested n = 73) and among the number of new positive swabs in the second survey (second survey – new cases; asymptomatic x = 0, 0, 0, 0, 1, 1, 2, 1 and 0, symptomatic x = 0, 1, 0, 0, 0, 1, 0, 1 and 0, respectively, in age groups 0–10, 11–20, 21–30, 31–40, 41–50, 51–60, 61–70, 71–80 and 81+ years; tested n = 8). The error bars represent the 95% exact binomial CI.
Extended Data Fig. 3
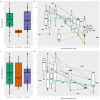
Extended Data Fig. 3. Viral load for asymptomatic, pre-symptomatic and symptomatic infections and viral load dynamics relative to the number of days from symptom onset.
a, The median (solid line), the interquartile range (that is, 25th to 75th percentiles (box)) and the range (that is, minimum to maximum (whiskers)) of gene E genome equivalent copies per ml (log10 scale, y axis) calculated from RT–PCR interpolated values (asymptomatic n = 23, pre-symptomatic n = 5 and symptomatic n = 30). The raw Ct data and the derived values of the genome equivalent copies are provided in the data set. b, The median (solid line), the interquartile range (that is, 25th to 75th percentiles (box)) and the range (that is, minimum to maximum (whiskers)) of gene E genome equivalent copies per ml (log10 scale, y axis) versus the number of days from symptom onset (days, x axis); n = 34 participants. The lines in colour join measurements from the same participant. The solid lines identify the four participants with sequential viral load measurements for both gene E and gene RdRp. c, The median (solid line), the interquartile range (that is, 25th to 75th percentiles (box)) and the range (that is, minimum to maximum (whiskers)) of RdRp genome equivalent copies per ml (log10 scale, y axis) calculated from RT–PCR interpolated values (asymptomatic n = 26, pre-symptomatic n = 9 and symptomatic n = 27). The raw Ct data and the derived values of genome equivalent copies are provided in the data set. d, The median (solid line), the interquartile range (that is, 25th to 75th percentiles (box)) and the range (that is, minimum to maximum (whiskers)) of RdRp genome equivalent copies per ml (log10 scale, y axis) versus the number of days from symptom onset (days, x axis); n = 28 participants. The lines in colour join measurements from the same participant. The solid lines identify the four participants with sequential viral load measurements for both gene E and gene RdRp.
Extended Data Fig. 4
Extended Data Fig. 4. Serial interval distribution and transmission chains.
a, Estimated serial interval distributions for the whole study period (overall) and for the pre-lockdown (before 24 February 2020) and post-lockdown (after 24 February 2020) periods. b, Observed transmission clusters from reported and household contacts. Each node (circle) represents a positive infection, and the edges (the line connecting the nodes) connect positive infections that reported contacts or are household members. The different colours represent different clusters of infection.
Extended Data Fig. 5
Extended Data Fig. 5. Flow chart of the mathematical model fitted to the point prevalence data observed in Vo’ at the first and second surveys.
Further details are provided in the Methods.
Extended Data Fig. 6
Extended Data Fig. 6. SARS-CoV-2 dynamics in Vo’ inferred from the fit of the dynamical model to the observed prevalence of symptomatic, pre-symptomatic and asymptomatic infections in the first and second surveys.
Each sub-panel represents the model fit using the specified values of R01 (the reproduction number before the lockdown) and 1/σ (the average duration of positivity beyond the duration of the infectious period). The dashed vertical line represents the time that lockdown started. The points represent the observed prevalence data; the 95% CI is the exact binomial CI. The solid lines represent the mean and the shading represents the 95% credible interval obtained from 100 samples from the posterior distribution of the parameters.
Fig. 1
Fig. 1. Study description.
a, Map showing the location of Vo’ and the Veneto region (grey area) within Italy, produced using shapefiles from GADM (https://gadm.org/) and Italian National Institute of Statistics (ISTAT; https://www.istat.it/it/archivio/222527 and https://www.istat.it/it/archivio/104317#accordions). b, Flow chart summarizing the key statistics on the two sequential nasopharyngeal swab surveys conducted in Vo’ to assess the transmission of SARS-CoV-2 before and after the implementation of interventions. c, Summary of the key events in the study period.
Fig. 2
Fig. 2. SARS-CoV-2 prevalence statistics.
a, The prevalence of SARS-CoV-2 infection at the first survey (x = 73 positive out of n = 2,812 tested) and the second survey (x = 29 positive out of n = 2,343 tested). The error bars represent the 95% exact binomial CI. b, The number of SARS-CoV-2 infections detected in the sampled population of the residents of Vo’ in the first survey (x = 73) and the second survey (x = 29, of which 8 were new infections).
Fig. 3
Fig. 3. SARS-CoV-2 dynamics of the mitigated and counterfactual unmitigated epidemic in Vo’ and the relative final size estimates.
a, The prevalence of SARS-CoV-2 infection inferred from the observed prevalence data for symptomatic, presymptomatic and asymptomatic infections in the first and second surveys using R01 (the reproduction number before the lockdown) = 2.4 and 1/σ (the average duration of positivity beyond the duration of the infectious period) = 4 days. The dashed vertical line represents the time that the lockdown started. The points represent the observed prevalence data, the 95% CI is the exact binomial CI. The solid lines represent the mean and the shading represents the 95% credible interval obtained with the model from 100 samples from the posterior distribution of the parameters. b, The incidence of the epidemic fitted to the prevalence data (blue) and of the unmitigated epidemic (red), obtained assuming the same initial reproduction number value R01=2.4 throughout the whole epidemic and 1/σ = 4 days. The dashed vertical line represents the time that the lockdown started. The solid lines represent the mean and the shading represents the 95% credible interval obtained with the model from 100 samples from the posterior distribution of the parameters. c, The mean epidemic final size (the proportion of the population infected at the end of the epidemic) of the counterfactual unmitigated epidemic (red) and of the epidemic fitted from the prevalence data with the lockdown (blue). The error bars represent the range (minimum to maximum) of the mean final size obtained from n = 100 independent samples drawn from the posterior distribution of the parameters, calculated over the models with DIC (deviance information criterion) < 36.4.

Comment in

References

    1. Crisanti A, Cassone A. In one Italian town, we showed mass testing could eradicate the coronavirus. The Guardian. 2020 https://www.theguardian.com/commentisfree/2020/mar/20/eradicated-coronav... .
    1. World Health Organization. Novel coronavirus (COVID-19) situation. WHO; 2020. https://covid19.who.int/
    1. Saini V. Coronavirus: voices from a quarantined Italian town. EU Observer. 2020 https://euobserver.com/coronavirus/147552 .
    1. Zhou P, et al. A pneumonia outbreak associated with a new coronavirus of probable bat origin. Nature. 2020;579:270–273. doi: 10.1038/s41586-020-2012-7. - DOI - PMC - PubMed
    1. Volz E, et al. Report 5: phylogenetic analysis of SARS-CoV-2. Imperial College London; 2020. https://www.imperial.ac.uk/media/imperial-college/medicine/mrc-gida/2020... .

Publication types

MeSH terms

Substances