

Wearable Monitoring and Interpretable Machine Learning Can Objectively Track Progression in Patients during Cardiac Rehabilitation
- PMID: 32604829
- PMCID: PMC7349532
- DOI: 10.3390/s20123601
Wearable Monitoring and Interpretable Machine Learning Can Objectively Track Progression in Patients during Cardiac Rehabilitation
Abstract
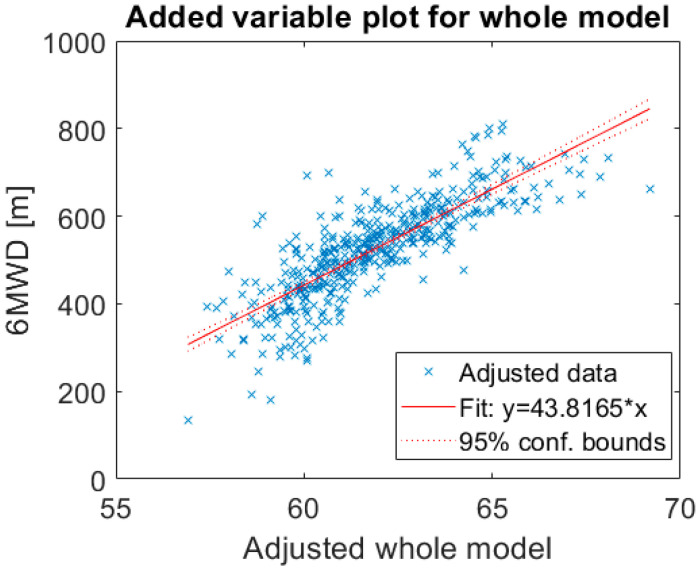
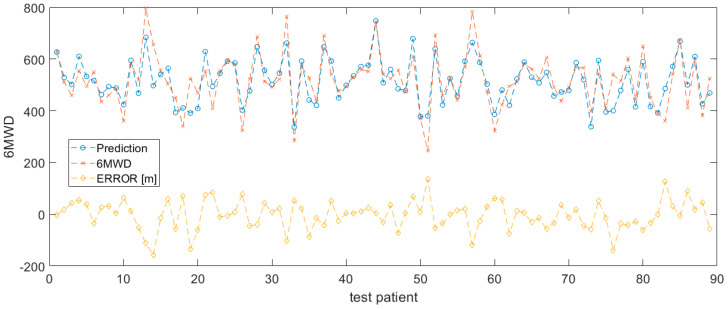
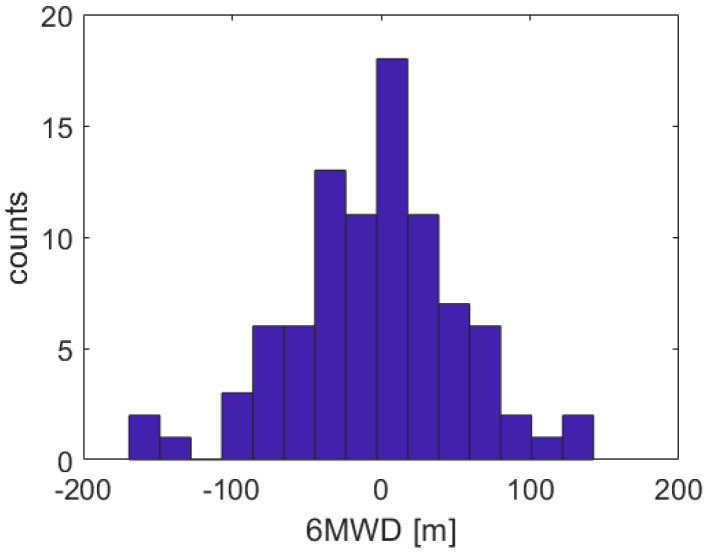
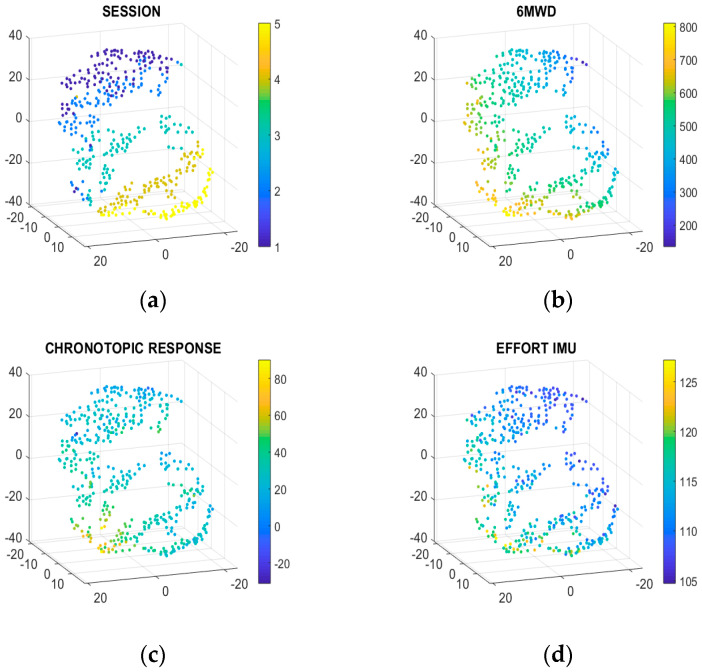
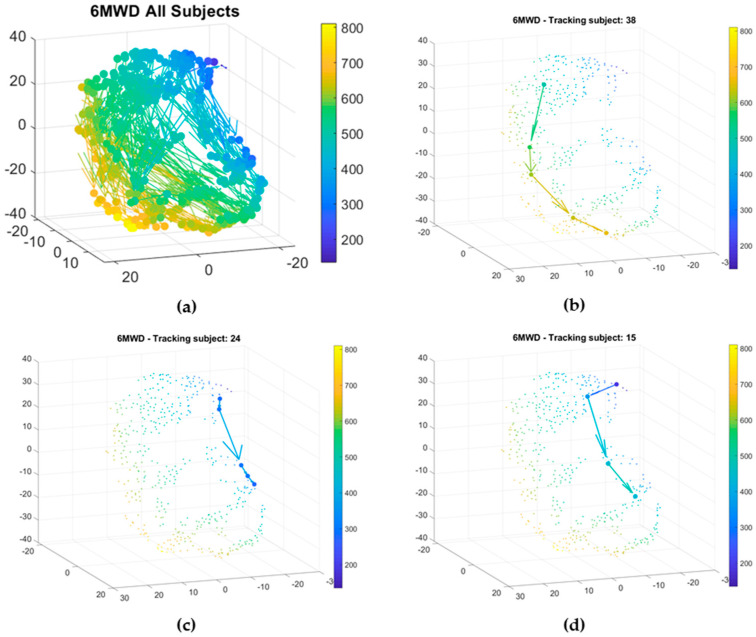
Cardiovascular diseases (CVD) are often characterized by their multifactorial complexity. This makes remote monitoring and ambulatory cardiac rehabilitation (CR) therapy challenging. Current wearable multimodal devices enable remote monitoring. Machine learning (ML) and artificial intelligence (AI) can help in tackling multifaceted datasets. However, for clinical acceptance, easy interpretability of the AI models is crucial. The goal of the present study was to investigate whether a multi-parameter sensor could be used during a standardized activity test to interpret functional capacity in the longitudinal follow-up of CR patients. A total of 129 patients were followed for 3 months during CR using 6-min walking tests (6MWT) equipped with a wearable ECG and accelerometer device. Functional capacity was assessed based on 6MWT distance (6MWD). Linear and nonlinear interpretable models were explored to predict 6MWD. The t-distributed stochastic neighboring embedding (t-SNE) technique was exploited to embed and visualize high dimensional data. The performance of support vector machine (SVM) models, combining different features and using different kernel types, to predict functional capacity was evaluated. The SVM model, using chronotropic response and effort as input features, showed a mean absolute error of 42.8 m (±36.8 m). The 3D-maps derived using the t-SNE technique visualized the relationship between sensor-derived biomarkers and functional capacity, which enables tracking of the evolution of patients throughout the CR program. The current study showed that wearable monitoring combined with interpretable ML can objectively track clinical progression in a CR population. These results pave the road towards ambulatory CR.
Keywords: cardiac rehabilitation; machine learning; patient progression monitoring; physical fitness assessment; wearable sensor.
Conflict of interest statement
The authors declare no conflict of interest.
Figures
Similar articles
-
Wearable Cardioverter-Defibrillator-Measured Step Count for the Surveillance of Physical Fitness during Cardiac Rehabilitation.Sensors (Basel). 2021 Oct 25;21(21):7054. doi: 10.3390/s21217054. Sensors (Basel). 2021. PMID: 34770361 Free PMC article.
-
Using Biosensors and Digital Biomarkers to Assess Response to Cardiac Rehabilitation: Observational Study.J Med Internet Res. 2020 May 20;22(5):e17326. doi: 10.2196/17326. J Med Internet Res. 2020. PMID: 32432552 Free PMC article.
-
A Combination of Indoor Localization and Wearable Sensor-Based Physical Activity Recognition to Assess Older Patients Undergoing Subacute Rehabilitation: Baseline Study Results.JMIR Mhealth Uhealth. 2019 Jul 10;7(7):e14090. doi: 10.2196/14090. JMIR Mhealth Uhealth. 2019. PMID: 31293244 Free PMC article.
-
Ambulatory cardiac bio-signals: From mirage to clinical reality through a decade of progress.Int J Med Inform. 2019 Oct;130:103928. doi: 10.1016/j.ijmedinf.2019.07.007. Epub 2019 Jul 15. Int J Med Inform. 2019. PMID: 31434042 Review.
-
New Sensor and Wearable Technologies to Aid in the Diagnosis and Treatment Monitoring of Parkinson's Disease.Annu Rev Biomed Eng. 2019 Jun 4;21:111-143. doi: 10.1146/annurev-bioeng-062117-121036. Annu Rev Biomed Eng. 2019. PMID: 31167102 Review.
Cited by
-
A Mobile Application to Perform the Six-Minute Walk Test (6MWT) at Home: A Random Walk in the Park Is as Accurate as a Standardized 6MWT.Sensors (Basel). 2022 Jun 3;22(11):4277. doi: 10.3390/s22114277. Sensors (Basel). 2022. PMID: 35684898 Free PMC article.
-
Predicting Adverse Events During Six-Minute Walk Test Using Continuous Physiological Signals.Front Physiol. 2022 Jun 6;13:887954. doi: 10.3389/fphys.2022.887954. eCollection 2022. Front Physiol. 2022. PMID: 35734001 Free PMC article.
-
Design Requirements for Cardiac Telerehabilitation Technologies Supporting Athlete Values: Qualitative Interview Study.JMIR Rehabil Assist Technol. 2025 Apr 17;12:e62986. doi: 10.2196/62986. JMIR Rehabil Assist Technol. 2025. PMID: 40245391 Free PMC article.
-
A comprehensive review of machine learning algorithms and their application in geriatric medicine: present and future.Aging Clin Exp Res. 2023 Nov;35(11):2363-2397. doi: 10.1007/s40520-023-02552-2. Epub 2023 Sep 8. Aging Clin Exp Res. 2023. PMID: 37682491 Free PMC article. Review.
-
Application of Artificial Intelligence in Medicine: An Overview.Curr Med Sci. 2021 Dec;41(6):1105-1115. doi: 10.1007/s11596-021-2474-3. Epub 2021 Dec 6. Curr Med Sci. 2021. PMID: 34874486 Free PMC article. Review.
References
-
- Gregory A.R., Degu A., Kalkidan H.A., Solomon M.A., Cristiana A., Nooshin A., Hedayat A., Foad A.-A., Jemal A., Ahmed A., et al. Global, regional, and national age-sex-specific mortality for 282 causes of death in 195 countries and territories, 1980–2017: A systematic analysis for the Global Burden of Disease Study 2017. Lancet. 2018;392:1736–1788. - PMC - PubMed
-
- Ponikowski P., Voors A.A., Anker S.D., Bueno H., Cleland J.G.F., Coats A.J.S., Volkmar F., José R.G.-J., Veli-Pekka H., Ewa A.J., et al. 2016 ESC Guidelines for the diagnosis and treatment of acute and chronic heart failure: The Task Force for the diagnosis and treatment of acute and chronic heart failure of the European Society of Cardiology (ESC)Developed with the special contribution of the Heart Failure Association (HFA) of the ESC. Eur. Heart J. 2016;37:2129–2200. - PubMed
-
- Thomas R.J., Balady G., Banka G., Beckie T.M., Chiu J., Gokak S. 2018 ACC/AHA Clinical Performance and Quality Measures for Cardiac Rehabilitation: A Report of the American College of Cardiology/American Heart Association Task Force on Performance Measures. J. Am. Coll. Cardiol. 2018;71:1814–1837. doi: 10.1016/j.jacc.2018.01.004. - DOI - PubMed
-
- Yancy C.W., Jessup M., Bozkurt B., Butler J., Casey D.E., Jr., Drazner M.H., Gregg C.F., Stephen A.G., Tamara H., James L.J., et al. 2013 ACCF/AHA guideline for the management of heart failure: A report of the American College of Cardiology Foundation/American Heart Association Task Force on Practice Guidelines. J. Am. Coll. Cardiol. 2013;62:e147–e239. doi: 10.1016/j.jacc.2013.05.019. - DOI - PubMed
MeSH terms
Grants and funding
LinkOut - more resources
Full Text Sources
Other Literature Sources
Medical
