. 2020 Jun 26;9(6):1560.
doi: 10.3390/cells9061560.

Mistletoe-Extract Drugs Stimulate Anti-Cancer Vγ9Vδ2 T Cells

Affiliations

Mistletoe-Extract Drugs Stimulate Anti-Cancer Vγ9Vδ2 T Cells

Ling Ma et al. Cells. .

Abstract

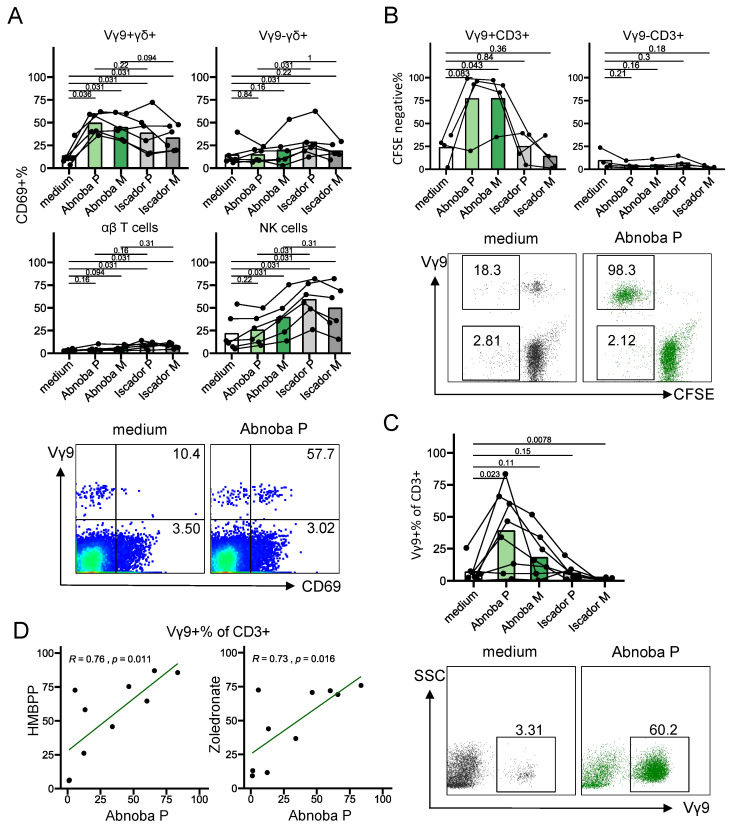
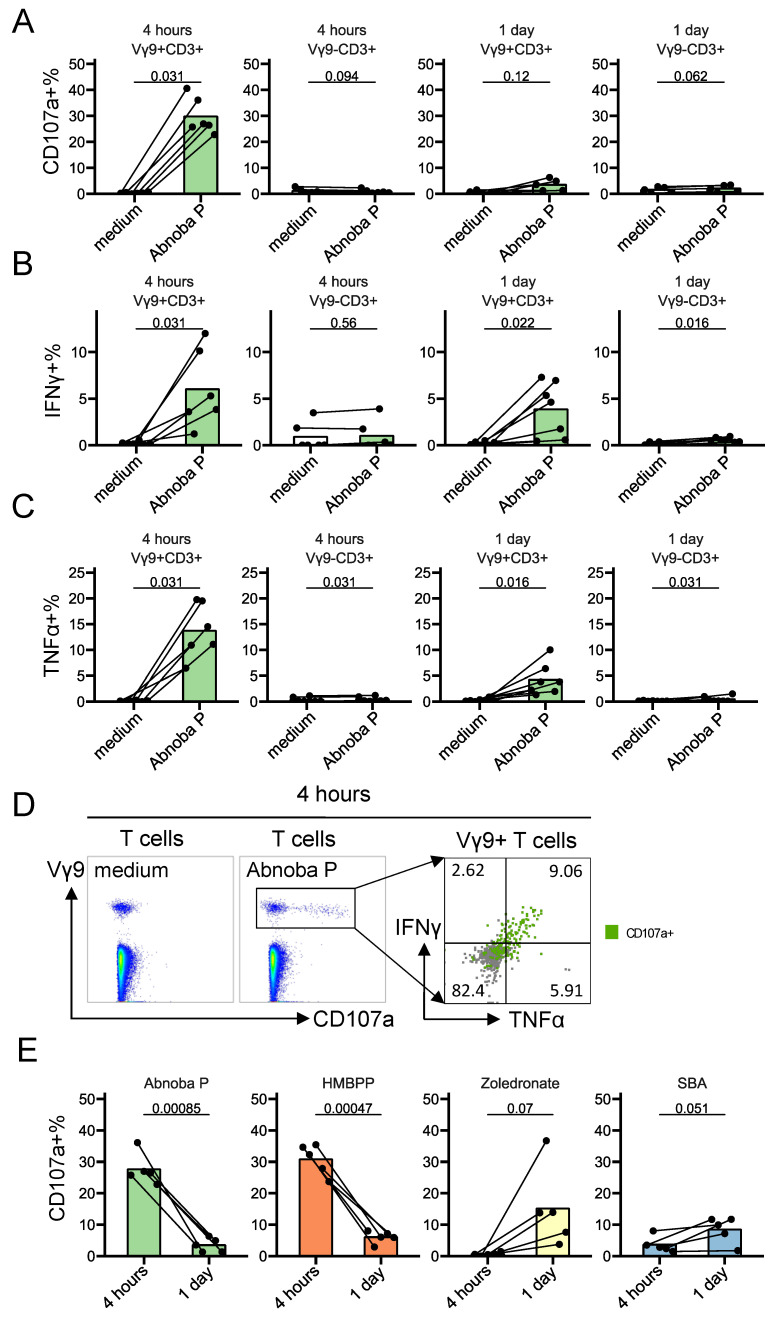
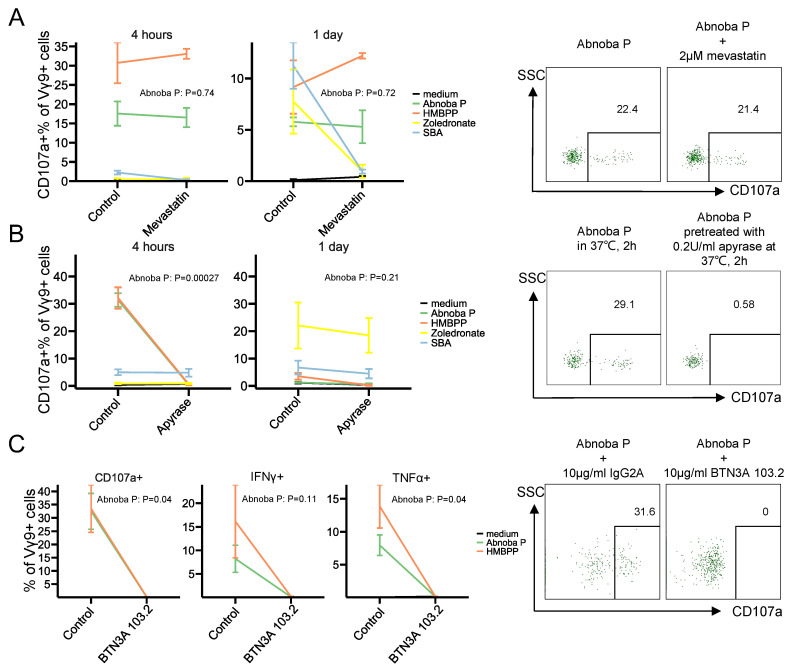
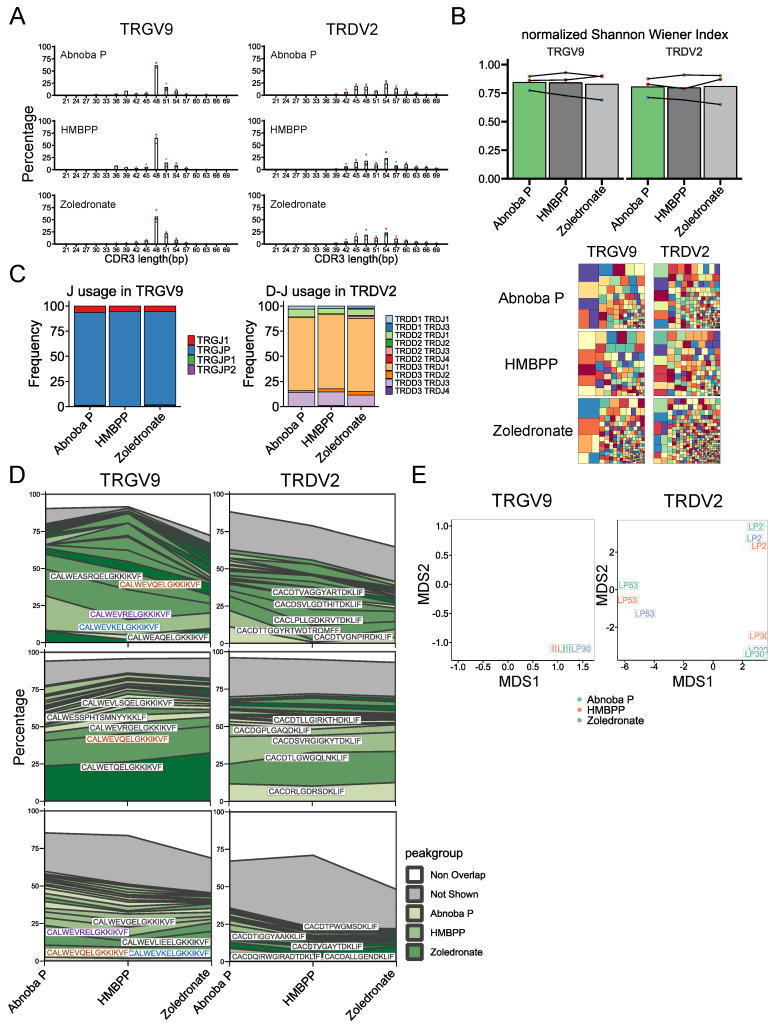
Human phosphoantigen-reactive Vγ9Vδ2 T cells possess several characteristics, including MHC-independent recognition of tumor cells and potent killing potential, that make them attractive candidates for cancer immunotherapeutic approaches. Injectable preparations from the hemi-parasite plant Viscum album L. (European mistletoe) are commonly prescribed as complementary cancer therapy in European countries such as Germany, but their mechanism of action remains poorly understood. Here, we investigated in-depth the in vitro response of human T cells towards mistletoe-extract drugs by analyzing their functional and T-cell-receptor (TCR) response using flow cytometry and high-throughput sequencing respectively. Non-fermented mistletoe-extract drugs (AbnobaViscum), but not their fermented counterparts (Iscador), induced specific expansion of Vγ9Vδ2 T cells among T cells. Furthermore, AbnobaViscum rapidly induced the release of cytotoxic granules and the production of the cytokines IFNγ and TNFα in Vγ9Vδ2 T cells. This stimulation of anti-cancer Vγ9Vδ2 T cells was mediated by the butyrophilin BTN3A, did not depend on the accumulation of endogenous phosphoantigens and involved the same Vγ9Vδ2 TCR repertoire as those of phosphoantigen-reactive Vγ9Vδ2 T cells. These insights highlight Vγ9Vδ2 T cells as a potential target for mistletoe-extract drugs and their role in cancer patients receiving these herbal drugs needs to be investigated.

Keywords: T cell receptor; TCR; Vgamma9Vdelta2; gammadelta; herbal drug; mistletoe.


Conflict of interest statement

The authors declare no conflict of interest.

Figures

Figure 1
Figure 1
AbnobaViscum but not Iscador mistletoe extracts induce specific expansion of Vγ9Vδ2 T cells. (A) Percentage of CD69 expression on different cell types after stimulation with different mistletoe extracts for 1 day. Upper left: Vγ9+ γδ T cells (CD3+γδ+Vγ9+); upper right: Vγ9− γδ T cells (CD3+γδ+Vγ9−); lower left: αβ T cells (CD3+γδ−); lower right: natural killer (NK) cells (CD3−CD56+). Lines connect the same subjects (n = 6), bars indicate mean values. Values on the graphs indicate p values (obtained with the Wilcoxon signed-rank test). Bottom panels show representative flow cytometry plots (gated on CD3+ T cells), numbers indicate percentages of CD69+ cells, expressed as a percentage of Vγ9+CD3+ cells (top) and as a percentage of Vγ9−CD3+ cells (bottom). (B) Percentage of CFSE-negative Vγ9+ T cells (CD3+Vγ9+, upper left) and Vγ9− T cells (CD3+Vγ9−, upper right) after stimulation for 5 days with different mistletoe extracts. Lines connect the same subjects (n = 4), bars indicate mean values. Values on the graphs indicate p values (obtained with the paired T-test). Bottom panels show representative flow cytometry plots (gated on CD3+ T cells), numbers indicate percentages of CFSE-negative cells, expressed as a percentage of Vγ9+CD3+ (top) and as a percentage of Vγ9−CD3+ (bottom). (C) Percentage of Vγ9+ cells (of total CD3+ T cells) after stimulated with different mistletoe extracts for 7 days. Lines connect the same subjects (n = 8), bars indicate mean values. Values on the graphs indicate p values (obtained with the Wilcoxon signed-rank test). Bottom panels show representative flow cytometry plots (gated on CD3+ T cells), numbers indicate percentages of positive cells in the indicated gates. (D) Correlation between AbnobaViscum P- and HMBPP-, and zoledronate-induced expansion (7 days). Each dot represents one subject (n = 10).
Figure 2
Figure 2
AbnobaViscum rapidly stimulate the release of cytotoxic granules and the production of IFNγ and TNFα in Vγ9Vδ2 T cells. (AC) CD107a (A), IFN-γ (B) and TNF-α (C) expression on Vγ9+ T cells and Vγ9− T cells after AbnobaViscum Pini (Abnoba P) stimulation. Lines connect the same subjects (n = 6), bars indicate mean value. Values on the graphs indicate p values (obtained with the Wilcoxon signed-rank test). (D) Representative flow cytometry plots (4 h stimulation): the first two plots are gated on T cells (medium control on the left, Abnoba P on the right), the third plot is gated on Vγ9+ T cells (Abnoba P), illustrating CD107a, IFNγ and TNFα co-expression (E) Kinetics of CD107a expression on Vγ9+ T cells by Abnoba P, HMBPP, zoledronate and sec-butylamine (SBA). Lines connect the same subjects (n = 5), bars indicate mean values. Values on the graphs indicate p values (obtained with the paired T-test).
Figure 3
Figure 3
AbnobaViscum stimulation of Vγ9Vδ2 T cells is direct and BTN3A-dependent. (A) CD107a expression on Vγ9+ T cells upon mevastatin treatment within each stimulation. Lines connect the mean values between control and mevastatin treatment within the same stimulation, error bars show mean±sem (n = 3). Representative flow cytometry plots after 4 h stimulation are on the right of the graphs (gate on CD3+Vγ9+ T cells). (B) CD107a expression on Vγ9+ T cells upon apyrase treatment within each stimulation. Lines connect the mean values between control and apyrase treatment within the same stimulation, error bars show mean±sem (n = 5 for 4 h, n = 3 for 1 day). Representative flow cytometry plots after 4 h stimulation are on the right of the graphs (gate on CD3+Vγ9+ T cells). (C) CD107a (left), IFNγ (middle), TNFα (right) expression in Vγ9+ T cells upon blocking BTN3A within each stimulation for 4 h. Lines connect the mean values between isotype control and BTN3A 103.2 mAb within the same stimulation, error bars show mean±sem (n = 3). Representative CD107a stainings (4 h stimulation) after are on the right of the graphs (gate on CD3+Vγ9+ T cells). Values on the graphs indicate p values (obtained with paired T-test).
Figure 4
Figure 4
The AbnobaViscum-responsive Vγ9Vδ2 TCR repertoire is similar to the phosphoantigen-responsive repertoire. (A) Distribution of CDR3 length for TRGV9- and TRDV2-containing CDR3 sequences after expansion with the indicated Vγ9Vδ2 T cell stimulators. Each color of the dots represents the same subject, bar indicates mean percentage for each CDR3 length (expressed in nucleotides). (B) Diversity of TRGV9- and TRDV2- containing CDR3. Normalized Shannon Wiener index: each color of the dots represents the same subject, lines connect each subject, bars indicate mean value. Representative treemaps for the indicated stimulators are below the graphs: each small square represents a CDR3 sequence of which the size is related to the frequency of the sequence within the repertoire within each sample (rectangle colors are chosen randomly and do not match between plots). (C) Mean J gene segment usage in TRGV9-containing CDR3 (left) and mean D-J gene segment usage in TRDV2-containing CDR3 sequences (right) (n = 3). (D) Sequence overlap between AP-, HMBPP- and zoledronate-induced expansions for TRGV9-containing CDR3 (left) and TRDV2-containing CDR3 (right). The top 20 sequences are filled with different green shades, the remaining overlapping sequences are indicated in grey and the non-overlapping sequences are in white. Top 5 shared sequences are provided on the plots for each subject: colored sequences occur in more than one subject while black sequences indicate unique sequences. (E) Multidimensional scaling analysis of TRGV9-containing CDR3 sequences (left) and TRDV2-containing CDR3 sequences (right). Colors indicate each expansion; the subject number is indicated within each small square.

Similar articles

Cited by

References

    1. Sebestyen Z., Prinz I., Déchanet-Merville J., Silva-Santos B., Kuball J. Translating gammadelta (γδ) T cells and their receptors into cancer cell therapies. Nat. Rev. Drug Discov. 2020;19:169–184. doi: 10.1038/s41573-019-0038-z. - DOI - PubMed
    1. Silva-Santos B., Mensurado S., Coffelt S.B. γδ T cells: Pleiotropic immune effectors with therapeutic potential in cancer. Nat. Rev. Cancer. 2019;19:392–404. doi: 10.1038/s41568-019-0153-5. - DOI - PMC - PubMed
    1. Vermijlen D., Prinz I. Ontogeny of Innate T Lymphocytes-Some Innate Lymphocytes are More Innate than Others. Front. Immunol. 2014;5:486. doi: 10.3389/fimmu.2014.00486. - DOI - PMC - PubMed
    1. Fichtner A.S., Ravens S., Prinz I. Human γδ TCR Repertoires in Health and Disease. Cells. 2020;9:800. doi: 10.3390/cells9040800. - DOI - PMC - PubMed
    1. Eberl M., Hintz M., Reichenberg A., Kollas A.K., Wiesner J., Jomaa H. Microbial isoprenoid biosynthesis and human gammadelta T cell activation. FEBS Lett. 2003;544:4–10. doi: 10.1016/S0014-5793(03)00483-6. - DOI - PubMed

Publication types

MeSH terms