Review
. 2020 Jun 26;25(12):2948.
doi: 10.3390/molecules25122948.

Near-Infrared Spectroscopy in Bio-Applications

Affiliations
Review

Near-Infrared Spectroscopy in Bio-Applications

Krzysztof B Beć et al. Molecules. .

Abstract

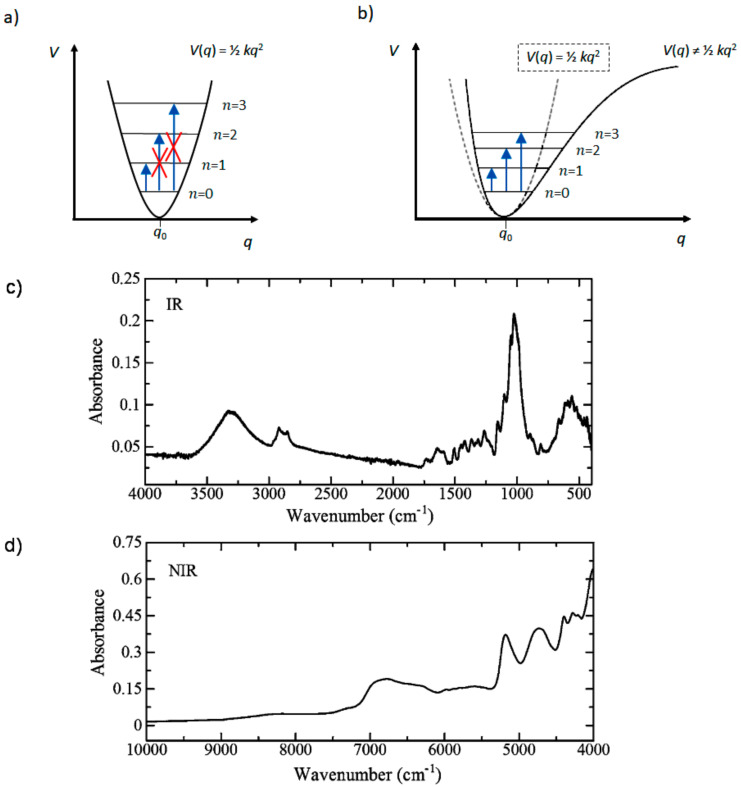
Near-infrared (NIR) spectroscopy occupies a specific spot across the field of bioscience and related disciplines. Its characteristics and application potential differs from infrared (IR) or Raman spectroscopy. This vibrational spectroscopy technique elucidates molecular information from the examined sample by measuring absorption bands resulting from overtones and combination excitations. Recent decades brought significant progress in the instrumentation (e.g., miniaturized spectrometers) and spectral analysis methods (e.g., spectral image processing and analysis, quantum chemical calculation of NIR spectra), which made notable impact on its applicability. This review aims to present NIR spectroscopy as a matured technique, yet with great potential for further advances in several directions throughout broadly understood bio-applications. Its practical value is critically assessed and compared with competing techniques. Attention is given to link the bio-application potential of NIR spectroscopy with its fundamental characteristics and principal features of NIR spectra.

Keywords: NIR; NIRS; analytical; bioscience; biospectroscopy; near-infrared spectroscopy.


Conflict of interest statement

The authors declare no conflict of interest.

Figures

Figure 1
Figure 1
(a,b) Vibrational potential, vibrational levels and transitions of diatomic (i.e., one-dimensional) oscillator in (a) harmonic approximation, and (b) its real (anharmonic) nature, (c,d) comparison of infrared (IR) (c) and near-infrared (NIR) (d) spectra of the same sample (wood of Douglas fir species). The symbols denote: V—the potential energy; q—vibrational coordinate; k—force constant; n—vibrational quantum number. Panels (c,d) reproduced with permission from Springer Open, Ref. [16].
Figure 2
Figure 2
Dissection of the PLS regression vectors developed by Henn et al. [33] for prediction of blood constituents from NIR absorbance (I.A) and IR difference (II.A) spectra of a 5-component model mixture in artificial dialysate solutions. Relative (to the maximum value) intensity of the regression vector for glucose (B) and urea (C), lactate (D), phosphate (E) and creatinine (F). Adapted in agreement with CC BY 4.0 license, Ref. [35].
Figure 3
Figure 3
The structure of PLS regression coefficients vectors for simultaneous determination of HSA (a,d), γ-globulin (b,e), and glucose (c,f) concentrations from NIR spectra of model solutions developed by Kasemsumran et al. Ref. [36]. Reproduced with permission from Royal Chemical Society, Ref. [36].
Figure 4
Figure 4
UV-vis-NIR spectrum of AuNRs suspension in water (A). Spectra of gold nanorods (AuNRs) dispersed in serum containing media (SCM) with 0–30% of fetal bovine serum (FBS) and different incubation times (B). Spectra of bovine serum albumin (BSA)/AuNRs samples (C). Reproduced in agreement with CC BY 4.0 license from Ref. [46].
Figure 5
Figure 5
NIR image presenting the distribution of total hemoglobin (tHb) and tissue oxygen saturation (stO2) concentrations on both left and right breast acquired from a 56-year-old subject. Reproduced in compliance with CC BY license from Ref. [53].
Figure 6
Figure 6
NIR spectra of Rosmarini folium samples measured on benchtop (NIRFlex N-500) and handheld (microPHAZIR and MicroNIR 2200) spectrometers. Reproduced with permission from Royal Society of Chemistry, Ref. [75].
Figure 7
Figure 7
A visual assessment and evaluation of the chemical sensitivity profiles of NIR spectrometers (reference benchtop vs. handheld) by two-dimensional correlation spectroscopy (2D-COS).
Figure 8
Figure 8
PLS regression coefficients plots for the best performing calibration models for verbenalin and verbascoside content in Verbena officinalis samples. The models were constructed for NIR spectra measured on NIRFlex N-500 (benchtop) and microPhazir (miniaturized) spectrometers. Reproduced with permission from Elsevier, Ref. [77].
Figure 9
Figure 9
The analysis of NIR images of medicinal plants. PCA score image (t1) of Echinacea sp. leaf powders based on color amplitudes (a). The corresponding score plot (PC1 vs. PC3) shows minimal separation of the pixel clusters (b). (EAL—E. angustifolia leaf, EPL—E. purpurea leaf, EPaL—E. pallida leaf). Reproduced in compliance with CC BY license from Ref. [80].
Figure 10
Figure 10
PCA scores plot of NIR spectra of yolk measured over the development time of Oryzias latipes embryo (a). Δ indicates the data collected from the first to the tenth day and ⚪ denotes data collected at the day before hatching. Loadings plot of PC-1 (b). Reproduced from Ref. [83] in agreement with CC BY 4.0 license.
Figure 11
Figure 11
Insight into origins of the NIR spectrum available from quantum chemical calculation on the example of a short chain fatty acid (vinyl acetic acid). Note, all bands are presented in common intensity scale (two inside panels present scaled-up intensity). This demonstrates well the convoluted nature of NIR spectra, which results from strongly overlapping numerous weak bands. Reproduced with permission from Ref. [91]. Copyright (2017) American Chemical Society.
Figure 12
Figure 12
The analysis of mode contribution for the NIR spectrum of thymol (solution; 100 mg mL−1 CCl4) based on the simulated data. (A) Experimental and simulated outlines. (B) Contributions of selected modes as described on the figure. Reproduced with permission from Ref. [96].
Figure 13
Figure 13
Simulated spectra of the carbohydrate-hydration shell system on the example of glucose and fructose. The color bars represent the relative spectral contributions (color scale: yellow—high; black—none) from: pure vibrations of hydration shell (h.s.); pure vibrations of carbohydrate (c.); cooperative vibrations of carbohydrate and hydration shell (coop). Reproduced in compliance with CC BY 4.0 license from Ref. [104].
Figure 14
Figure 14
(a) Schematic illustration of the neurovascular unit and the changes in cerebral hemodynamics and oxygenation induced by neural activity. (b) Exemplary illustration of a possible NIRS montage on the human head and the assumed banana-shaped course of detected light of “short-separation channels” and of “long-separation channels”. fNIRS, functional near-infrared spectroscopy; CMRO2, cerebral metabolic rate of oxygen; increase; decrease. Reproduced in compliance with CC BY 4.0 license from Ref. [113].
Figure 15
Figure 15
Discrimination between terrain types and different types of vegetation based on a cost-effective UAV NIR spectroscopy. (a) Reference NIR spectral signatures associated to the elements of terrain and vegetation; (b) the reference Vis (RGB) multispectral image; (c,d) classification maps derived from NIR spectral analysis using different methods of classification for image generation. Adopted in agreement with CC BY 4.0 license, from Ref. [128].

Similar articles

Cited by

References

    1. Huck C.W., Beć K.B. Advances in near infrared spectroscopy and related computational methods. Molecules. 2019;24:4370. - PMC - PubMed
    1. Ozaki Y., Huck C.W., Beć K.B. Near-IR spectroscopy and its applications. In: Gupta V.P., editor. Molecular and Laser Spectroscopy. Advances and Applications. Elsevier; San Diego, CA, USA: 2018. pp. 11–38.
    1. Czarnecki M.A., Morisawa Y., Futami Y., Ozaki Y. Advances in molecular structure and interaction studies using near-infrared spectroscopy. Chem. Rev. 2015;115:9707–9744. doi: 10.1021/cr500013u. - DOI - PubMed
    1. Beć K.B., Grabska J., Huck C.W. Molecular and bioanalytical applications of infrared spectroscopy—A review. Anal. Chim. Acta. 2020 in press. - PubMed
    1. Barańska M., Roman M., Majzner K. General overview on vibrational spectroscopy applied in biology and medicine. In: Barańska M., editor. Optical Spectroscopy and Computational Methods in Biology and Medicine. Challenges and Advances in Computational Chemistry and Physics. Volume 14 Springer; Dordrecht, The Netherlands: 2014.