. 2020 Jun 27;8(7):964.
doi: 10.3390/microorganisms8070964.

Metabolic Activation of CsgD in the Regulation of Salmonella Biofilms

Affiliations

Metabolic Activation of CsgD in the Regulation of Salmonella Biofilms

Akosiererem S Sokaribo et al. Microorganisms. .

Abstract

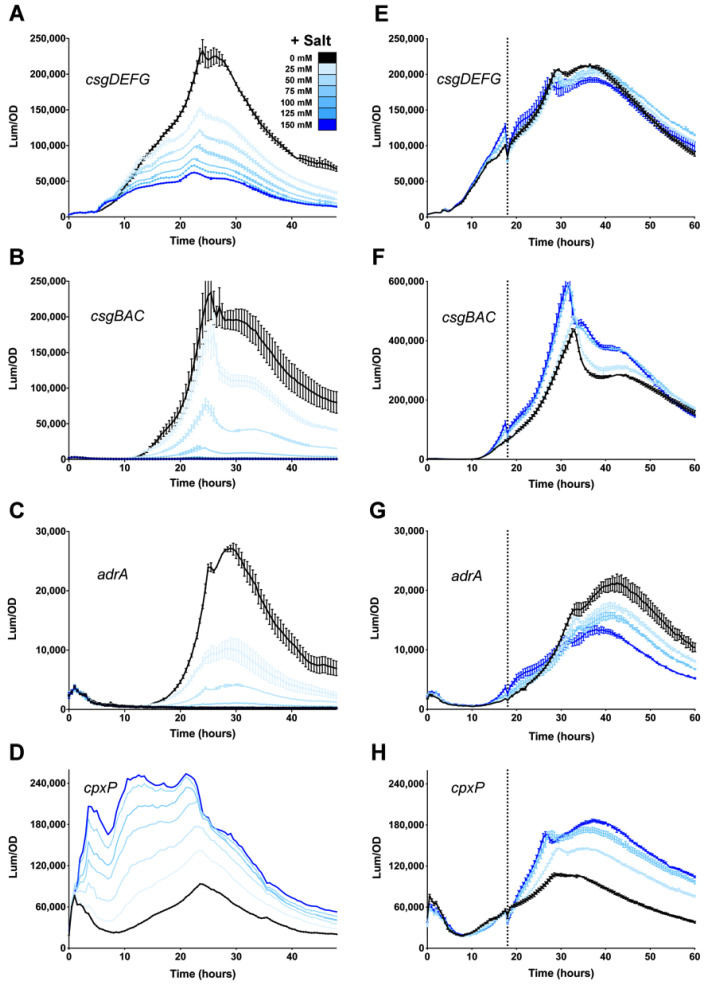
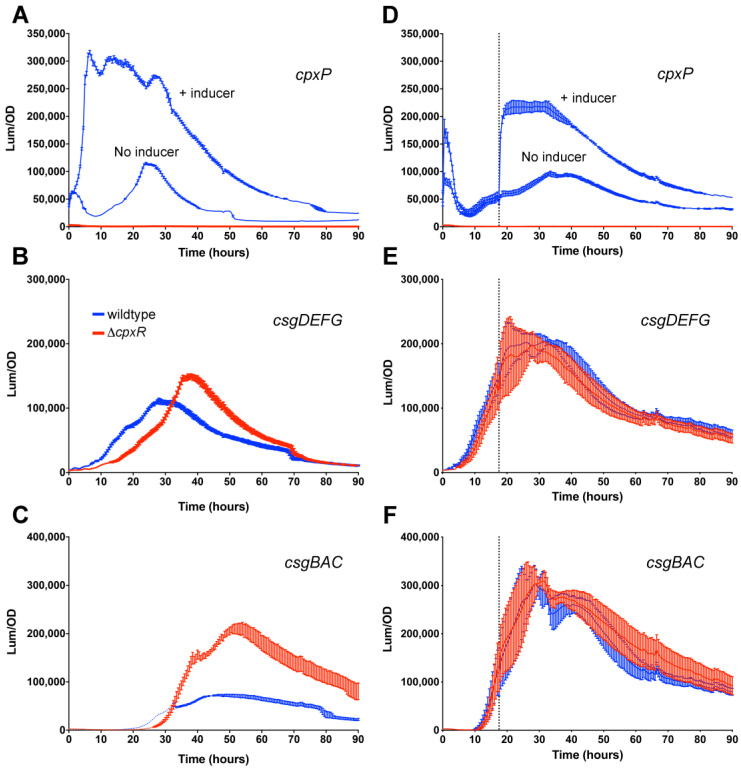
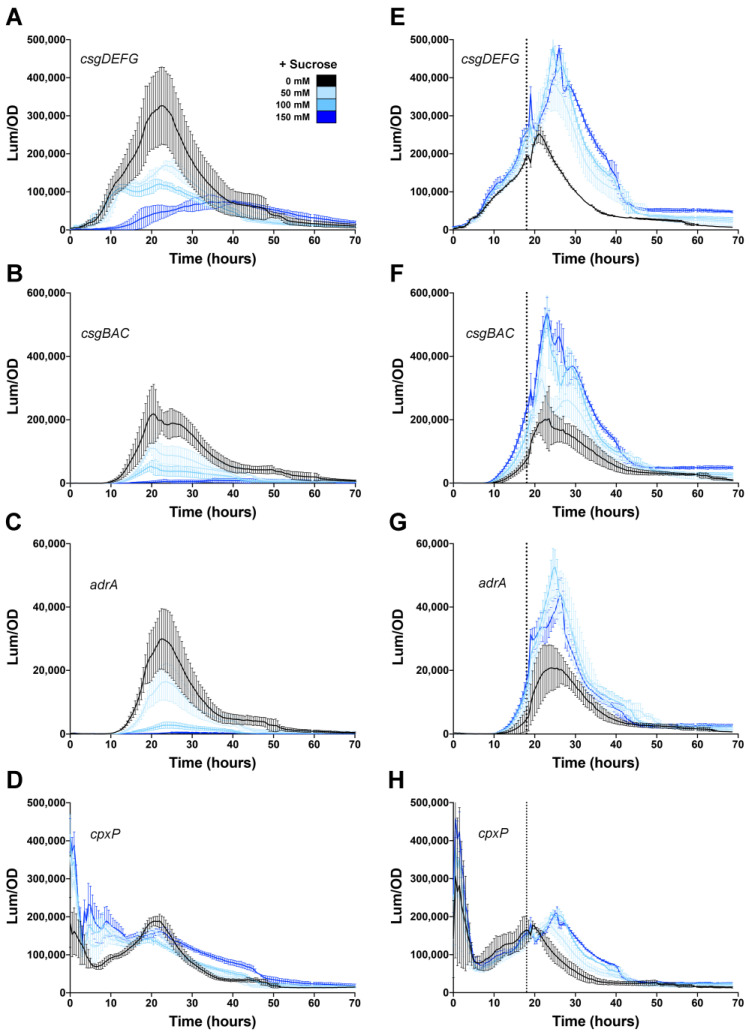
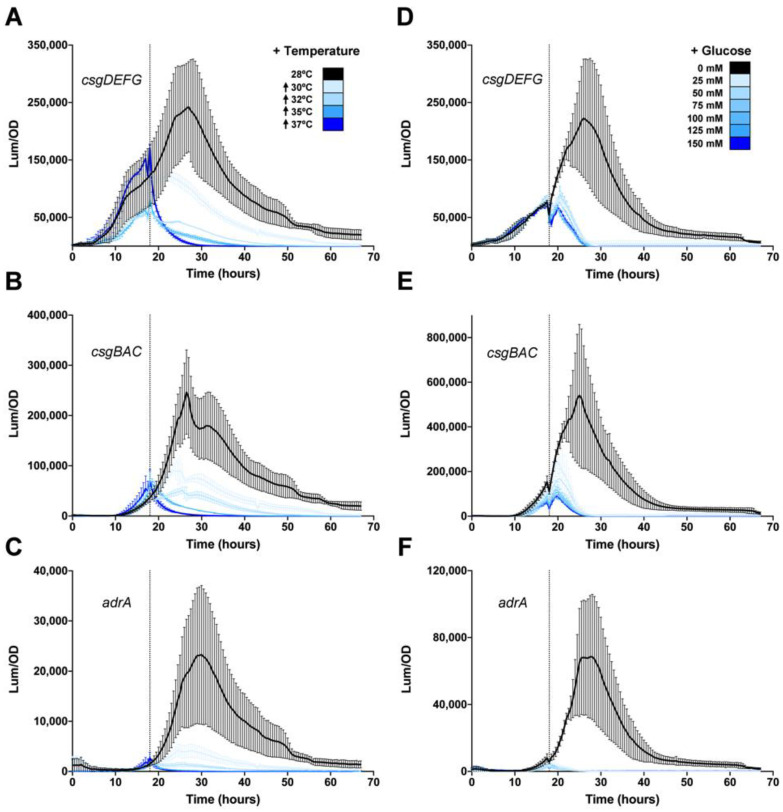
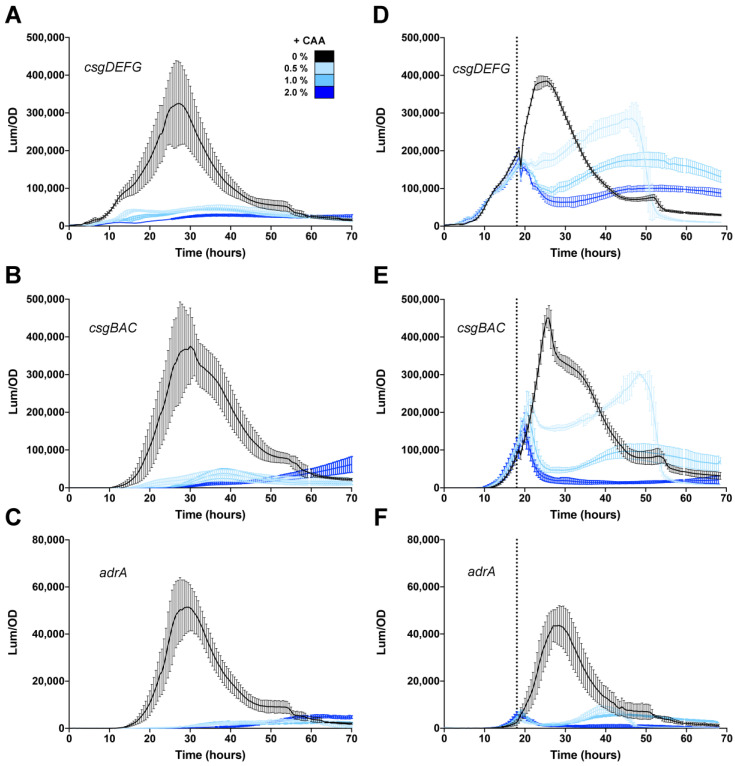
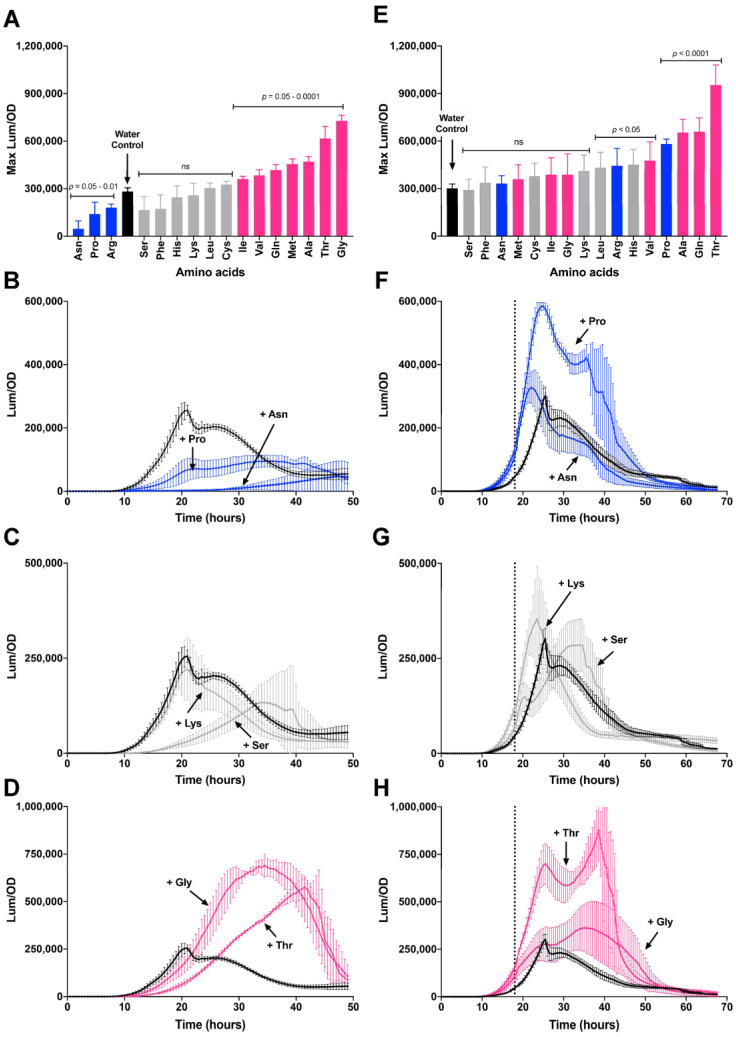
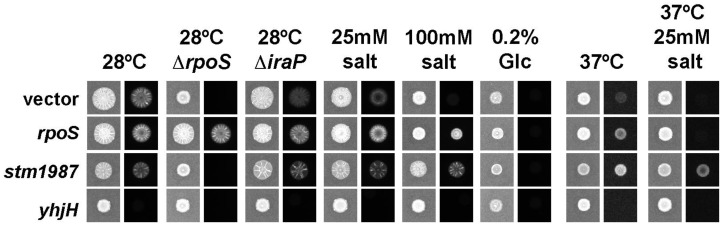
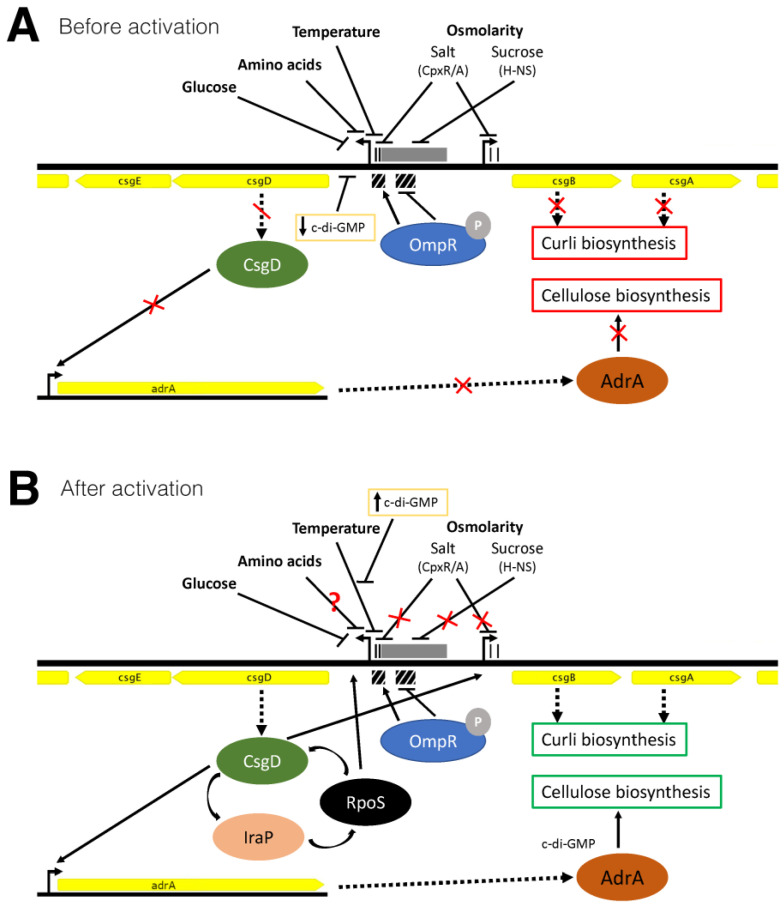
Among human food-borne pathogens, gastroenteritis-causing Salmonella strains have the most real-world impact. Like all pathogens, their success relies on efficient transmission. Biofilm formation, a specialized physiology characterized by multicellular aggregation and persistence, is proposed to play an important role in the Salmonella transmission cycle. In this manuscript, we used luciferase reporters to examine the expression of csgD, which encodes the master biofilm regulator. We observed that the CsgD-regulated biofilm system responds differently to regulatory inputs once it is activated. Notably, the CsgD system became unresponsive to repression by Cpx and H-NS in high osmolarity conditions and less responsive to the addition of amino acids. Temperature-mediated regulation of csgD on agar was altered by intracellular levels of RpoS and cyclic-di-GMP. In contrast, the addition of glucose repressed CsgD biofilms seemingly independent of other signals. Understanding the fine-tuned regulation of csgD can help us to piece together how regulation occurs in natural environments, knowing that all Salmonella strains face strong selection pressures both within and outside their hosts. Ultimately, we can use this information to better control Salmonella and develop strategies to break the transmission cycle.

Keywords: CpxR; CsgD; Salmonella; biofilm; cellulose; curli.


Conflict of interest statement

The authors declare no conflict of interest.

Figures

Figure 1
Figure 1
Response of the Salmonella csgD regulatory network to changes in osmolarity. csgDEFG (A,E), csgBAC (B,F), adrA (C,G), and cpxP (D,H) expression was measured in S. typhimurium 14028 during growth at 28 °C in media premixed with 25, 50, 75, 100, 125 or 150 mM salt (A–D) or with 50, 100, or 150 mM salt added during growth (E–H; vertical line shows the time of addition at 18 h). For each graph, luminescence (light counts per second) divided by the optical density at 600 nm (Lum/OD) was plotted as a function of time with each curve representing a single growth condition. The mean and standard deviations are plotted from experiments performed in triplicate (AC, EH) or from a single representative experiment (D).
Figure 2
Figure 2
The Cpx system has no repressive effect on csgD transcription once the biofilm network is activated. Expression of cpxP (A,D), csgDEFG (B,E), and csgBAC (C,F) operons was measured during growth of S. typhimurium 14028 wild-type (blue) or ΔcpxR strains (red) at 28 °C in media supplemented with 1.0 mM CuCl2 (+ inducer) added at the beginning of growth (AC) or added after 18 h of growth (DF; the vertical, dotted line represents the time of addition). For each graph, luminescence divided by the optical density at 600 nm (Lum/OD) was plotted as a function of time and each curve represents a single growth condition. The mean and standard deviations are plotted from three biological replicate experiments measured in triplicate.
Figure 3
Figure 3
Effect of sucrose addition on the Salmonella csgD regulatory network. Expression of csgDEFG (A,E), csgBAC (B,F), adrA (C,G), and cpxP (D,H) operons was measured during growth of S. typhimurium 14028 at 28 °C in media premixed with 50, 100 or 150 mM sucrose (AD) or with sucrose added during growth (EH; vertical line represents the time of addition at 18 h). For each graph, luminescence (light counts per second) divided by the optical density at 600 nm (Lum/OD) is plotted as a function of time and each curve represents a single growth condition. The mean and standard deviations are plotted from three biological replicate experiments measured in triplicate.
Figure 4
Figure 4
The csgD biofilm network in Salmonella is repressed by the addition of glucose or an increase in growth temperature. Expression of csgDEFG (A,D), csgBAC (B,E), and adrA (C,F) was measured during growth of S. typhimurium 14028 at 28 °C for 18 h prior to temperature shift (AC) or the addition of 25, 50, 75, 100, 125, or 150 mM glucose (DF). The vertical dotted line represents the time of temperature shift or glucose addition. For each graph, luminescence divided by the optical density at 600 nm (Lum/OD) is plotted as a function of time and each curve represents a single growth condition. The mean and standard deviations are plotted from three biological replicate experiments measured in triplicate.
Figure 5
Figure 5
The csgD biofilm regulatory network in Salmonella is repressed by the addition of amino acids. Expression of csgDEFG (A,D), csgBAC (B,E), and adrA (C,F) was measured during growth of S. typhimurium 14028 at 28 °C in media premixed with 0.5%, 1.0% or 2.0% casamino acids (AC) or in media where casamino acids were added during growth (D, E, F; the dotted line represents the time of addition at 18 h). For each graph, luminescence (light counts per second) divided by the optical density at 600 nm (Lum/OD) is plotted as a function of time and each curve represents a single growth condition. The mean and standard deviations are plotted from three biological replicate experiments measured in triplicate.
Figure 6
Figure 6
Individual amino acids have differing effects on the csgD biofilm regulatory network in S. typhimurium 14028. Maximum expression of the csgBAC operon (curli production) was recorded during growth of S. typhimurium 14028 at 28 °C in media premixed with 15 mM of individual amino acids (A) or in media where the amino acids were added after 18 h of growth. The maximum Lum/OD values after addition of each amino acid were statistically compared to a water control and amino acids were determined to have a repressive (blue), neutral (grey) or stimulatory effect (purple) on csgB expression (A). This color scheme was used to represent the same amino acids when they were added after 18 h of growth (E). Lum/OD values were plotted as a function of time corresponding to selected amino acids premixed into the media (BD) or added at 18 h of growth (FH; the dotted line represents the time of addition). For each curve, the mean and standard deviations are plotted from three biological replicate experiments measured in triplicate.
Figure 7
Figure 7
Visualization of S. typhimurium curli expression in response to changing growth conditions. S. typhimurium 14028 wild-type, ΔrpoS or ΔiraP reporter strains containing a csgBAC promoter–luciferase fusion were transformed with pBR322 (vector), pACYC/rpos (rpoS), pBR322/stm1987 (stm1987) or pBR322/yhjH (yhjH) plasmids. Cells were inoculated onto T agar or T agar supplemented with 0.2% glucose, 25 mM or 100 mM NaCl and grown at 28 °C or 37ºC. Colony morphology (left column) and luminescence (right column) was recorded after 48 h growth. Control strains containing pACYC were also tested, but the csgBAC expression profiles were similar to strains transformed with pBR322; therefore, only the pBR322 pictures are shown.
Figure 8
Figure 8
Graphical illustration of the CsgD regulatory principles identified in this manuscript. The divergent csg operons are shown (without csgFG and csgC) with the intergenic region highlighted by transcription factor binding sites that have been experimentally verified in Salmonella (CpxR—black bars; H-NS—grey box; OmpR—hatched boxes). Phosphorylated OmpR binds the proximal, high affinity site under conditions of low osmolarity, which activates csgD transcription, and binds the distal, low affinity sites under conditions of high osmolarity, which represses csgD transcription [38]. The different regulatory elements that we have tested are shown: glucose; amino acids; growth temperature; and osmolarity, with sodium chloride, which is known to act via the CpxR/A system [37], and sucrose, which is known to act via H-NS [36]. The adrA gene encodes a diguanylate cyclase, which produces cyclic-di-GMP and allosterically activates cellulose production. (A) Glucose (>25 mM), amino acids (>0.5% casamino acids), temperature (>32 °C), salt and sucrose (>25 mM) caused a reduction in csgD transcription and blocked transcription of csgBAC and adrA, preventing curli and cellulose biosynthesis. The effect of reduced c-di-GMP was tested by overexpression of the YhjH phosphodiesterase. The addition of individual amino acids was variable, with three leading to reduced csgD transcription (Asn, Pro, Arg), and seven leading to increased csgD transcription (Ile, Val, Gln, Met, Ala, Thr, Gly). (B) When the same regulatory components were tested after 18 h of growth, the effects were different. We assume that by this time point, the CsgD-IraP-RpoS feed-forward loop [35] is activated, although deletion of iraP in our experiments had little effect. The addition of salt and sucrose had no effect on csgD transcription, and casamino acids were not as repressive. The effect of increased c-di-GMP was tested by overexpression of the diguanylate cyclase STM1987, which was able to relieve temperature-based repression of csgD transcription. The response to individual amino acids was again variable, however, none caused a reduction in csgD transcription and eight were stimulatory (Leu, Arg, His, Val, Pro, Ala, Gln, Thr). The question mark signifies that we do not fully understand the regulatory effects of individual amino acids.

References

    1. Kirk M.D., Pires S.M., Black R.E., Caipo M., Crump J.A., Devleesschauwer B., Döpfer D., Fazil A., Fischer-Walker C.L., Hald T., et al. Correction: World Health Organization Estimates of the Global and Regional Disease Burden of 22 Foodborne Bacterial, Protozoal, and Viral Diseases, 2010: A Data Synthesis. PloS Med. 2015;12:e1001940. doi: 10.1371/journal.pmed.1001940. - DOI - PMC - PubMed
    1. Majowicz S.E., Musto J., Scallan E., Angulo F.J., Kirk M., O’Brien S.J., Jones T.F., Fazil A., Hoekstra R.M., The International Collaboration on Enteric Disease “Burden of Illness” Studies The Global Burden of Nontyphoidal Salmonella Gastroenteritis. Clin. Infect. Dis. 2010;50:882–889. doi: 10.1086/650733. - DOI - PubMed
    1. Buckle G.C., Walker C.L.F., Black R.E. Typhoid fever and paratyphoid fever: Systematic review to estimate global morbidity and mortality for 2010. J. Glob. Health. 2012;2:010401. doi: 10.7189/jogh.01.010401. - DOI - PMC - PubMed
    1. McClelland M., Sanderson K.E., Clifton S.W., Latreille P., Porwollik S., Sabo A., Meyer R., Bieri T., Ozersky P., McLellan M., et al. Comparison of genome degradation in Paratyphi A and Typhi, human-restricted serovars of Salmonella enterica that cause typhoid. Nat. Genet. 2004;36:1268–1274. doi: 10.1038/ng1470. - DOI - PubMed
    1. Gal-Mor O., Boyle E.C., Grassl G.A. Same species, different diseases: How and why typhoidal and non-typhoidal Salmonella enterica serovars differ. Front. Microbiol. 2014;5:391. doi: 10.3389/fmicb.2014.00391. - DOI - PMC - PubMed

LinkOut - more resources