. 2020 Jun 27;21(13):4570.
doi: 10.3390/ijms21134570.

Quantitative Ultrastructural Morphometry and Gene Expression of mTOR-Related Mitochondriogenesis within Glioblastoma Cells

Affiliations

Quantitative Ultrastructural Morphometry and Gene Expression of mTOR-Related Mitochondriogenesis within Glioblastoma Cells

Rosangela Ferese et al. Int J Mol Sci. .

Abstract

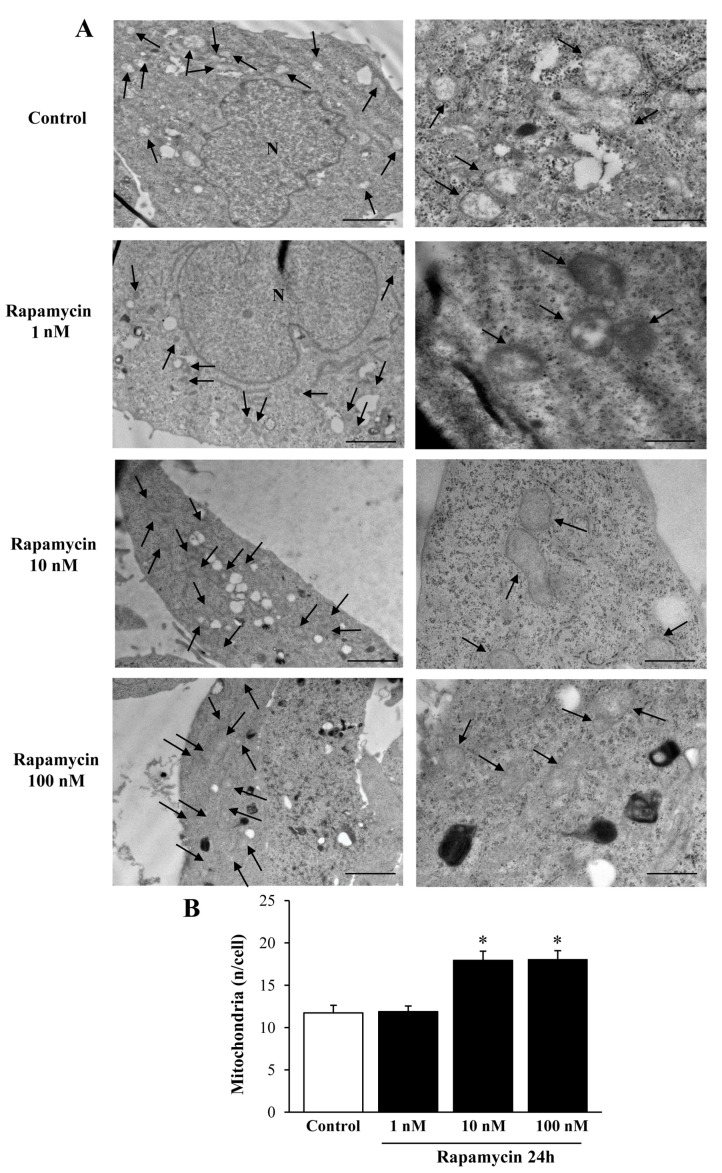
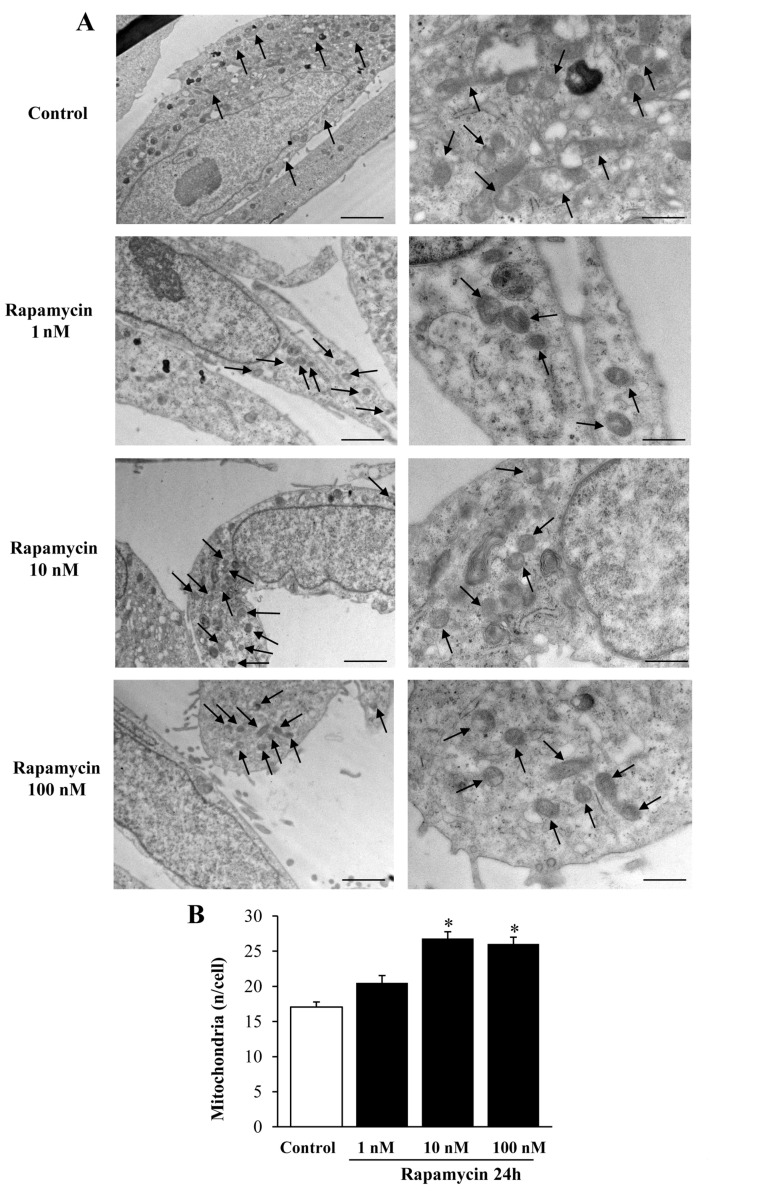
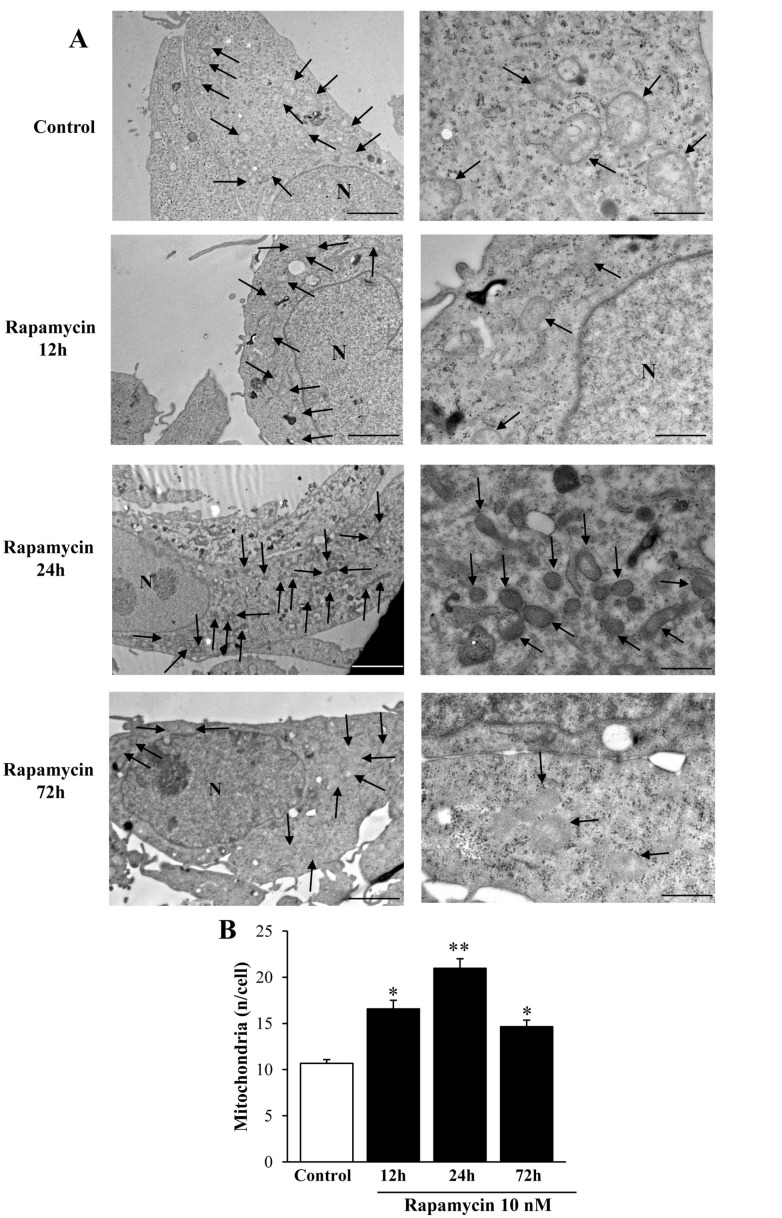
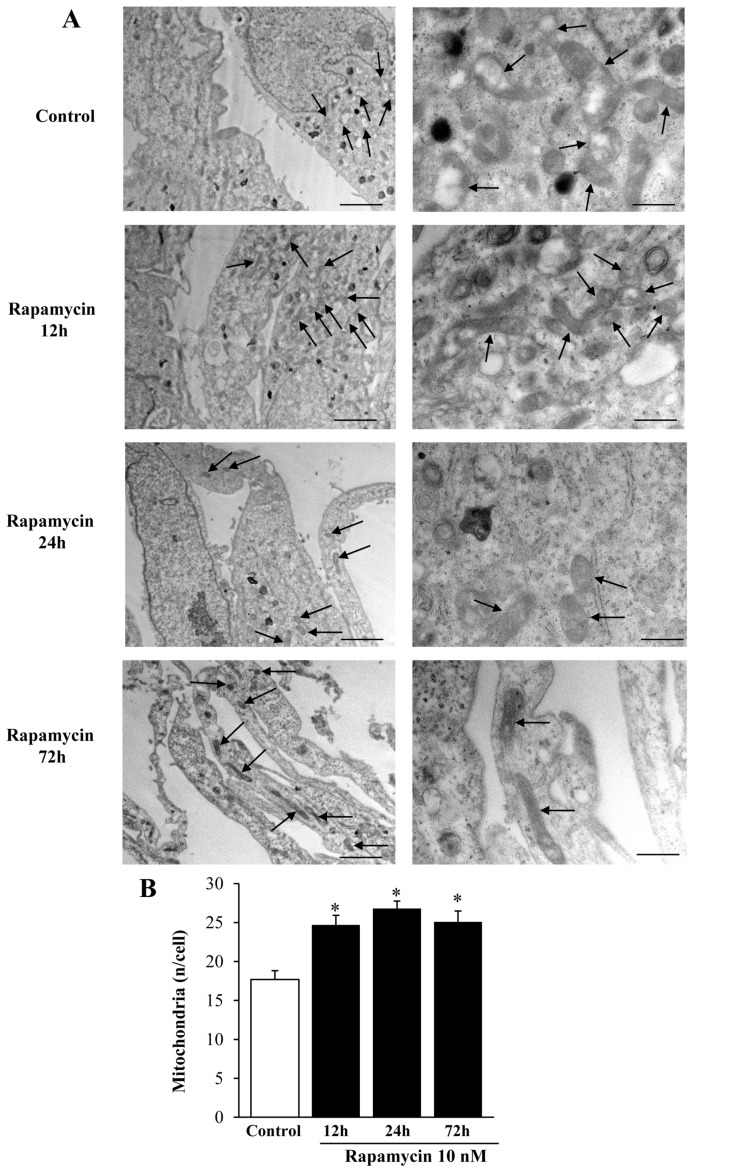
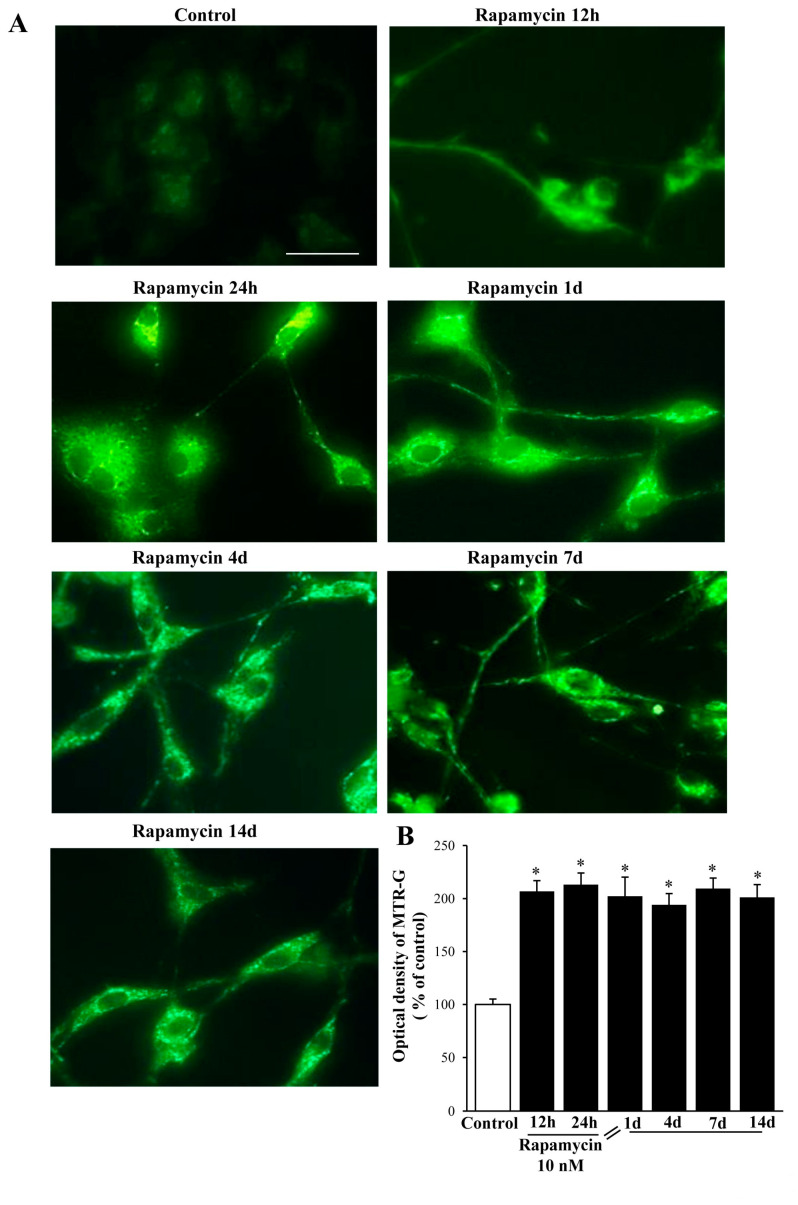
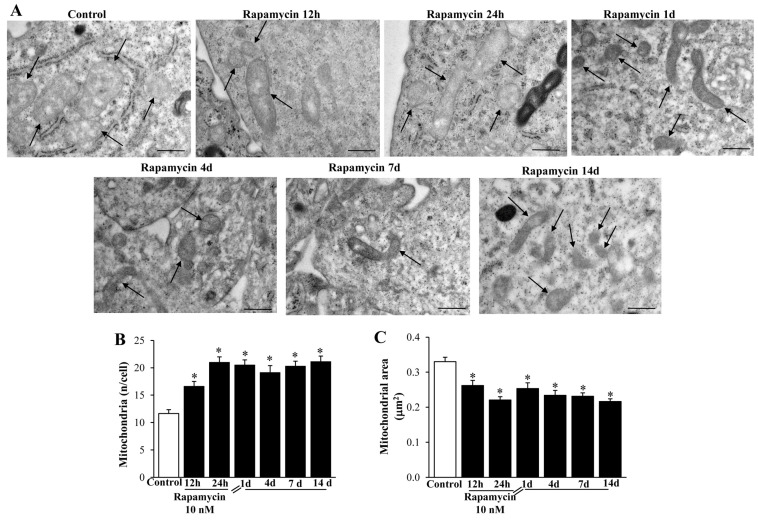
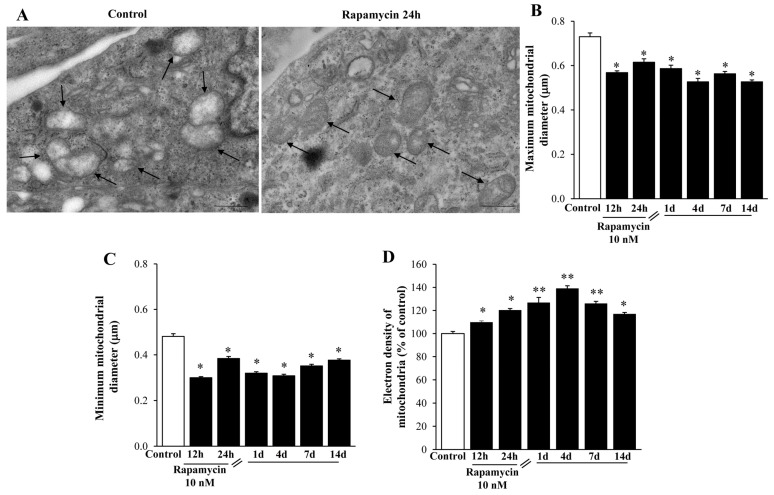
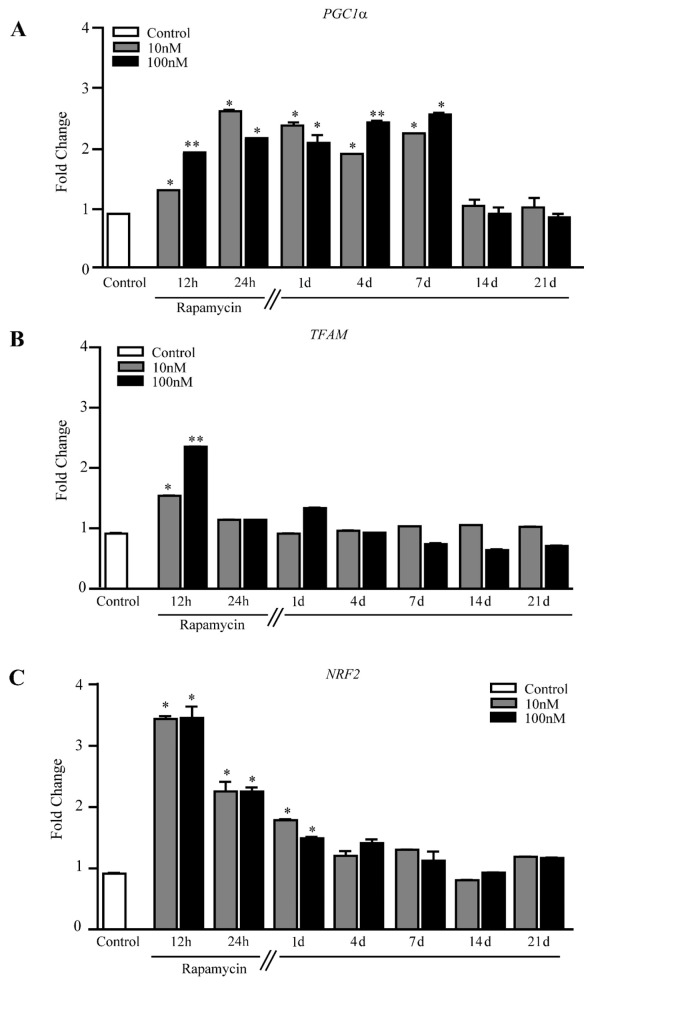
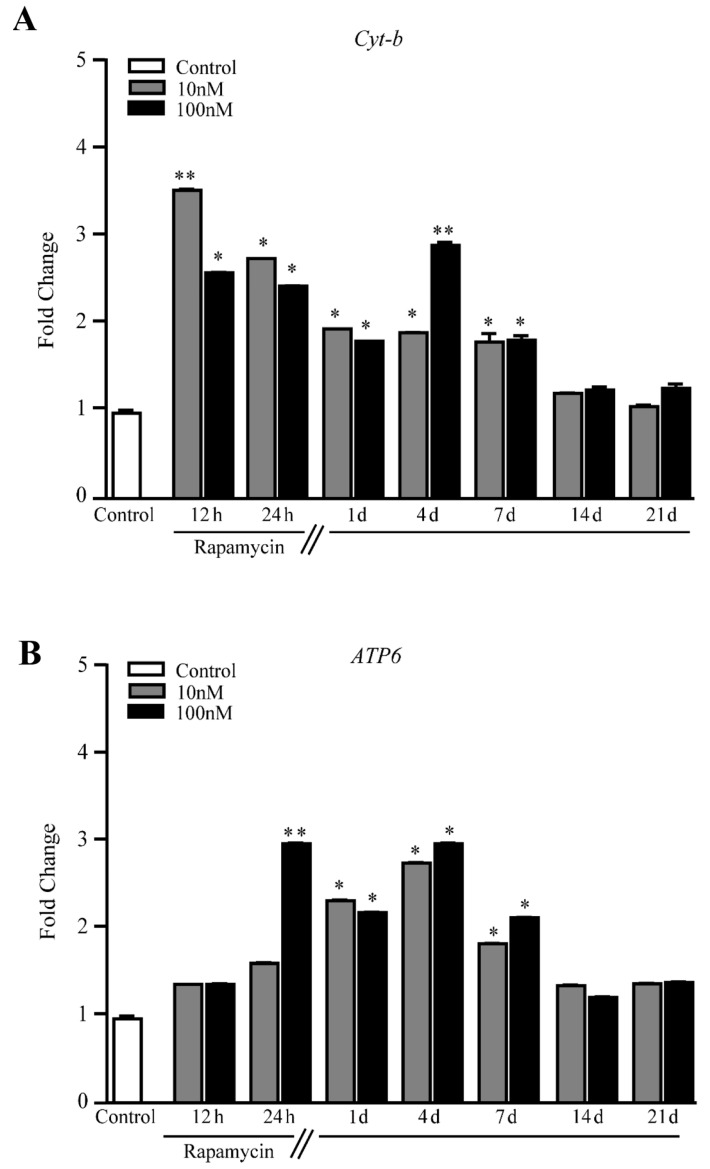
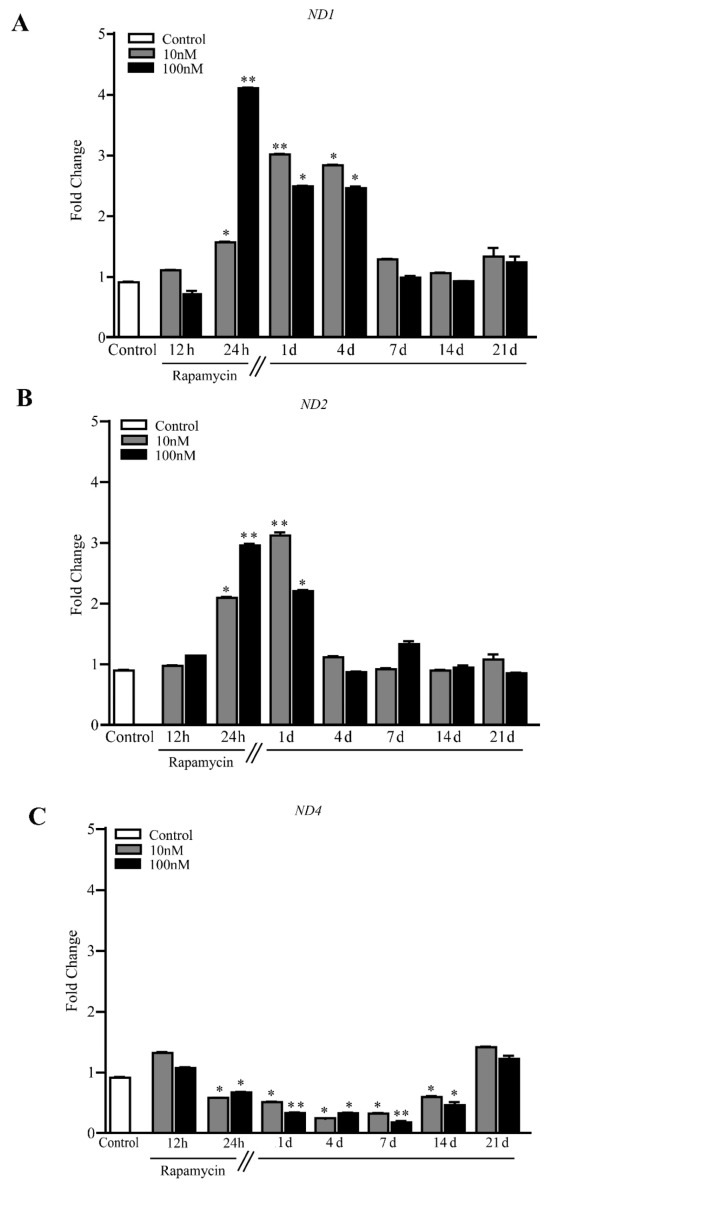
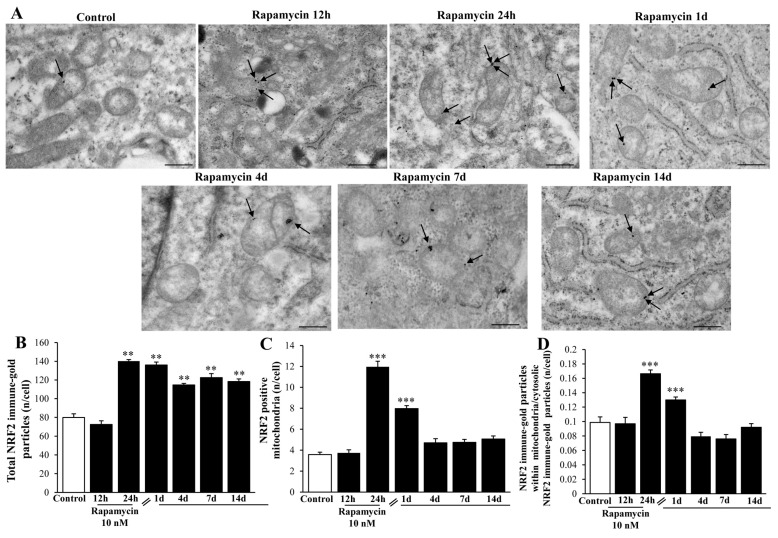
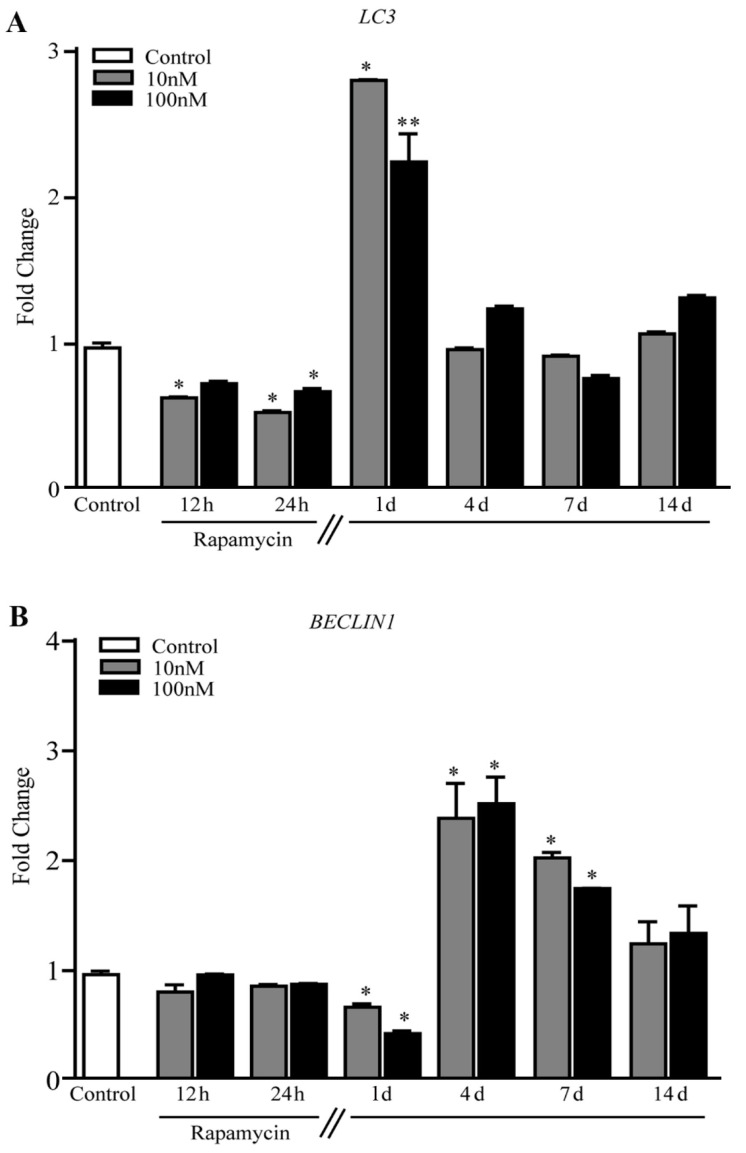
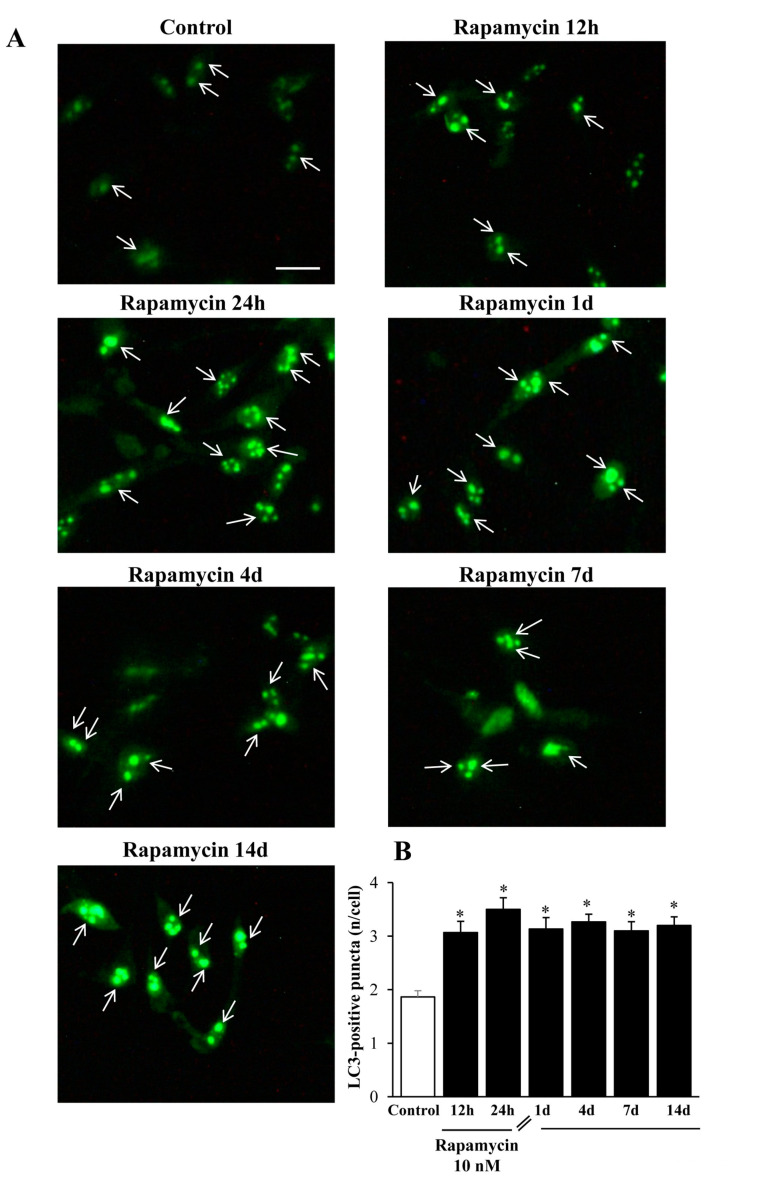
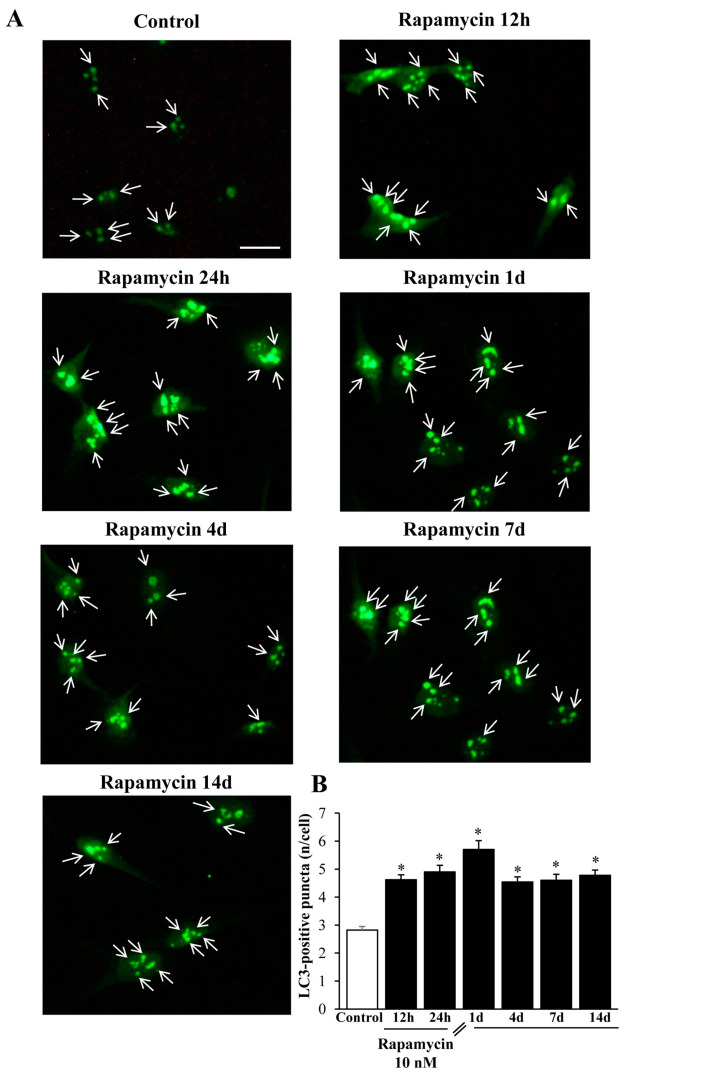
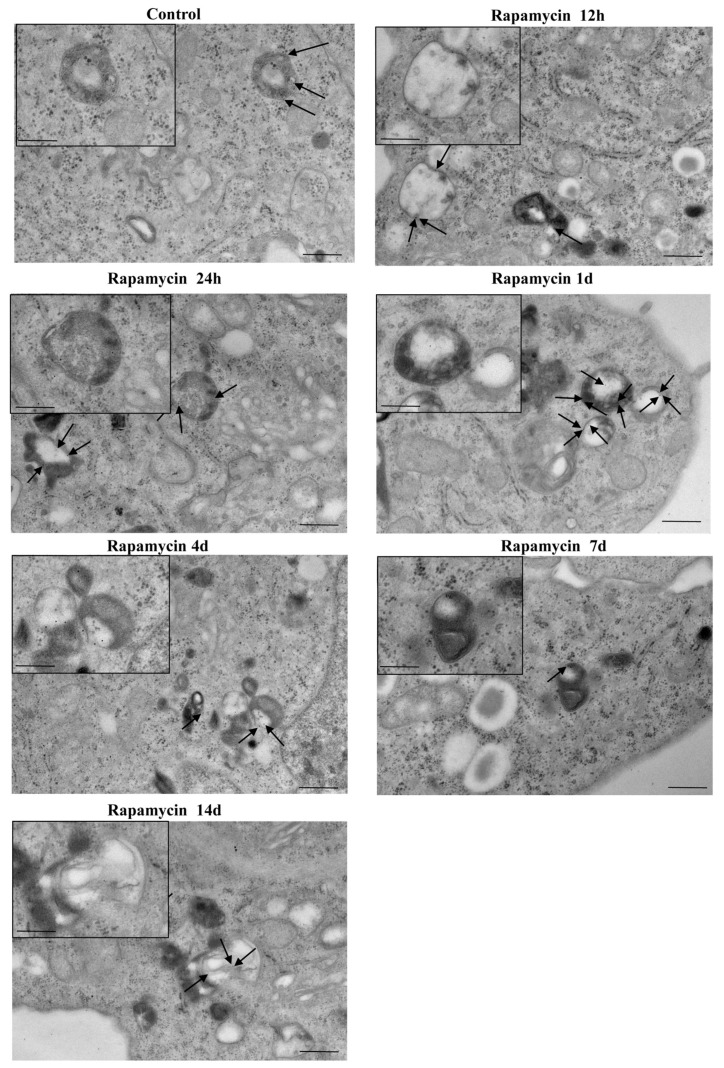
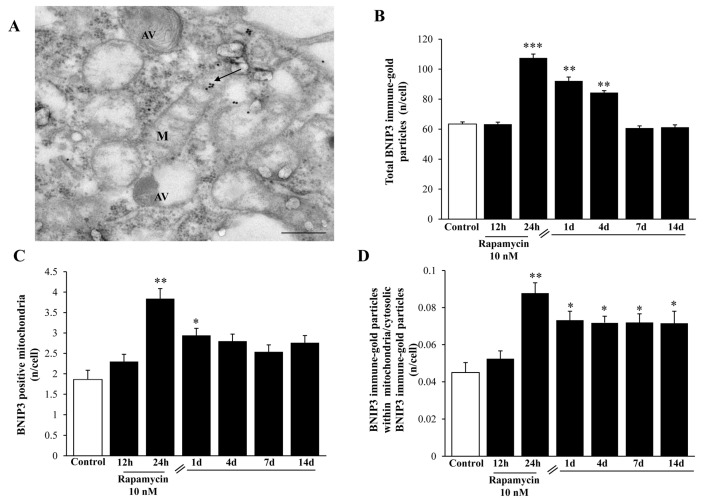
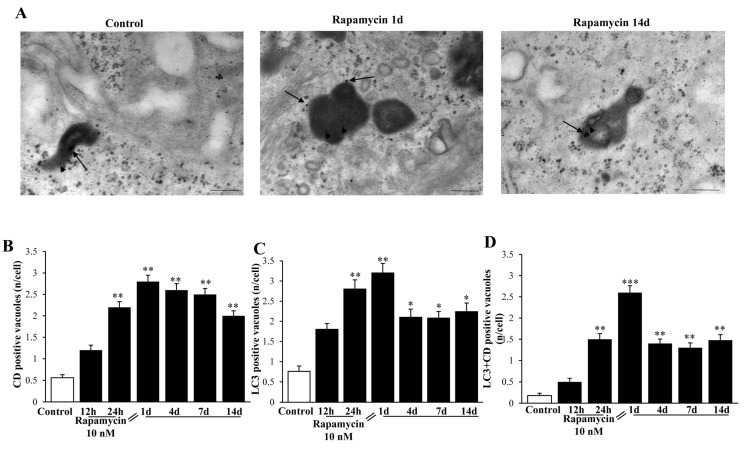
In glioblastoma (GBM) cells, an impairment of mitochondrial activity along with autophagy suppression occurs. Autophagy suppression in GBM promotes stemness, invasion, and poor prognosis. The autophagy deficit seems to be due, at least in part, to an abnormal up-regulation of the mammalian target of rapamycin (mTOR), which may be counteracted by pharmacological mTORC1 inhibition. Since autophagy activation is tightly bound to increased mitochondriogenesis, a defect in the synthesis of novel mitochondria is expected to occur in GBM cells. In an effort to measure a baseline deficit in mitochondria and promote mitochondriogenesis, the present study used two different GBM cell lines, both featuring mTOR hyperactivity. mTORC1 inhibition increases the expression of genes and proteins related to autophagy, mitophagy, and mitochondriogenesis. Autophagy activation was counted by RT-PCR of autophagy genes, LC3- immune-fluorescent puncta and immune-gold, as well as specific mitophagy-dependent BNIP3 stoichiometric increase in situ, within mitochondria. The activation of autophagy-related molecules and organelles after rapamycin exposure occurs concomitantly with progression of autophagosomes towards lysosomes. Remarkably, mitochondrial biogenesis and plasticity (increased mitochondrial number, integrity, and density as well as decreased mitochondrial area) was long- lasting for weeks following rapamycin withdrawal.

Keywords: NRF2; PGC1; autophagy; lysosomes; mitochondrial DNA; mitochondrial biogenesis; mitochondrial constitutive genes; mitophagy; rapamycin.


Conflict of interest statement

The authors declare no conflict of interest.

Figures

Figure 1
Figure 1
Rapamycin dose-dependently increases mitochondrial number in U87MG cell line. (A) Representative TEM micrographs showing mitochondria (indicated by black arrows) from Control and from different doses of rapamycin. (B) Graph reports the number of mitochondria per cell. Values are the mean ± S.E.M. from 50 cells per group. ∗ p ≤ 0.05 vs. Control and 1 nM rapamycin; Scale bars = 1 μm (low magnification) and 0.56 μm (high magnification).
Figure 2
Figure 2
Rapamycin dose-dependently increases mitochondrial number in A172 cell line. (A) Representative TEM micrographs showing mitochondria (indicated by black arrows) from Control and from different doses of rapamycin. A more differentiated cell phenotype is evident in Control cells when compared to U87MG cells shown in Figure 1. (B) Graph reports the number of mitochondria per cell. Values are the mean ± S.E.M. from 30 cells per group. ∗ p ≤ 0.05 vs. Control and 1 nM rapamycin. Scale bars = 1 μm (low magnification) and 0.4 μm (high magnification).
Figure 3
Figure 3
Rapamycin time-dependently increases mitochondrial number in U87MG cell line. (A) Representative TEM micrographs showing mitochondria (indicated by black arrows) from Control and from different time of continuous rapamycin 10 nM exposure. (B) Graph reports the number of mitochondria per cell. Values are the mean ± S.E.M. from 50 cells per group. ∗ p ≤ 0.05 vs. Control; ** p ≤ 0.05 vs. other groups. Scale bars = 1 μm (low magnification) and 0.56 μm (high magnification).
Figure 4
Figure 4
Rapamycin time-dependently increases mitochondrial number in A172 cell line. (A) Representative TEM micrographs showing mitochondria (indicated by black arrows) from Control and from different time of continuous rapamycin 10 nM exposure. (B) Graph reports the number of mitochondria per cell. Values are the mean ± S.E.M. from 30 cells per group. ∗ p ≤ 0.05 vs. Control. Scale bars = 1 μm (low magnification) and 0.45 μm (high magnification).
Figure 5
Figure 5
Overview of the experimental design. Rapamycin was administered continuously for 12 h or 24 h to the cell cultures; then, it was withdrawn for 24 h up to 14 d. Thus, the first time interval of rapamycin withdrawal (24 h) is indicated as 1 d and it corresponds to rapamycin administration for 24 h followed by 24 h of withdrawal. All later time intervals are reported considering the days the rapamycin withdrawal time lasted.
Figure 6
Figure 6
Rapamycin increases MitoTraker-Green (MTR-G) in U87MG cell line. (A) Representative fluorescent microscopy of U87MG cells stained with 250 nM of the mitochondrial MTR-G dye (green). (B) Graph reports fluorescence at different time intervals. Values are the mean percentage ± S.E.M. from 50 cells per group. * p ≤ 0.05 vs. Control. Scale bar = 25 μm.
Figure 7
Figure 7
Rapamycin modifies mitochondrial number, area, and phenotype within U87MG cells. (A) Representative TEM micrographs showing mitochondria (indicated by black arrows) at different time intervals (from 1 d up to 14 d) following 10 nM rapamycin. The graph (B) reports the number of mitochondria, which steadily increased at each time interval following rapamycin administration. Graph (C) measures the mitochondrial area, which steadily decreased following rapamycin. This indicates that rapamycin produces an augmentation in the number of mitochondria, which feature a much smaller size. Values are the mean ±S.E.M. from 50 cells per group, while mitochondrial area was calculated from 100 mitochondria per group. * p ≤ 0.05 vs. Control. Scale bar = 0.56 μm.
Figure 8
Figure 8
Rapamycin re-shapes mitochondria within U87MG cells at different time intervals. (A) Representative TEM micrographs showing mitochondria (arrows) from Control and following 10 nM rapamycin at 24 h. Graphs (B,C,D) confirm that reported in Figure 7 after rapamycin withdrawal from 1 d up 14 d. In fact, both the maximum (B) and minimum (C) mitochondrial diameter were decreased, whereas the mitochondrial electron density (D), which is expressed as a percentage of mitochondrial electron-density measured from Control, was increased. Values were obtained from 100 or 250 mitochondria per group. * p ≤ 0.05 vs. Control; ** p ≤ 0 05 vs. Control and 12 h. Scale bar = 0.56 μm.
Figure 9
Figure 9
Rapamycin increases mitochondriogenesis-related genes within U87MG cells. RT-PCR for (A) PGC1α, (B) TFAM, and (C) NRF2. * p ≤ 0.05 vs. Control; ** p ≤ 0.05 vs. Control and 10 nM rapamycin. Each RT-PCR was performed in triplicate and confirmed in two independent experiments using both beta-globin and beta-actin as internal references.
Figure 10
Figure 10
Rapamycin increases mRNA levels for constitutive mitochondrial genes within U87MG cells. RT PCR for (A) Cyt-b, and (B) ATP6. * p ≤ 0.05 vs. Control. The effects of rapamycin persist up to 7 d of rapamycin withdrawal. ** p ≤ 0.05 vs. Control and 10 nM rapamycin. Each RT-PCR was performed in triplicate and confirmed in two independent experiments using both beta-globin and beta-actin as internal references.
Figure 11
Figure 11
Rapamycin increases mRNA levels for ND1 and ND2 while decreasing ND4 within U87MG cells. RT-PCR for (A) ND1, (B) ND2 and (C) ND4. * p ≤ 0.05 vs. Control. ** p ≤ 0.05 vs. Control and 10 nM rapamycin. Each RT-PCR was performed in triplicate and confirmed in two independent experiments using both beta-globin and beta-actin as internal references.
Figure 12
Figure 12
Rapamycin increases the amount of NRF2 immune-gold within U87MG cells. (A) Representative TEM micrographs showing NRF2 immune-gold particles (indicated by black arrows) within mitochondria from U87MG cells at different time intervals following rapamycin withdrawal. Graphs report the amount of NRF2 particles per cell (B), NRF2-positive mitochondria (C), and the ratio of mitochondrial/cytosolic NRF2 particles (D). Values were obtained from 50 cells per group. ** p ≤ 0.05 vs. Control and 12 h, *** p ≤ 0.05 vs. other groups. Scale bar = 0.8 μm.
Figure 13
Figure 13
Rapamycin increases the expression of autophagy related genes in U87MG cells. (A) RT-PCR for LC3, and (B) RT-PCR for BECLIN1. * p ≤ 0.05 vs. Control. ** p ≤ 0.05 vs. Control and 10 nM rapamycin. Each RT-PCR was performed in triplicate and confirmed in two independent experiments using both beta-globin and beta-actin as internal references.
Figure 14
Figure 14
Rapamycin increases the immunofluorescence of LC3 within U87MG cells. (A) Representative immunofluorescence from U87MG cells. White arrows point to LC3 puncta (green). (B) Graph reports the number of LC3 puncta per cell. Values were obtained from 100 cells per group. * p ≤ 0.05 vs. Control. Scale bar: 20 μm.
Figure 15
Figure 15
Rapamycin increases the immunofluorescence of LC3 within A172 cells. (A) Representative immunofluorescence from A172 cells. While arrows point to LC3 puncta (green). (B) Graph reports the number of LC3 puncta per cell. Values were obtained from 100 cells per group. * p ≤ 0.05 vs. Control. Scale bar: 25 μm.
Figure 16
Figure 16
Representative pictures of rapamycin-induced LC3-stained and non-stained vacuoles within U87MG cells. The black box indicates high magnification inserts showing LC3-stained vacuoles. Black arrows point to LC3 immune-gold particles on vacuoles. Micrographs were obtained from 1 cell per group, for a total of 7 cells. Scale bar: 0.6 μm (low magnification); 0.20 μm (high magnification).
Figure 17
Figure 17
Rapamycin increases the amount of both LC3-stained and non-stained vacuoles within U87MG cells. LC3 immune-gold particles were increased by rapamycin within the cytosol (A) and vacuole compartments (B). The ratio of vacuolar/cytosolic LC3 was also increased by rapamycin (C), which also filled each LC3-positive vacuole with a higher stoichiometric density of LC3 proteins (D). Rapamycin increases the vacuolar compartment also considering those vacuoles which do not stain for LC3 (E). Values were obtained from 50 cells per group. * p ≤ 0.05 vs. Control; ** p ≤ 0.05 vs. Control and 12 h rapamycin; *** p ≤ 0.05 vs. all other groups.
Figure 18
Figure 18
Rapamycin increases the mitophagy marker BNIP3 at short-time intervals within U87MG cells. (A) Representative BNIP3-stained mitochondrion (indicated by the black arrow) at 24 h during 10 nM rapamycin, continuous exposure. Graphs report: (B) the amount of total BNIP3 particles; (C) the number of BNIP3-positive mitochondria; (D) the ratio of mitochondrial/cytosolic BNIP3 particles at various time interval during (12–24 h) or following (from 1 d up to 14 d) rapamycin exposure. M = mitochondrion, AV = vacuoles. * p ≤ 0.05 vs. Control; ** p ≤ 0.05 vs. Control and 12 h; *** p ≤ 0 05 vs. other groups. Scale bar = 0.3 μm.
Figure 19
Figure 19
Rapamycin increases LC3+Cathepsin-D co-immune-stained vacuoles within U87MG cells. (A) Representative TEM micrographs show LC3+Cathepsin-D co-immune-stained vacuoles within Control cells and following 1 d and 14 d of rapamycin withdrawal. Arrowheads and black arrows point to LC3 (10 nm) and Cathepsin-D (20 nm) immune-gold particles, respectively. Graphs report the time-course of rapamycin-induced increase in (B) Cathepsin-D (CD) only immune-gold stained vacuoles; (C) LC3 only immune-gold stained vacuoles; (D) LC3 + Cathepsin-D immune-gold double-stained vacuoles. Rapamycin increases each vacuole immune-gold staining compared with Control. However, the effects produced on double-stained vacuoles exceeded at large what measured for single staining, which indicates a rapamycin-dependent autophagy progression toward lysosome. * p ≤ 0.05 vs. Control; ** p ≤ 0.05 vs. Control and 12 h. Scale bar: 0.2 μm.

Similar articles

Cited by

References

    1. Jiang H., White E.J., Conrad C., Gomez-Manzano C., Fueyo J. Autophagy pathways in glioblastoma. Methods Enzymol. 2009;453:273–286. - PubMed
    1. Zhao Y., Huang Q., Yang J., Lou M., Wang A., Dong J., Qin Z., Zhang T. Autophagy impairment inhibits differentiation of glioma stem/progenitor cells. Brain Res. 2010;1313:250–258. doi: 10.1016/j.brainres.2009.12.004. - DOI - PubMed
    1. Huang X., Bai H.M., Chen L., Li B., Lu Y.C. Reduced expression of LC3B-II and Beclin 1 in glioblastoma multiforme indicates a down-regulated autophagic capacity that relates to the progression of astrocytic tumors. J. Clin. Neurosci. 2010;17:1515–1519. doi: 10.1016/j.jocn.2010.03.051. - DOI - PubMed
    1. Zhuang W., Li B., Long L., Chen L., Huang Q., Liang Z. Induction of autophagy promotes differentiation of glioma-initiating cells and their radiosensitivity. Int. J. Cancer. 2011;129:2720–2731. doi: 10.1002/ijc.25975. - DOI - PubMed
    1. Liu R., Li J., Zhang T., Zou L., Chen Y., Wang K., Lei Y., Yuan K., Li Y., Lan J., et al. Itraconazole suppresses the growth of glioblastoma through induction of autophagy: Involvement of abnormal cholesterol trafficking. Autophagy. 2014;10:1241–1255. doi: 10.4161/auto.28912. - DOI - PMC - PubMed

Substances