

Prediction of Static Modulus and Compressive Strength of Concrete from Dynamic Modulus Associated with Wave Velocity and Resonance Frequency Using Machine Learning Techniques
- PMID: 32605042
- PMCID: PMC7372401
- DOI: 10.3390/ma13132886
Prediction of Static Modulus and Compressive Strength of Concrete from Dynamic Modulus Associated with Wave Velocity and Resonance Frequency Using Machine Learning Techniques
Abstract
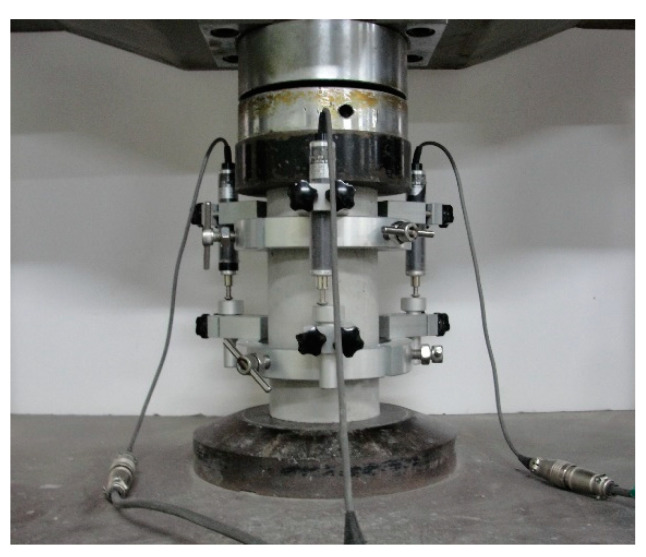
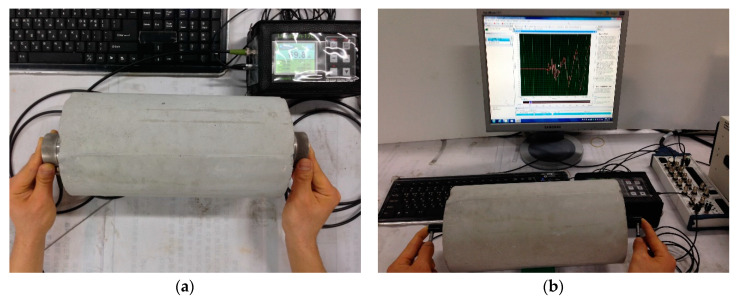
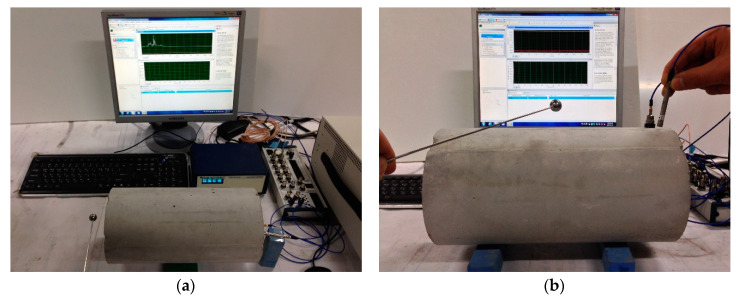
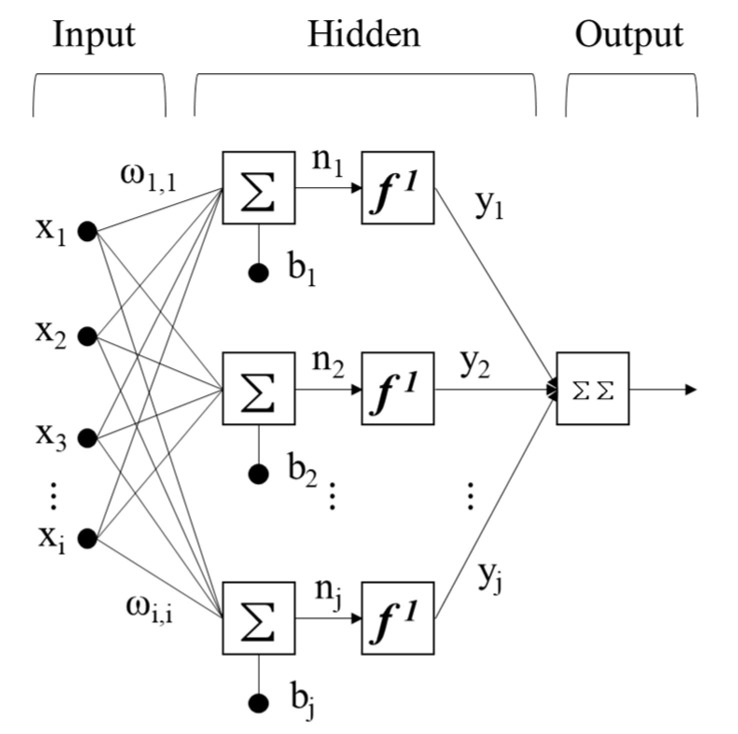
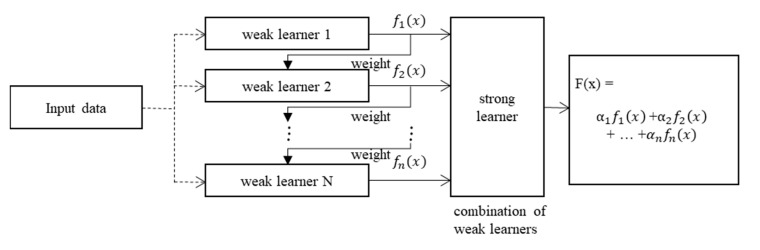
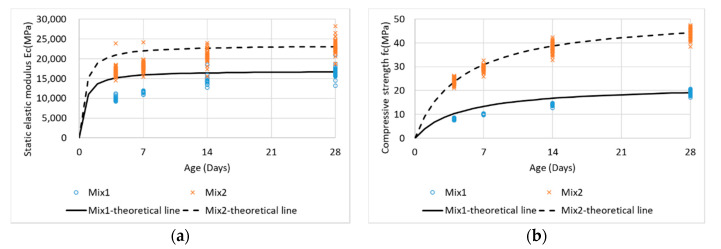
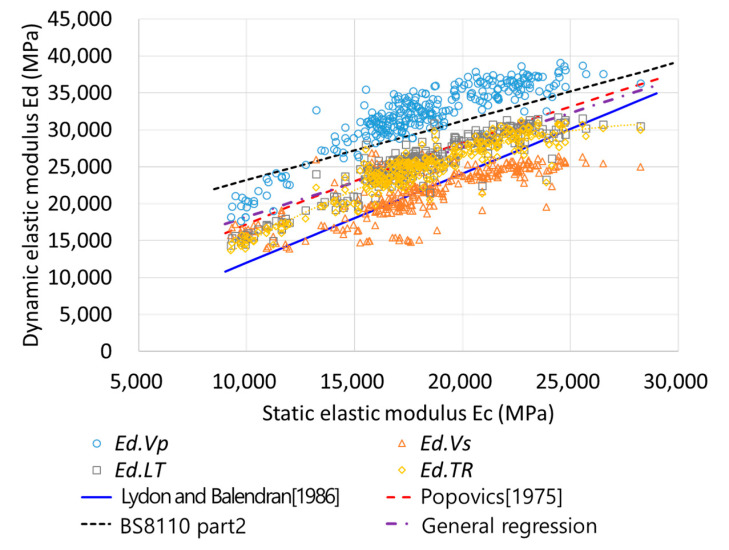
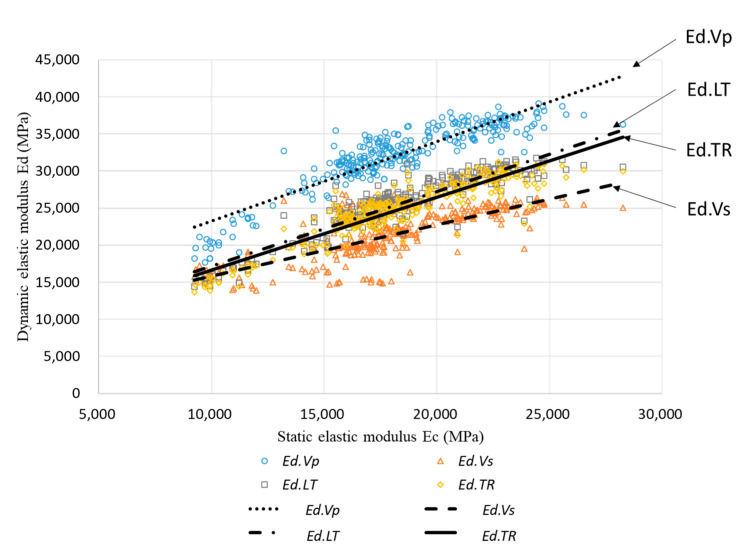
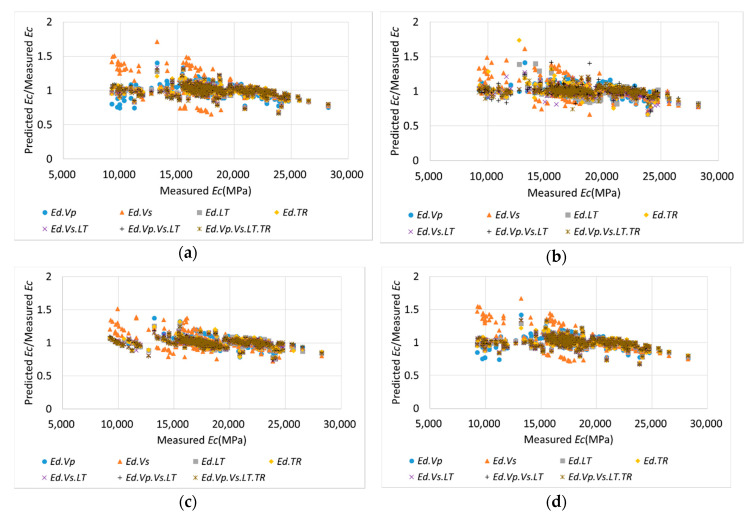
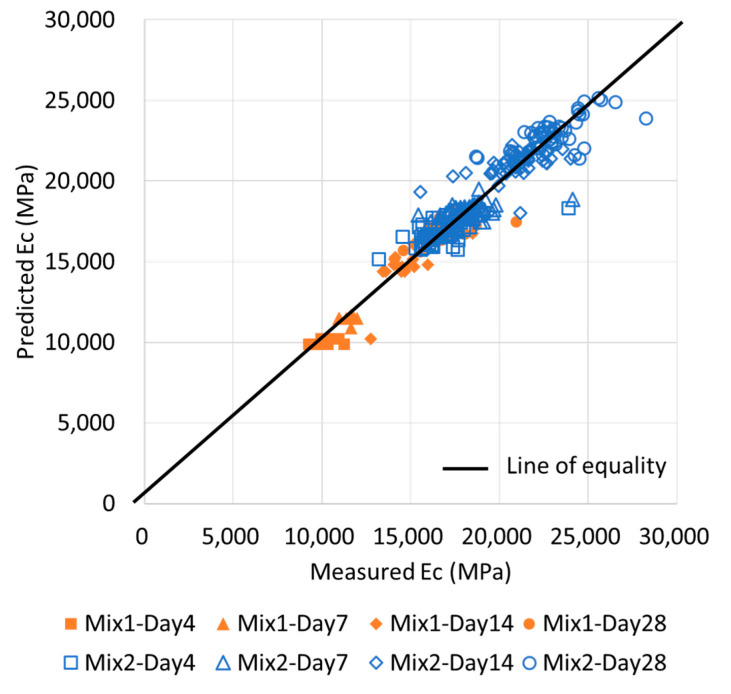
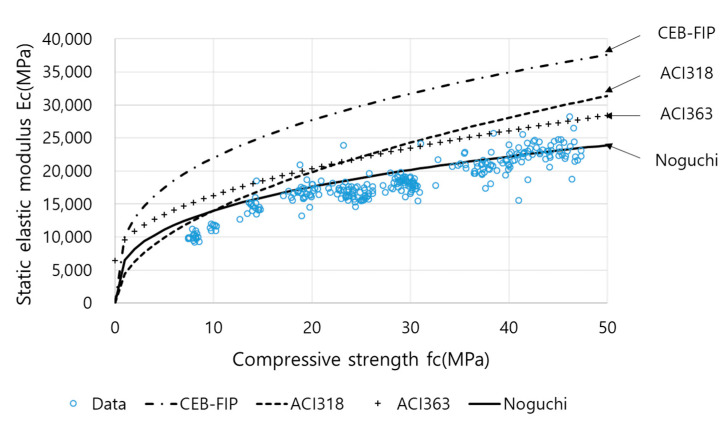
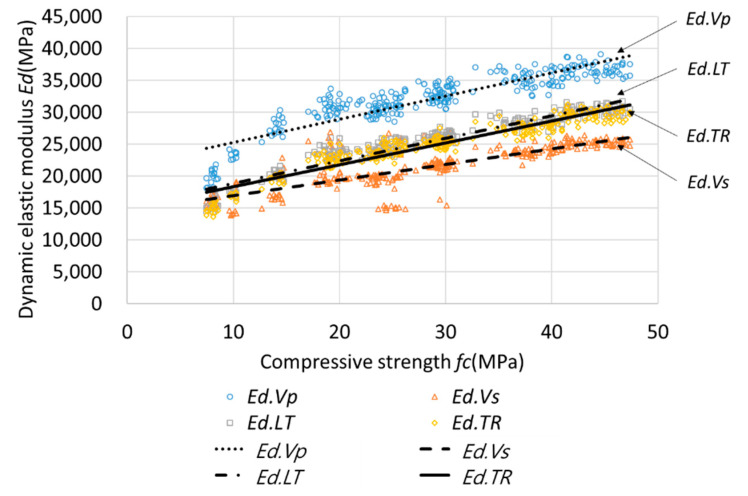
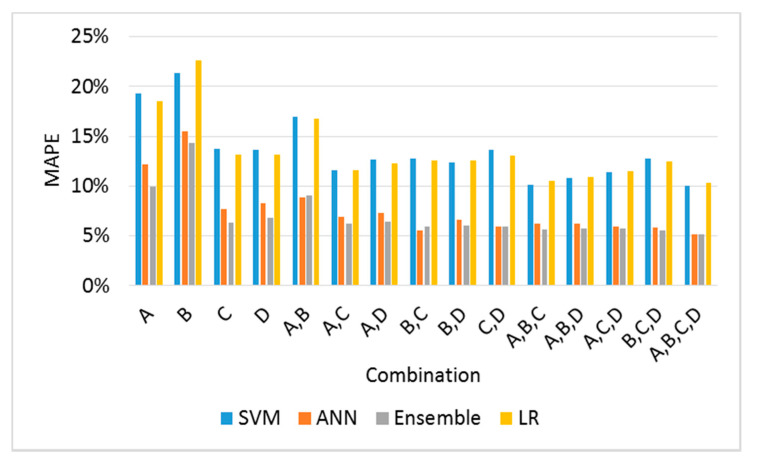
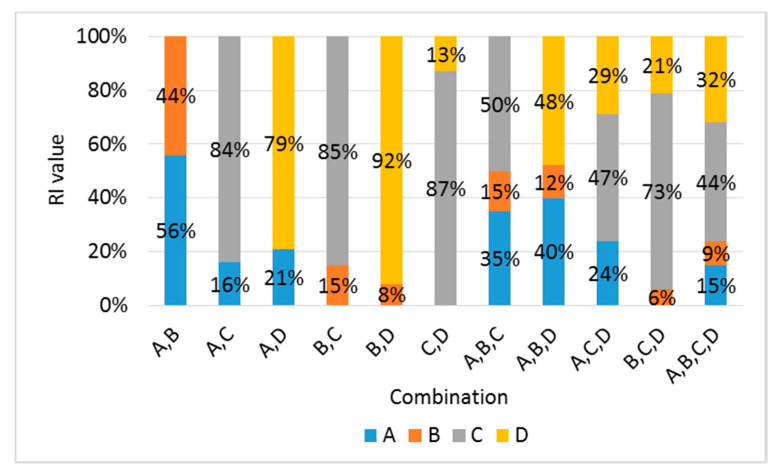
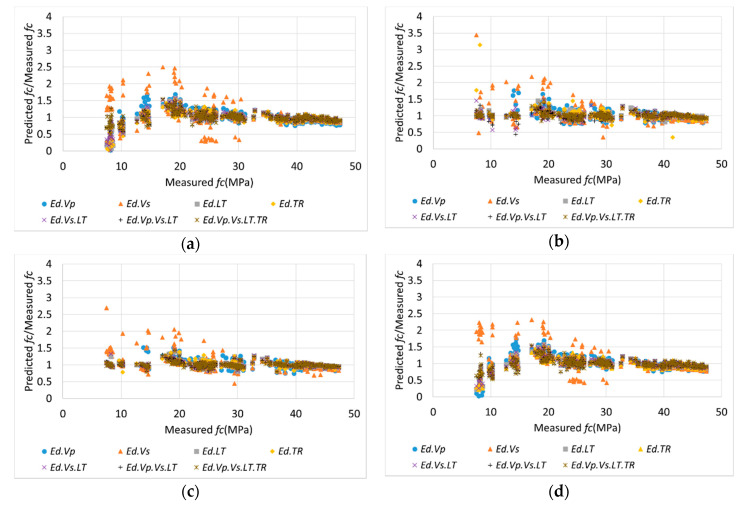
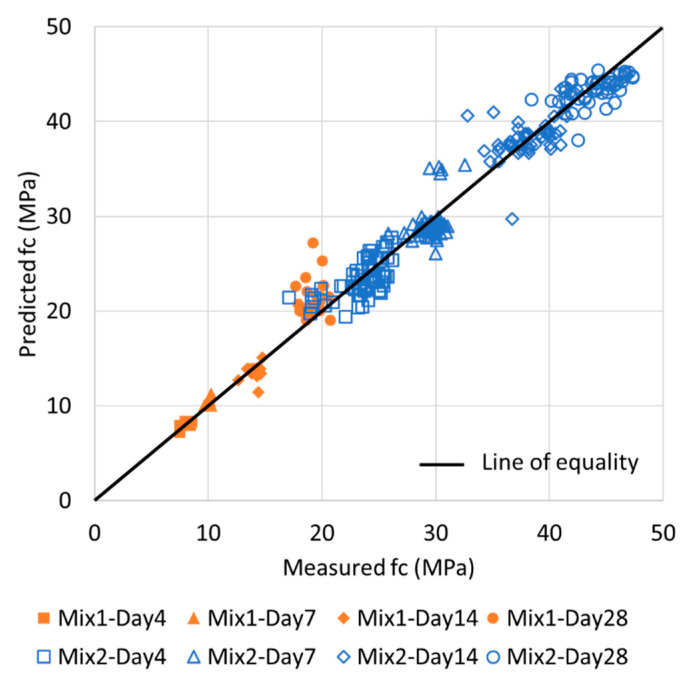
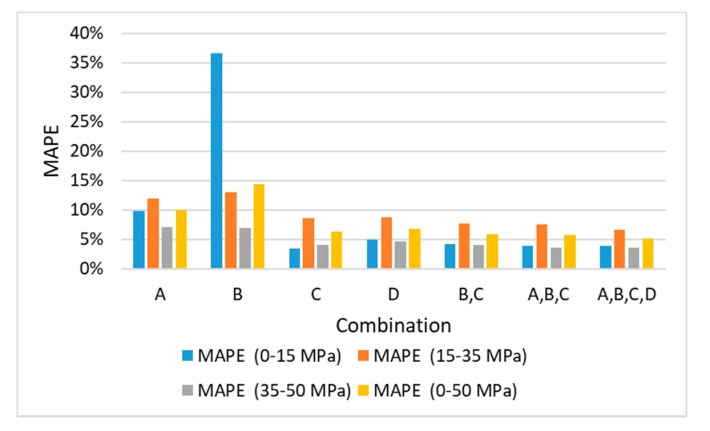
The static elastic modulus (Ec) and compressive strength (fc) are critical properties of concrete. When determining Ec and fc, concrete cores are collected and subjected to destructive tests. However, destructive tests require certain test permissions and large sample sizes. Hence, it is preferable to predict Ec using the dynamic elastic modulus (Ed), through nondestructive evaluations. A resonance frequency test performed according to ASTM C215-14 and a pressure wave (P-wave) measurement conducted according to ASTM C597M-16 are typically used to determine Ed. Recently, developments in transducers have enabled the measurement of a shear wave (S-wave) velocities in concrete. Although various equations have been proposed for estimating Ec and fc from Ed, their results deviate from experimental values. Thus, it is necessary to obtain a reliable Ed value for accurately predicting Ec and fc. In this study, Ed values were experimentally obtained from P-wave and S-wave velocities in the longitudinal and transverse modes; Ec and fc values were predicted using these Ed values through four machine learning (ML) methods: support vector machine, artificial neural networks, ensembles, and linear regression. Using ML, the prediction accuracy of Ec and fc was improved by 2.5-5% and 7-9%, respectively, compared with the accuracy obtained using classical or normal-regression equations. By combining ML methods, the accuracy of the predicted Ec and fc was improved by 0.5% and 1.5%, respectively, compared with the optimal single variable results.
Keywords: P-wave; S-wave; compressive strength; concrete; dynamic elastic modulus; machine learning; nondestructive method; resonance frequency test; static elastic modulus.
Conflict of interest statement
The authors declare no conflict of interest.
Figures
References
-
- Mehta P.K., Monteiro P.J.M. Concrete-Microstructure, Properties, and Materials. 4th ed. McGraw-Hill Education; New York, NY, USA: 2013.
-
- ASTMC666/C666M-15 . Standard Test Method for Resistance of Concrete to Rapid Freezing and Thawing. ASTM International; West Conshohoken, PA, USA: 2015.
-
- Popovics J.S. ACI-CRC Final Report. American Concrete Institute; Farmington Hills, MI, USA: 2008. A study of static and dynamic modulus of elasticity of concrete.
-
- ASTM C597M-16 . Standard Test Method for Pulse Velocity through Concrete. ASTM International; West Conshohoken, PA, USA: 2016.
-
- ASTM C215-14 . Standard Test Method for Fundamental Transverse, Longitudinal, and Torsional Resonant Frequencies of Concrete Specimens. ASTM International; West Conshohoken, PA, USA: 2016.
Grants and funding
LinkOut - more resources
Full Text Sources
