. 2020 Jun 27;13(13):2888.
doi: 10.3390/ma13132888.

Morphological and Mechanical Characterization of DNA SAMs Combining Nanolithography with AFM and Optical Methods

Affiliations

Morphological and Mechanical Characterization of DNA SAMs Combining Nanolithography with AFM and Optical Methods

Giulia Pinto et al. Materials (Basel). .

Abstract

The morphological and mechanical properties of thiolated ssDNA films self-assembled at different ionic strength on flat gold surfaces have been investigated using Atomic Force Microscopy (AFM). AFM nanoshaving experiments, performed in hard tapping mode, allowed selectively removing molecules from micro-sized regions. To image the shaved areas, in addition to the soft contact mode, we explored the use of the Quantitative Imaging (QI) mode. QI is a less perturbative imaging mode that allows obtaining quantitative information on both sample topography and mechanical properties. AFM analysis showed that DNA SAMs assembled at high ionic strength are thicker and less deformable than films prepared at low ionic strength. In the case of thicker films, the difference between film and substrate Young's moduli could be assessed from the analysis of QI data. The AFM finding of thicker and denser films was confirmed by X-Ray Photoelectron Spectroscopy (XPS) and Spectroscopic Ellipsometry (SE) analysis. SE data allowed detecting the DNA UV absorption on dense monomolecular films. Moreover, feeding the SE analysis with the thickness data obtained by AFM, we could estimate the refractive index of dense DNA films.

Keywords: AFM; DNA; Spectroscopic Ellipsometry; ionic strength; molecular absorption; self-assembled monolayers.


Conflict of interest statement

The authors declare no conflict of interest.

Figures
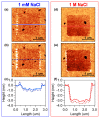
Figure 1
Figure 1
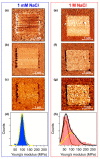
Shaving experiments on C6-ssDNA SAMs prepared in (a–c) 1 mM NaCl and (d–f) 1 M NaCl buffer. Height images of the shaved areas acquired in (a,d) contact mode and in (b,e) Quantitative Imaging (QI) mode (data scale: 9 nm). (c,f) z-profiles relative to contact images (light, continuous lines) and QI images (dark, dashed lines).
Figure 2
Figure 2
Shaving experiment on C6-ssDNA SAMs prepared in (a–d) 1 mM NaCl and (e–h) 1 M NaCl buffer. (a,e) Lateral deflection images acquired in contact mode (data scale: 20 mV). (b,f) Slope images acquired in QI mode (data scale: 250 N/m). (c,g) Young’s modulus images obtained from QI force curves (data scale: 150 MPa) and (d,h) related histograms.
Figure 3
Figure 3
Sketches of C6-ssDNA SAMs immobilized in (a) 1 mM NaCl and (b) 1 M NaCl TE buffer.
Figure 4
Figure 4
(a) δΔ and (b) δΨ spectra of 1 mM NaCl C6-ssDNA (blue curve) and 1 M NaCl C6-ssDNA (red curve). Error bars take into account the sample to sample variability. Dashed regions indicate fingerprint dips related to 260 nm DNA absorption.
Figure 5
Figure 5
(a,b) Comparison between NIR SE δ-data for C6-ssDNA prepared in 1 M NaCl buffer (red circles) and simulations (grey lines). Areas decorated with different motifs represent, for dfilm = 2 nm, 3 nm and 4 nm, simulations with Cauchy A-coefficient values comprised between 1.41 (top border) and 1.43 (bottom border), B = 0.012 µm2. Error bars take into account the sample to sample variability. (c) Refractive index referred to simulations with dfilm = 3 nm, B = 0.012 µm2 and A-coefficient values comprised between 1.43 (top border) and 1.41 (bottom border).

References

    1. Brittain W.J., Brandsetter T., Prucker O., Rühe J. The Surface Science of Microarray Generation—A Critical Inventory. ACS Appl. Mater. Interfaces. 2019;11:39397–39409. doi: 10.1021/acsami.9b06838. - DOI - PubMed
    1. Xiao Q., Wu J., Dang P., Ju H. Multiplexed chemiluminescence imaging assay of protein biomarkers using DNA microarray with proximity binding-induced hybridization chain reaction amplification. Anal. Chim. Acta. 2018;1032:130–137. doi: 10.1016/j.aca.2018.05.043. - DOI - PubMed
    1. Yu S., Chen T., Zhang Q., Zhou M., Zhu X. Application of DNA nanodevices for biosensing. Analyst. 2020;145:3481–3489. doi: 10.1039/D0AN00159G. - DOI - PubMed
    1. MacAskill A., Crawford D., Graham D., Faulds K. DNA Sequence Detection Using Surface-Enhanced Resonance Raman Spectroscopy in a Homogeneous Multiplexed Assay. Anal. Chem. 2009;81:8134–8140. doi: 10.1021/ac901361b. - DOI - PubMed
    1. Qian S., Lin M., Ji W., Yuan H., Zhang Y., Jing Z., Zhao J. Boronic Acid Functionalized Au Nanoparticles for Selective MicroRNA Signal Amplification in Fiber-Optic Surface Plasmon Resonance Sensing System. ACS Sens. 2018;7:929–935. doi: 10.1021/acssensors.7b00871. - DOI - PubMed

LinkOut - more resources