. 2020 Jun 28;10(7):268.
doi: 10.3390/metabo10070268.

Metabolic Signatures of Tumor Responses to Doxorubicin Elucidated by Metabolic Profiling in Ovo

Affiliations

Metabolic Signatures of Tumor Responses to Doxorubicin Elucidated by Metabolic Profiling in Ovo

Iman W Achkar et al. Metabolites. .

Abstract

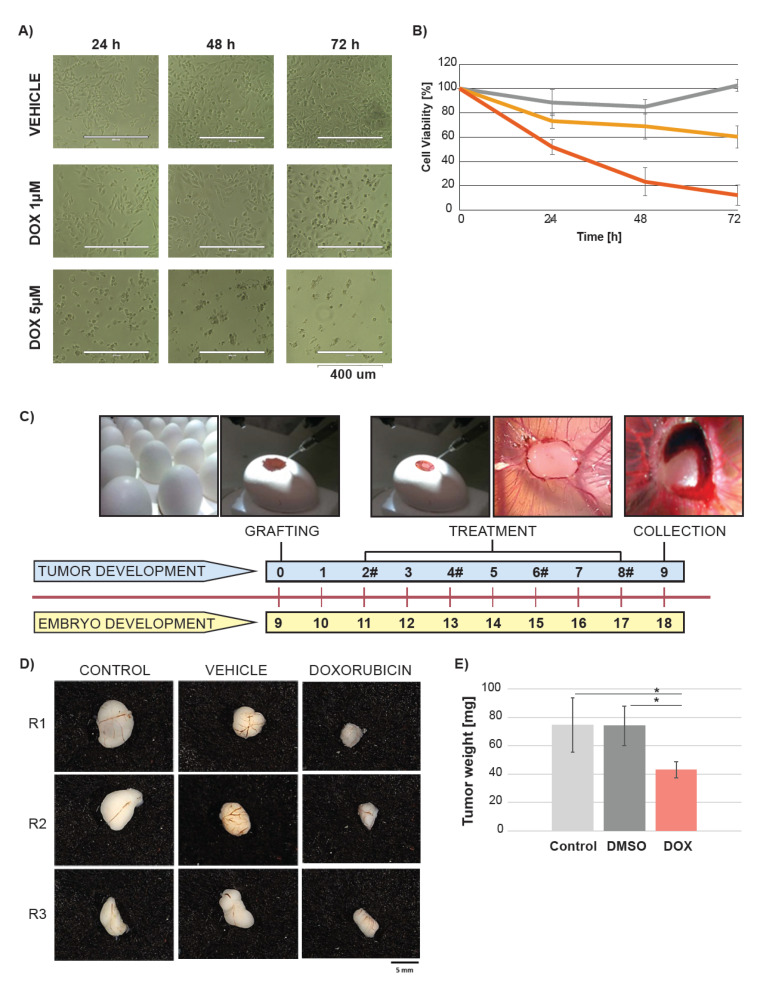
Background: Dysregulated cancer metabolism is associated with acquired resistance to chemotherapeutic treatment and contributes to the activation of cancer survival mechanisms. However, which metabolic pathways are activated following treatment often remains elusive. The combination of chicken embryo tumor models (in ovo) with metabolomics phenotyping could offer a robust platform for drug testing. Here, we assess the potential of this approach in the treatment of an in ovo triple negative breast cancer with doxorubicin.

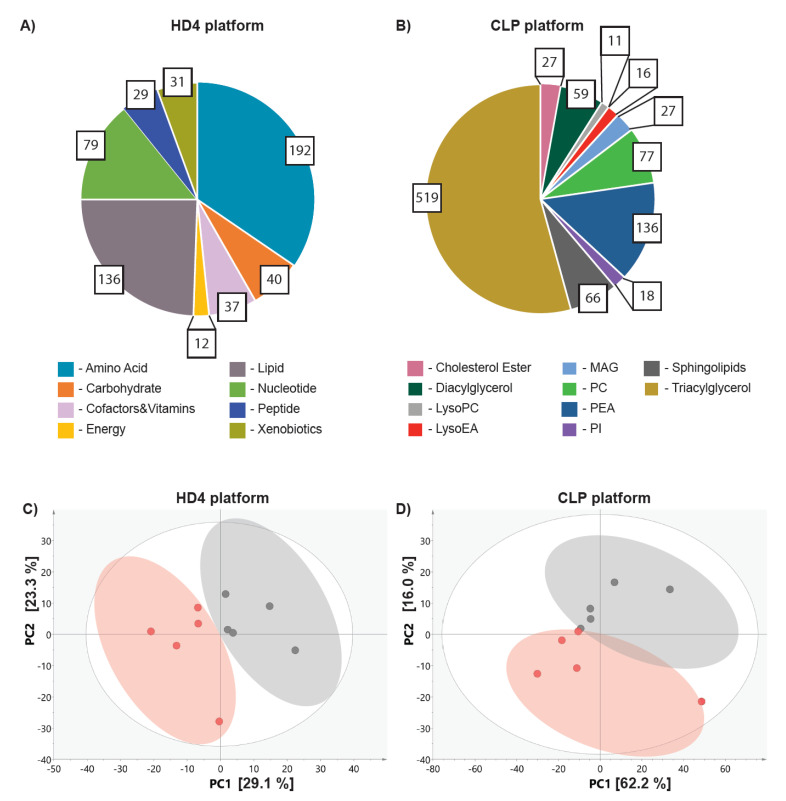
Methods: MB-MDA-231 cells were grafted in ovo. The resulting tumors were then treated with doxorubicin or dimethyl sulfoxide (DMSO) for six days. Tumors were collected and analyzed using a global untargeted metabolomics and comprehensive lipidomics.

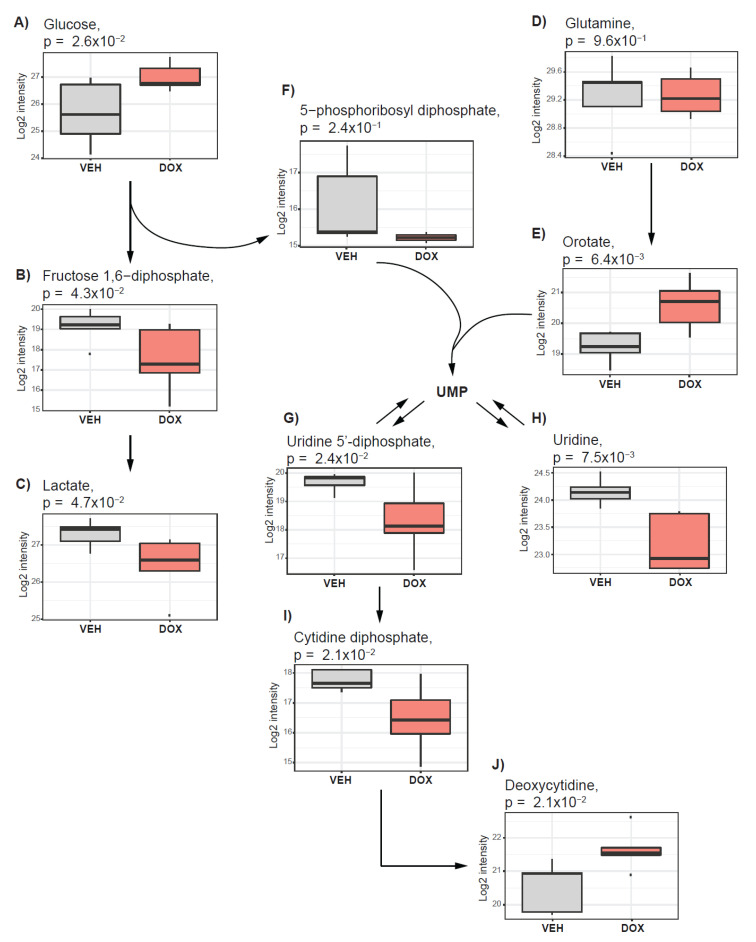
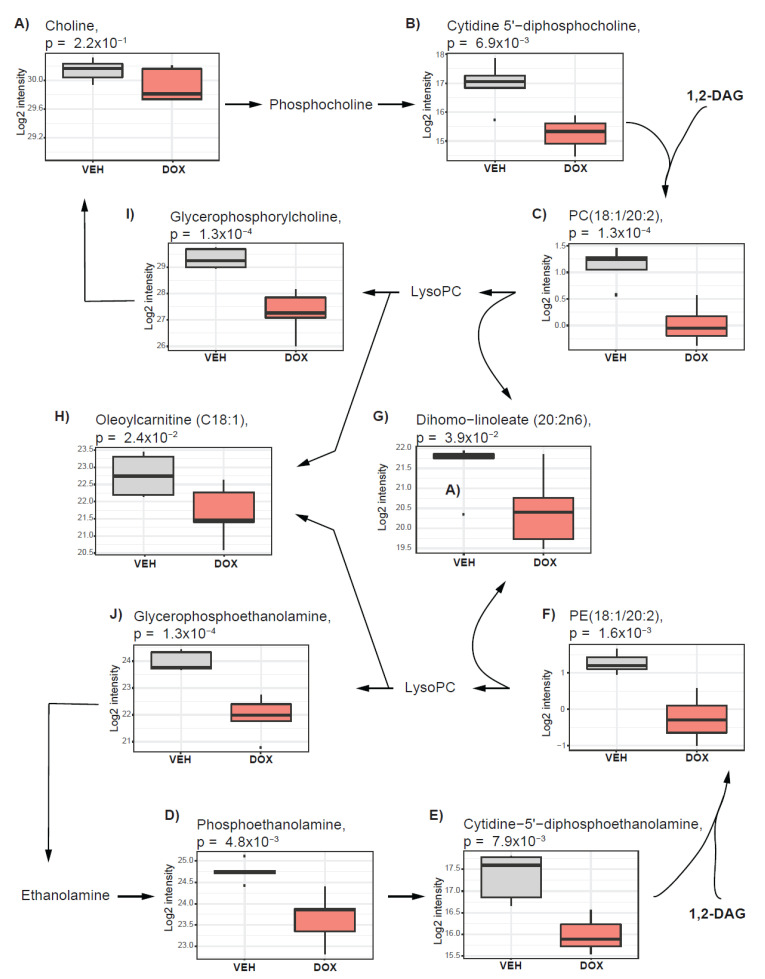
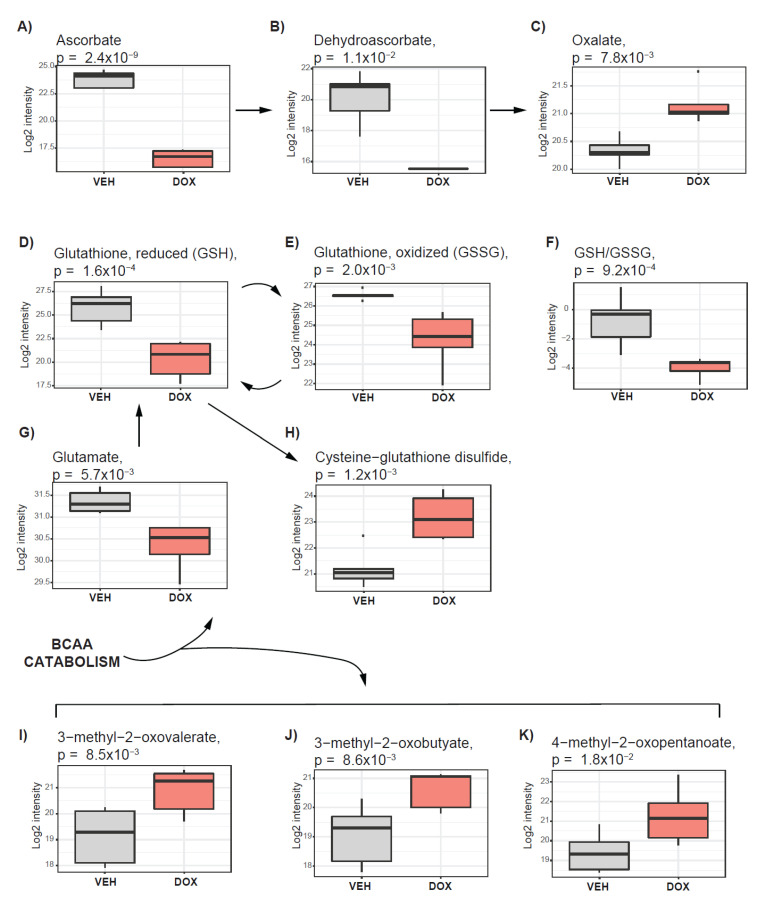
Results: We observed a significant suppression of tumor growth in the doxorubicin treated group. The metabolic profiles of doxorubicin and DMSO-treated tumors were clearly separated in a principle component analysis. Inhibition of glycolysis, nucleotide synthesis, and glycerophospholipid metabolism appear to be triggered by doxorubicin treatment, which could explain the observed suppressed tumor growth. In addition, metabolic cancer survival mechanisms could be supported by an acceleration of antioxidative pathways.

Conclusions: Metabolomics in combination with in ovo tumor models provide a robust platform for drug testing to reveal tumor specific treatment targets such as the antioxidative tumor capacity.

Keywords: cancer survival mechanism; chicken chorioallantoic membrane (CAM) system in ovo model; doxorubicin treatment; lipidomics; metabolomics; triple negative breast cancer.


Conflict of interest statement

The authors declare no conflicts of interest.

Figures

Figure 1
Figure 1
Doxorubicin decreases cell viability in ovo and in vitro. (A) Representative appearance of the MB-MDA-231 cultured in vitro over time of 72 h after treatment with vehicle (DMSO) and two doxorubicin (DOX) concentrations. (B) Cell viability after the DMSO or DOX treatment depicted by the (3-(4,5-dimethylthiazol-2-yl)-2,5-diphenyltetrazolium bromide) MTT assay. Dark grey indicates vehicle, yellow and red indicate 1 µM and 5 µM concentration of DOX respectively. (C) Study design. The chick embryo grew over a period of nine days. At day 9 of embryo growth, the cancer cells from the MB-MDA-231 cell line were grafted on the CAM of the egg. The treatment with DMSO, and DOX started at day 2 after cancer cell grafting. A volume of 100 µL of 25 µM DOX was added to achieve 0.024 mg/km of DOX per egg. The untreated cells were used as a control. The treatment was conducted every two days and the treatment time points are depicted by #. The tumors were collected at day 9 after the cancer cell grafting. (D) Representative gross appearance of tumors excised from the chick embryo (each group presented in triplicates). (E) Impact of DOX on tumor weight. Light grey indicates control, dark grey indicates vehicle, and red indicates DOX treatment. Significant differences were depicted by *.
Figure 2
Figure 2
Doxorubicin triggers changes in tumor metabolism in ovo. Pie chart reflective of the number of metabolites measured on HD4 platform (A) and CLP (B), representing the numerical proportion of each metabolic class. The colors of the pie fractions represent different metabolic classes measured on the HD4 or CLP platform. The PCA analysis of metabolites measured on HD4 (C) and CLP (D) reveal the separation between the vehicle (depicted in grey) treated and doxorubicin (depicted in red).
Figure 3
Figure 3
Doxorubicin treatment suppresses glycolysis and nucleotide synthesis. The boxplots represent alterations in glycolysis and nucleotide synthesis after treatment of in ovo tumors with doxorubicin. Alterations in (A) Glucose, (B) Fructose 1,6-diphosphate, (C) lactate, (E) Orotate, (G) Uridine 5’-diphosphate, (H) Uridine, (I) Cytidine diphosphate, and (J) Deoxycytidine are nominally significant. (D) Glutamine and (F) 5-phosphoribosyl-diphosphate are not impacted by doxorubicin treatment. Vehicle-treated tumors (VEH) are depicted in grey, and those treated with doxorubicin (DOX) are indicated in red.
Figure 4
Figure 4
Cholinic phenotype is impacted by doxorubicin treatment in ovo. The boxplots present the alteration for glycerophospholipid metabolism triggered after the treatment of in ovo tumors with doxorubicin. (A) Choline level is not affected by doxorubicin treatment. (B) Cytidine 5’−diphosphocholine, (C) phosphatidylcholines (e.g., PC(18:1/20:2)), (D) Phosphoethanolamine, (E) Cytidine−5’−diphosphoethanolamine, (F) Phosphoethanolamines (e.g., PE(18:1/20:2)), (G) Dihomo−linoleate (20:2n6), (H) Oleoylcarnitine (C18:1), (I) Glycerophosphorylcholine, and (J) Glycerophosphoethanolamine show nominally significant alterations after the treatment. Vehicle-treated tumors (VEH) are depicted in grey, and those treated with doxorubicin (DOX) are indicated in red.
Figure 5
Figure 5
Activation of pathways supporting tumor antioxidative capacity in response to doxorubicin treatment. The boxplots represent alterations in ascorbate metabolism (AC); Glutathione metabolism (D,E,G,H); metabolic ratio between reduced and oxidized glutathione (GSH/GSSG) (F); Branch chain amino acid catabolism (IK). Vehicle−treated cells are depicted in grey, and those treated with doxorubicin are indicated in red.

References

    1. Sorlie T., Perou C.M., Tibshirani R., Aas T., Geisler S., Johnsen H., Hastie T., Eisen M.B., van de Rijn M., Jeffrey S.S., et al. Gene expression patterns of breast carcinomas distinguish tumor subclasses with clinical implications. Proc. Natl. Acad. Sci. USA. 2001;98:10869–10874. doi: 10.1073/pnas.191367098. - DOI - PMC - PubMed
    1. Brenton J.D., Carey L.A., Ahmed A., Caldas C. Molecular classification and molecular forecasting of breast cancer: Ready for clinical application? J. Clin. Oncol. 2005;23:7350–7360. doi: 10.1200/JCO.2005.03.3845. - DOI - PubMed
    1. Malorni L., Shetty P.B., De Angelis C., Hilsenbeck S., Rimawi M.F., Elledge R., Osborne C.K., De Placido S., Arpino G. Clinical and biologic features of triple−negative breast cancers in a large cohort of patients with long−term follow−up. Breast Cancer Res. Treat. 2012;136:795–804. doi: 10.1007/s10549-012-2315-y. - DOI - PMC - PubMed
    1. Hwang S.Y., Park S., Kwon Y. Recent therapeutic trends and promising targets in triple negative breast cancer. Pharmacol. Ther. 2019;199:30–57. doi: 10.1016/j.pharmthera.2019.02.006. - DOI - PubMed
    1. Bianchini G., Balko J.M., Mayer I.A., Sanders M.E., Gianni L. Triple−negative breast cancer: Challenges and opportunities of a heterogeneous disease. Nat. Rev. Clin. Oncol. 2016;13:674–690. doi: 10.1038/nrclinonc.2016.66. - DOI - PMC - PubMed

LinkOut - more resources