

Optical coherence tomography angiography (OCTA) findings in Serpiginous Choroiditis
- PMID: 32605555
- PMCID: PMC7325353
- DOI: 10.1186/s12886-020-01527-5
Optical coherence tomography angiography (OCTA) findings in Serpiginous Choroiditis
Abstract
Background: To describe changes in the retina/choroid in patients with Serpiginous Choroiditis (SC) by Optical Coherence Tomography Angiography (OCTA) in a multimodal imaging approach.
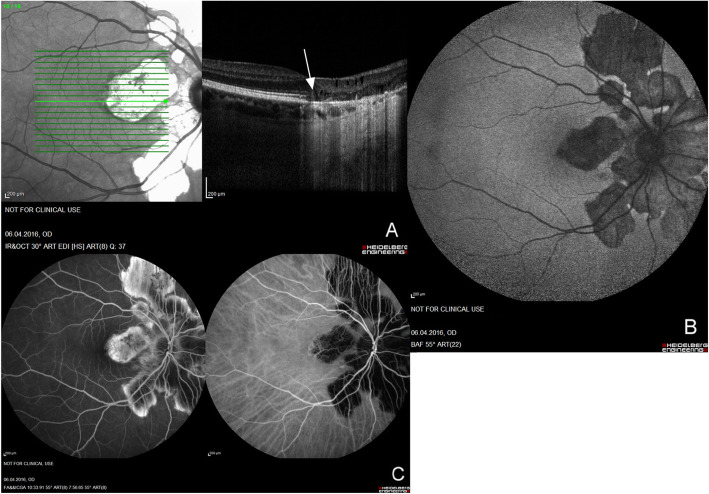
Methods: Prospective, monocentric study of 24 eyes of 12 consenting patients diagnosed with SC, who underwent OCTA, which was analyzed and compared to other methods such as enhanced depth imaging-OCT, fluorescein angiography, indocyanine green angiography, and fundus autofluorescence.
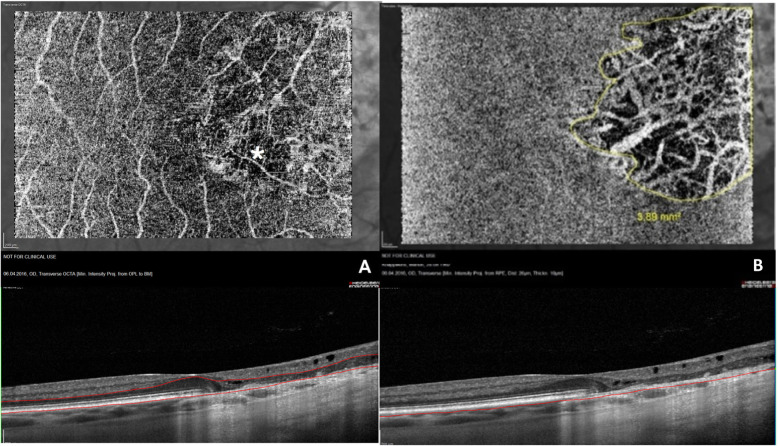
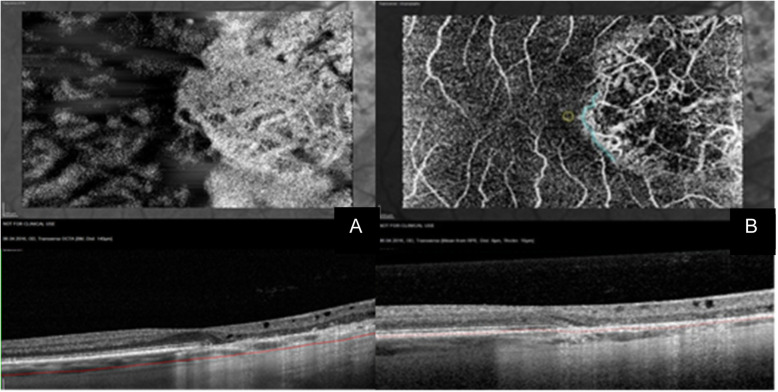
Results: The study group consisted of 9 patients with peripapillary SC, 1 macular SC, and 2 atypical cases. All eyes presented an inactive SC confirmed by standard imaging. OCTA demonstrated the lesions tridimensionally in great detail. There was no difference in the angioarchitecture among the 3 forms of SC. A loss of the choriocapillaris/retinal pigment epithelium left a "window-defect", where the vessels of larger caliber of the choroid became recognizable and their appearance inverted ("white-on-black"). A relationship between the presence of segmentation errors (SE) in the slabs and low visual acuity was established with a one-way ANOVA.
Conclusions: OCTA was able to non-invasively assess vascular lesions of the choroid/retina in patients with SC with a high degree of correlation to other diagnostic modalities. Consequent long-term assessments could lead to a better understanding of disease progression.
Keywords: Fluorescein angiography; Fundus autofluorescence; Indocyanin green angiography; Optical coherence tomography angiography; Posterior uveitis; Serpiginous Choroiditis.
Conflict of interest statement
AMJ has served as principal investigator or consultant for: Allergan, Novartis, Bayer, Heidelberg engineering. UP has served as principal investigator or consultant for: Abbvie, Alcon, Allergan, Novartis, Santen, Thea. SW has served as consultant for: Allergan, Novartis, Bayer, MSD, Heidelberg engineering.
DP has served as consultant for: Allergan, Heidelberg engineering. The remaining authors declare that they have no competing interests.
Figures
References
-
- White spot syndromes of the retina: a hypothesis based on the common genetic hypothesis of autoimmune/inflammatory disease. Am J Ophthalmol. 2003;135(3):376–9. - PubMed
-
- Thurau S, Pleyer U. Entzündliche Augenerkrankungen. 1. Heidelberg: Springer; 2014.
MeSH terms
Grants and funding
LinkOut - more resources
Full Text Sources
