. 2020 Jul 1;21(1):156.
doi: 10.1186/s13059-020-02065-5.

Identification of cell type-specific methylation signals in bulk whole genome bisulfite sequencing data

Affiliations

Identification of cell type-specific methylation signals in bulk whole genome bisulfite sequencing data

C Anthony Scott et al. Genome Biol. .

Abstract

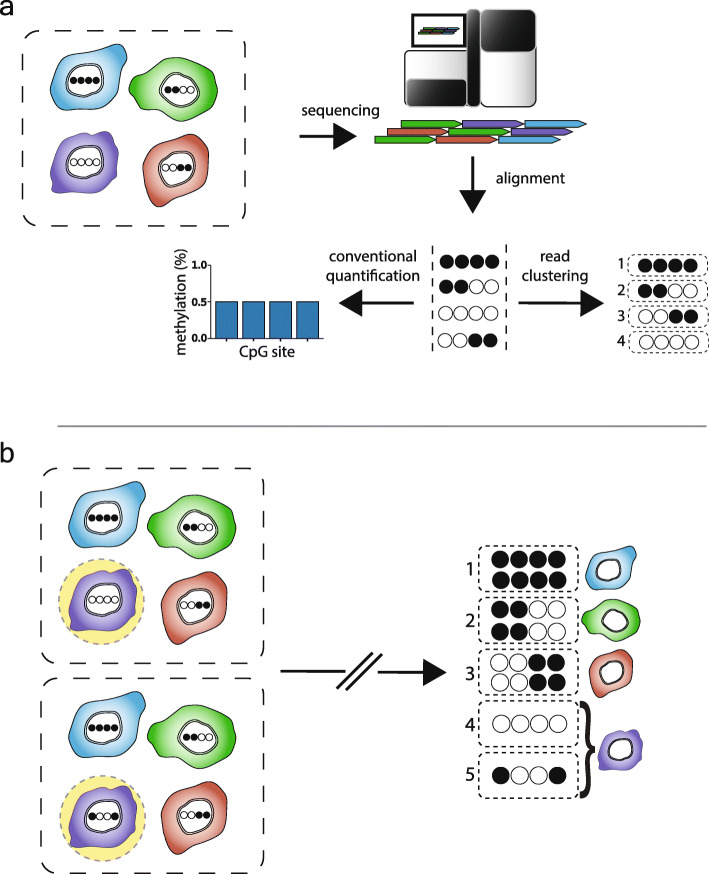
Background: The traditional approach to studying the epigenetic mechanism CpG methylation in tissue samples is to identify regions of concordant differential methylation spanning multiple CpG sites (differentially methylated regions). Variation limited to single or small numbers of CpGs has been assumed to reflect stochastic processes. To test this, we developed software, Cluster-Based analysis of CpG methylation (CluBCpG), and explored variation in read-level CpG methylation patterns in whole genome bisulfite sequencing data.

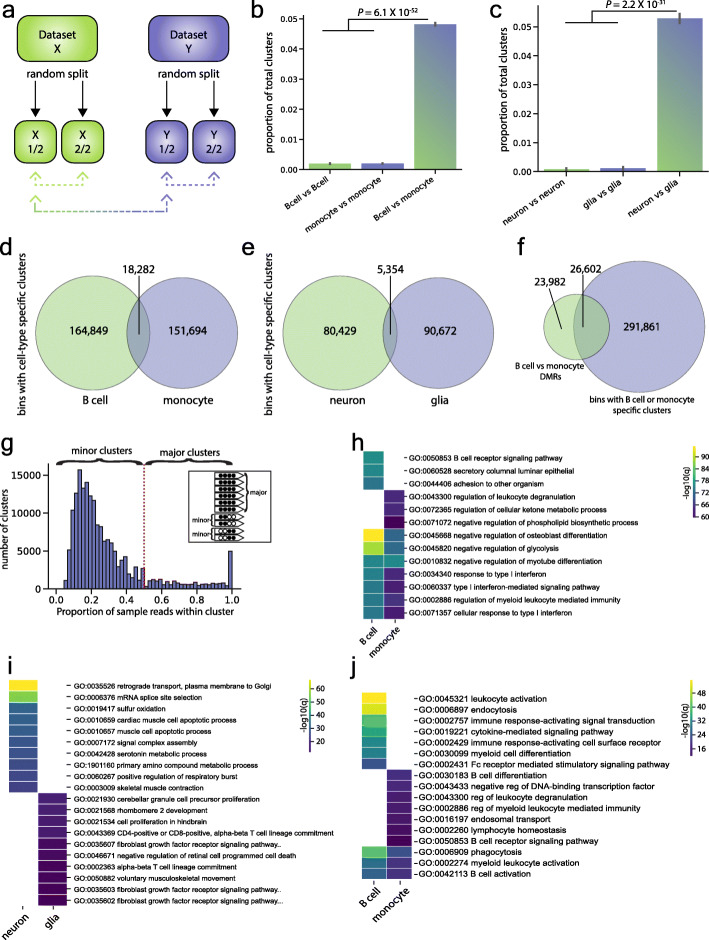
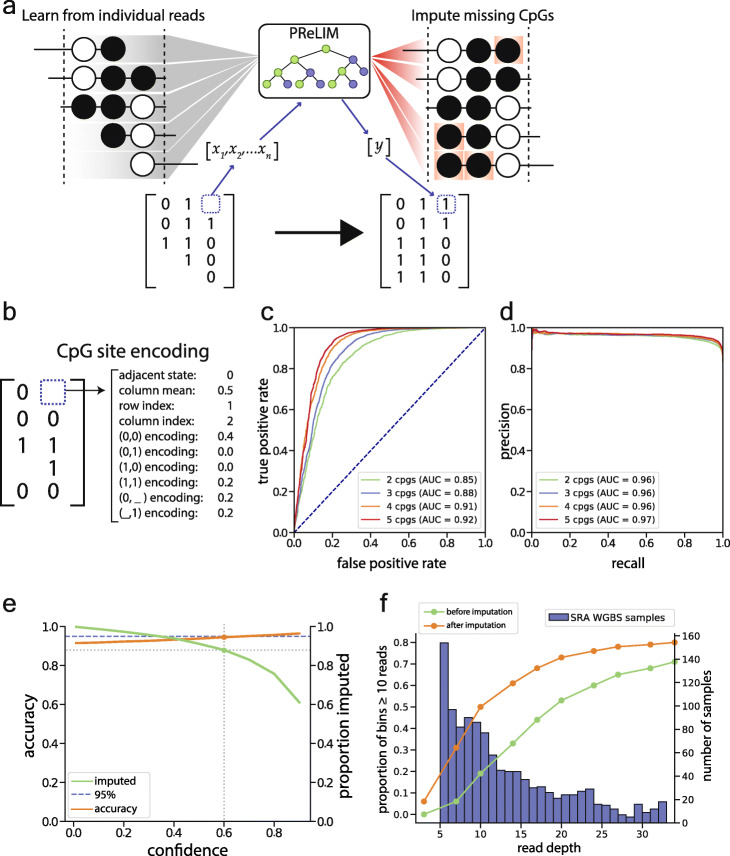
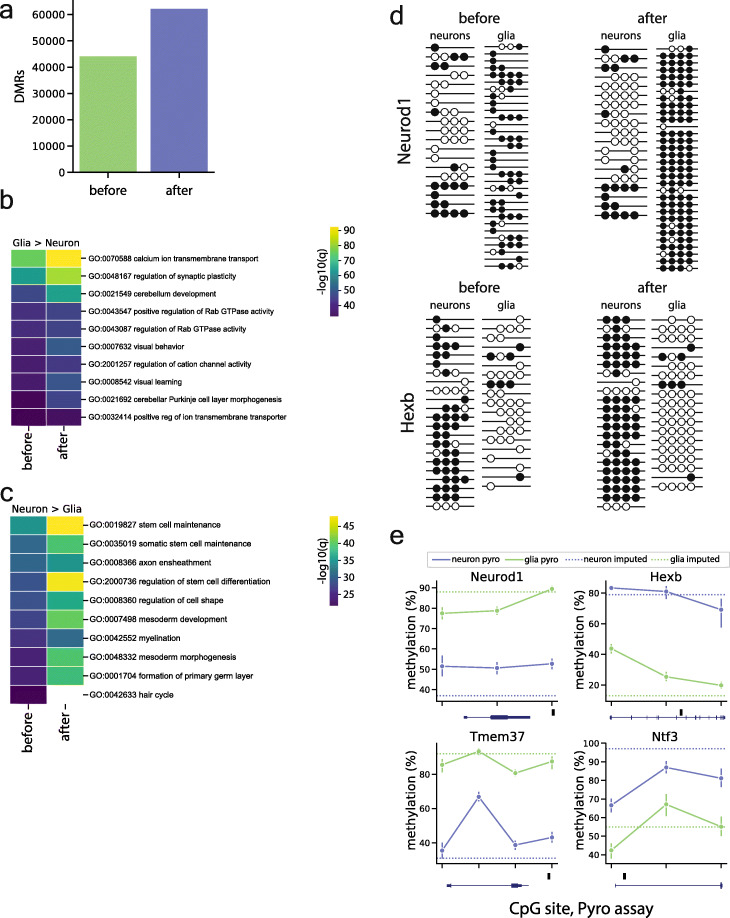
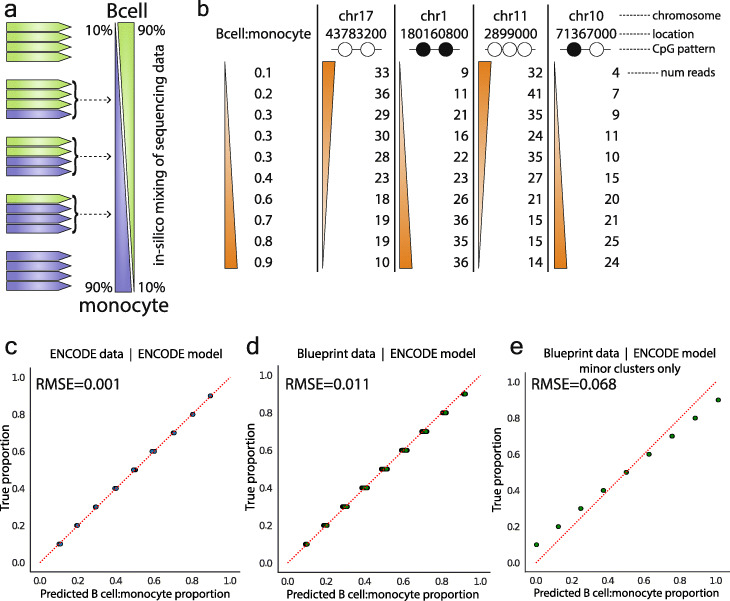
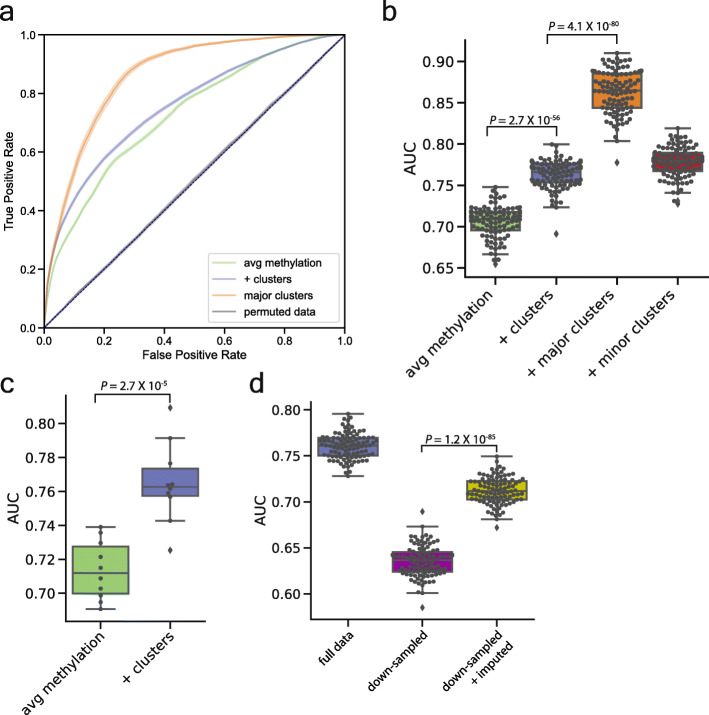
Results: Analysis of both human and mouse whole genome bisulfite sequencing datasets reveals read-level signatures associated with cell type and cell type-specific biological processes. These signatures, which are mostly orthogonal to classical differentially methylated regions, are enriched at cell type-specific enhancers and allow estimation of proportional cell composition in synthetic mixtures and improved prediction of gene expression. In tandem, we developed a machine learning algorithm, Precise Read-Level Imputation of Methylation (PReLIM), to increase coverage of existing whole genome bisulfite sequencing datasets by imputing CpG methylation states on individual sequencing reads. PReLIM both improves CluBCpG coverage and performance and enables identification of novel differentially methylated regions, which we independently validate.

Conclusions: Our data indicate that, rather than stochastic variation, read-level CpG methylation patterns in tissue whole genome bisulfite sequencing libraries reflect cell type. Accordingly, these new computational tools should lead to an improved understanding of epigenetic regulation by DNA methylation.

Keywords: Bisulfite-seq; DNA methylation; Deconvolution; Imputation; Machine learning; Random forests; Read-level; WGBS.


Conflict of interest statement

The authors have no competing interests to report.

Figures

Fig. 1
Fig. 1
Rationale behind Cluster-Based analysis of CpG methylation (CluBCpG). a Each WGBS read originates from a DNA molecule within a single cell (filled and empty circles in tanghulu plots represent methylated and unmethylated CpG sites; columns and rows represent CpG sites and WGBS reads, respectively). The dotted-outline box represents a tissue sample, and colored shapes represent different cell types. Conventionally, methylation is measured by averaging methylated and unmethylated reads at each CpG site. Instead, CluBCpG groups reads based on methylation patterns. (Note: By default, 4 reads of identical methylation pattern are required to comprise a cluster; single-read “clusters” are depicted here for simplicity.) b Conceptually, CluBCpG can be utilized to compare two samples (dotted boxes) to find cell type-specific differences by identifying patterns that are unique to one of the input samples
Fig. 2
Fig. 2
CluBCpG identifies unique read clusters that associate with cell type. a Schematic depicting how data were iteratively divided into random splits to perform cell type comparisons using CluBCpG. b, c Bar graphs representing the average proportion of clusters unique to either input across 10 rounds of random sampling; comparisons were performed for b human B cells and monocytes and c human neurons and glia. Error bars represent the standard deviation from the mean; statistical test: one-way ANOVA, f-statistics are 83,978 (b) and 6725 (c), 2 degrees of freedom. In both cases, > 20-fold more unique clusters were identified when different cell types are compared. d, e Venn diagrams of all genomic bins with a cell type-specific cluster identified in d the full data set B cell vs. monocyte comparison and e the neuron vs. glia comparison. f In the B cell vs. monocyte comparison, < 10% of bins with a cell type-specific cluster overlap with a B cell vs. monocyte DMR. g Histogram showing the proportional representation of sample reads per B cell-specific cluster in the B cell vs. monocyte comparison. Clusters comprising ≥ 50% or < 50% of the B cell reads in that bin are termed “major” and “minor” clusters, respectively. Inset illustrates the concept. h, i Heatmaps showing the top 10 GO biological process terms associated with bins containing h a B cell- or monocyte-specific cluster or i a neuron- or glia-specific cluster. j Heatmap of the top 10 GO biological process terms from B cell and monocyte bins containing a major cluster. Colors in all heatmaps represent the -log10 of the q value calculated by GREAT
Fig. 3
Fig. 3
Precise Read-level Imputation of Methylation (PReLIM) imputes missing methylation values at the read level. a Conceptual illustration of PReLIM. During training, PReLIM learns about associations of CpG methylation patterns within and among millions of reads from a given dataset. PReLIM then uses this knowledge to impute missing CpG values for all reads overlapping each 100-bp bin, enabling the generation of complete matrices that can be used by CluBCpG. b PReLIM expands each individual CpG site to a 1D vector which contains all the information for that CpG site in the context of all other reads in that bin. Read encodings are the relative proportions of each possible type of methylation pattern found in the matrix. c Receiver operating characteristic plot showing PReLIM’s performance on the 20% of mouse neuron data held out during training. d Corresponding precision-recall plot. e Trade-off plot illustrating associations between prediction confidence, prediction accuracy, and proportion of imputations achieved. Dotted lines show that, for this data set, considering only predictions with confidence > 0.6 enables 90% of missing values to be imputed at 95% accuracy. f Line plots (scale on left axis) show that imputation by PReLIM enables substantial gains in the proportion of genomic bins meeting CluBCpG coverage requirements on the ENCODE B cell data. Bar plot (scale on right axis) shows estimated coverage level of WGBS libraries currently deposited in the NCBI SRA; libraries with less than 5X coverage are not shown. For the majority of these datasets, PReLIM can increase coverage by 50–100%
Fig. 4
Fig. 4
PReLIM increases power and coverage of WGBS datasets. a Differentially methylated regions (DMRs) identified in the mouse neuron vs. glia WGBS dataset before and after imputation. b, c Heatmap showing the top 10 GO biological process terms for DMRs with b lower methylation in neurons and c lower methylation in glia, before and after imputation by PReLIM; analysis was conducted using GREAT, color represents the -log10 q value. PReLIM generally increases the statistical significance of the GO terms. d Examples of tanghulu plots showing WGBS reads at DMRs identified only post-imputation; rows and columns represent reads and CpG sites, respectively. Filled and empty circles represent methylated and unmethylated CpGs. e Examples of bisulfite pyrosequencing results of DMRs identified only post-imputation. Each point represents a single CpG site in the pyro assay, within the DMR. Horizontal dotted lines indicate average cell type-specific methylation across the DMR, from the WGBS data following PReLIM imputation. DMR positions relative to genes are depicted below each plot. Black box indicates DMR location, blue gene-body schematic is oriented 5′ to 3′
Fig. 5
Fig. 5
CluBCpG enables proportional estimation of in silico cell mixtures. a Illustration of how individual reads from pure B cell and monocyte WGBS libraries were mixed computationally to create synthetic cell mixtures. b Examples of data columns from the ENCODE training data used to fit a linear model. B cell to monocyte proportion is the dependent variable. Each column represents a read-level methylation pattern within a bin, and the number of reads showing that pattern in the bin. c Predicted B cell to monocyte proportion vs. the true proportion on a subset of 20% ENCODE data held out from training of the linear regression model; note at each position 10 points are overlapping one another. d Predicted B cell to monocyte proportion vs. true proportion for all Blueprint B cell and monocyte data. Predictions were based on the linear model fit on the ENCODE data. e Predicted B cell to monocyte proportion vs. true proportion for all Blueprint B cell and monocyte data using only minor clusters. For ce, the diagonal, red dotted line is the line of identity
Fig. 6
Fig. 6
CluBCpG read clusters improve prediction of gene expression. a Receiver operating characteristic (ROC) curves of a random forest model trained on promoter average methylation alone (green line), promoter average methylation plus cluster information (purple line), promoter average methylation plus cluster information on the subset of gene promoters containing a major cluster (orange line), and promoter average methylation plus cluster information in which the class labels were permuted (gray line). Shading represents the 95% confidence interval of 100 random train-test splits. bd Box and whisker plot overlaid with individual points showing the area under the ROC curve for train-test splits. Whiskers extend to 1.5x the intra-quartile range. c AUC results from a 10-fold nested cross-validation strategy that was used to ensure the models were not overfitting. d Downsampled data were the full B cell vs. monocyte dataset randomly reduced to 9X genome-wide coverage. Statistical tests: t test, two-tailed

References

    1. Bergman Y, Cedar H. DNA methylation dynamics in health and disease. Nat Struct Mol Biol. 2013;20:274. doi: 10.1038/nsmb.2518. - DOI - PubMed
    1. Teschendorff AE, Relton CL. Statistical and integrative system-level analysis of DNA methylation data. Nat Rev Genet. 2018;19:129. doi: 10.1038/nrg.2017.86. - DOI - PubMed
    1. Schultz MD, He Y, Whitaker JW, Hariharan M, Mukamel EA, Leung D, Rajagopal N, Nery JR, Urich MA, Chen H. Human body epigenome maps reveal noncanonical DNA methylation variation. Nature. 2015;523:212. doi: 10.1038/nature14465. - DOI - PMC - PubMed
    1. Farlik M, Halbritter F, Müller F, Choudry FA, Ebert P, Klughammer J, Farrow S, Santoro A, Ciaurro V, Mathur A. DNA methylation dynamics of human hematopoietic stem cell differentiation. Cell Stem Cell. 2016;19:808–822. doi: 10.1016/j.stem.2016.10.019. - DOI - PMC - PubMed
    1. Landan G, Cohen NM, Mukamel Z, Bar A, Molchadsky A, Brosh R, Horn-Saban S, Zalcenstein DA, Goldfinger N, Zundelevich A. Epigenetic polymorphism and the stochastic formation of differentially methylated regions in normal and cancerous tissues. Nat Genet. 2012;44:1207. doi: 10.1038/ng.2442. - DOI - PubMed

Publication types

LinkOut - more resources