. 2021 Feb;50(2):227-235.
doi: 10.1016/j.ijom.2020.04.018. Epub 2020 Jun 27.

Quantitative bone imaging biomarkers to diagnose temporomandibular joint osteoarthritis

Affiliations

Quantitative bone imaging biomarkers to diagnose temporomandibular joint osteoarthritis

J Bianchi et al. Int J Oral Maxillofac Surg. 2021 Feb.

Abstract

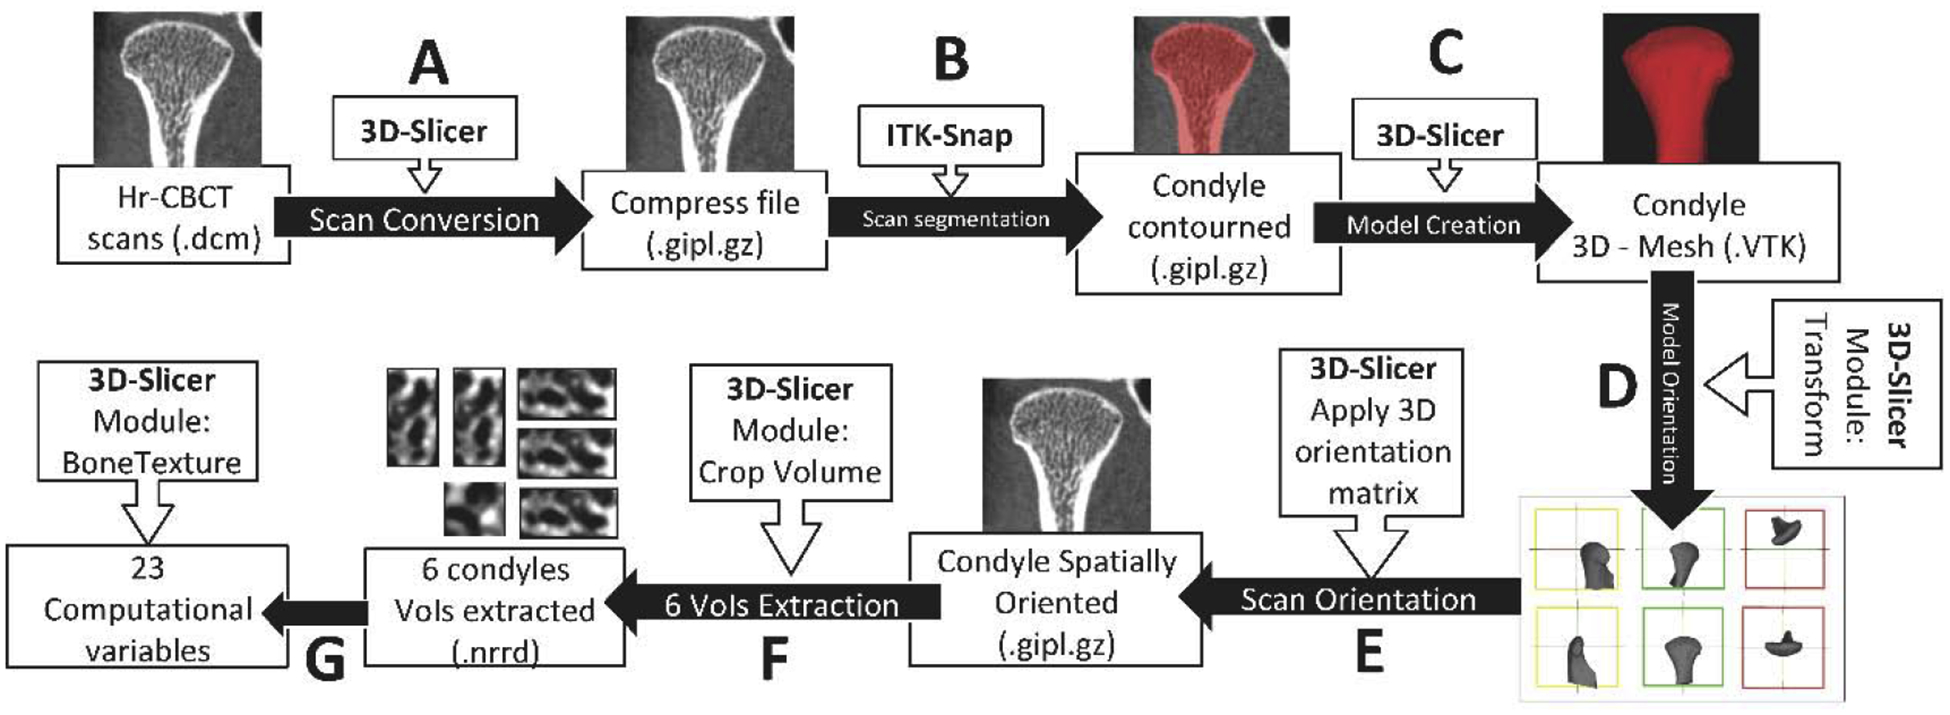
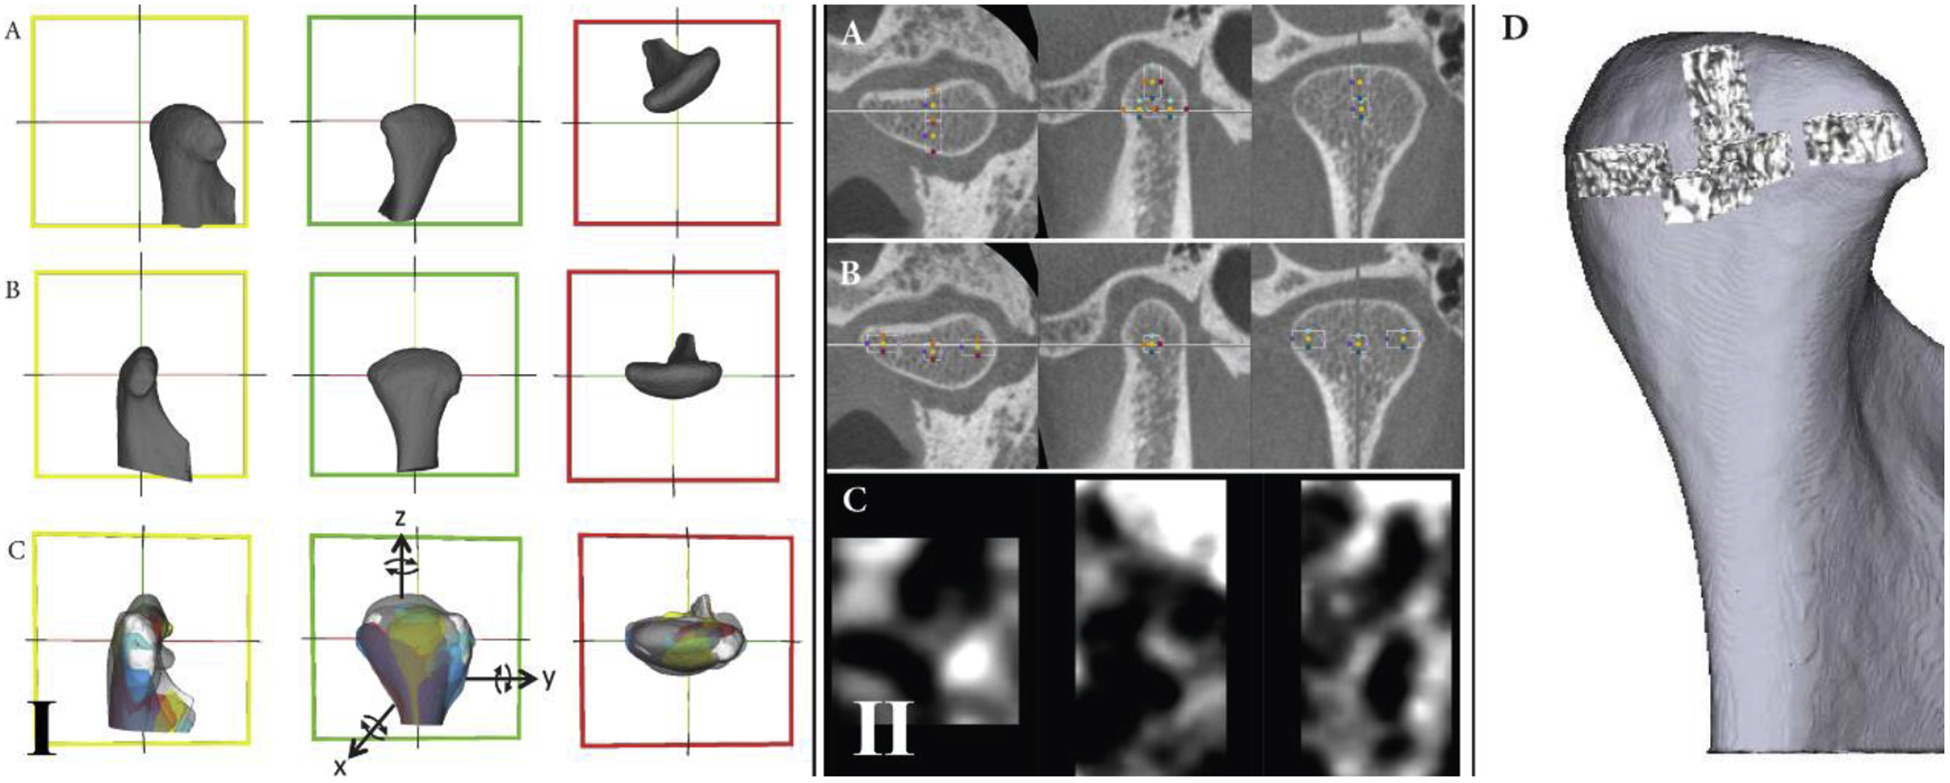
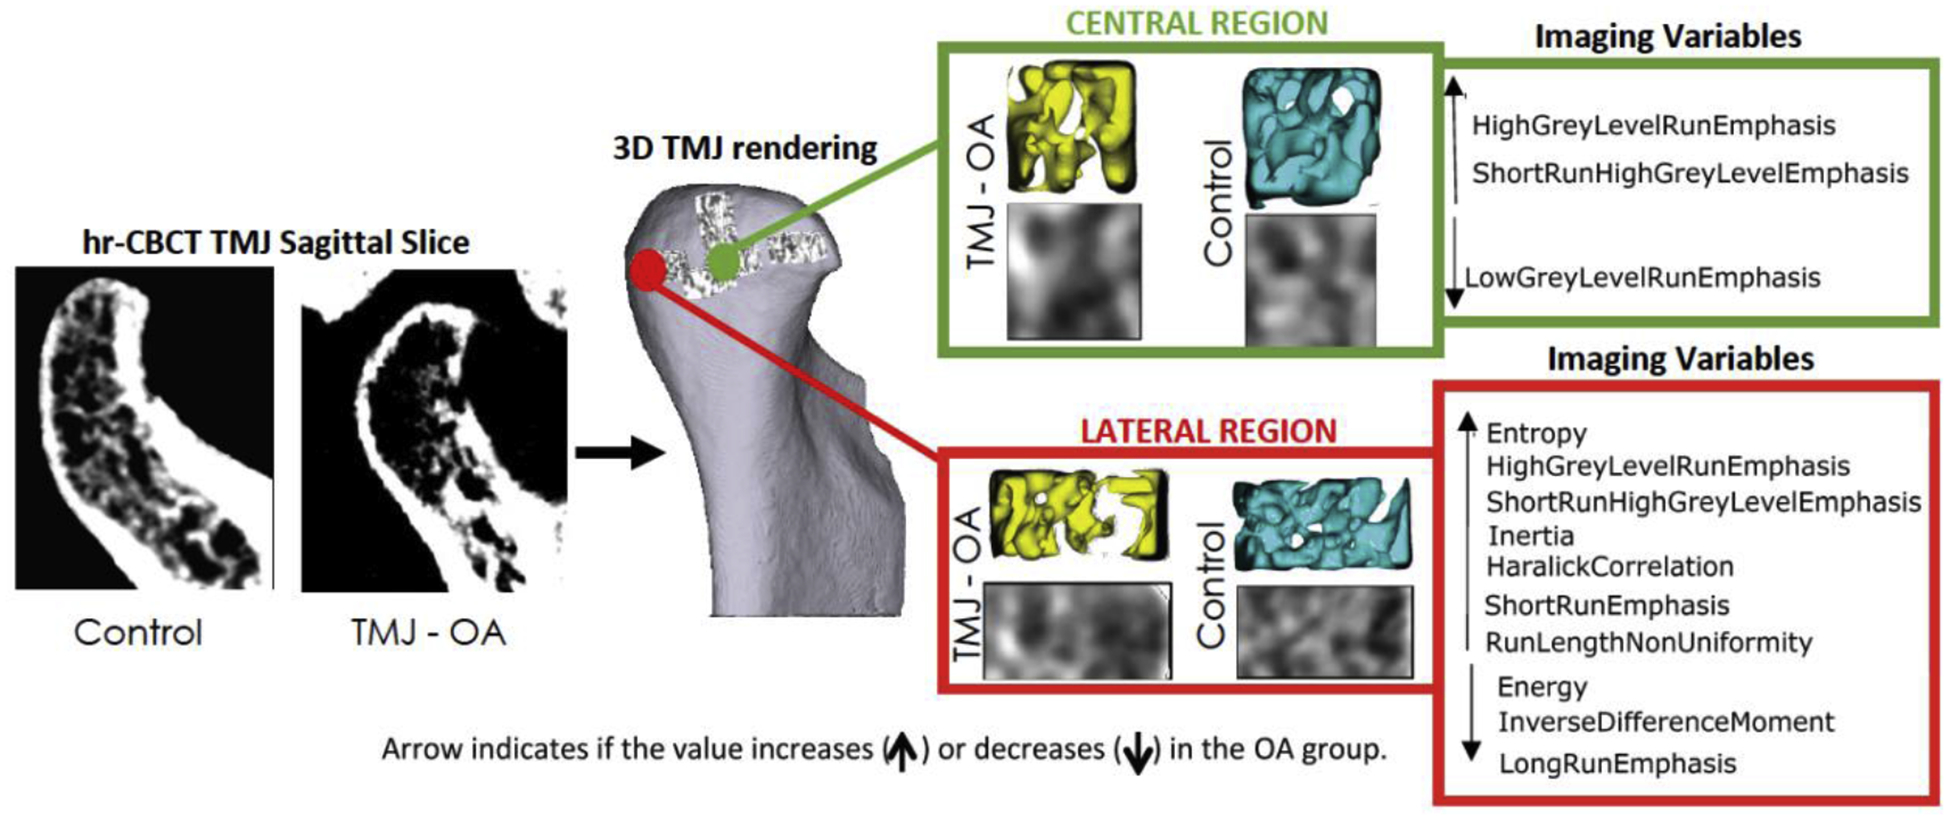
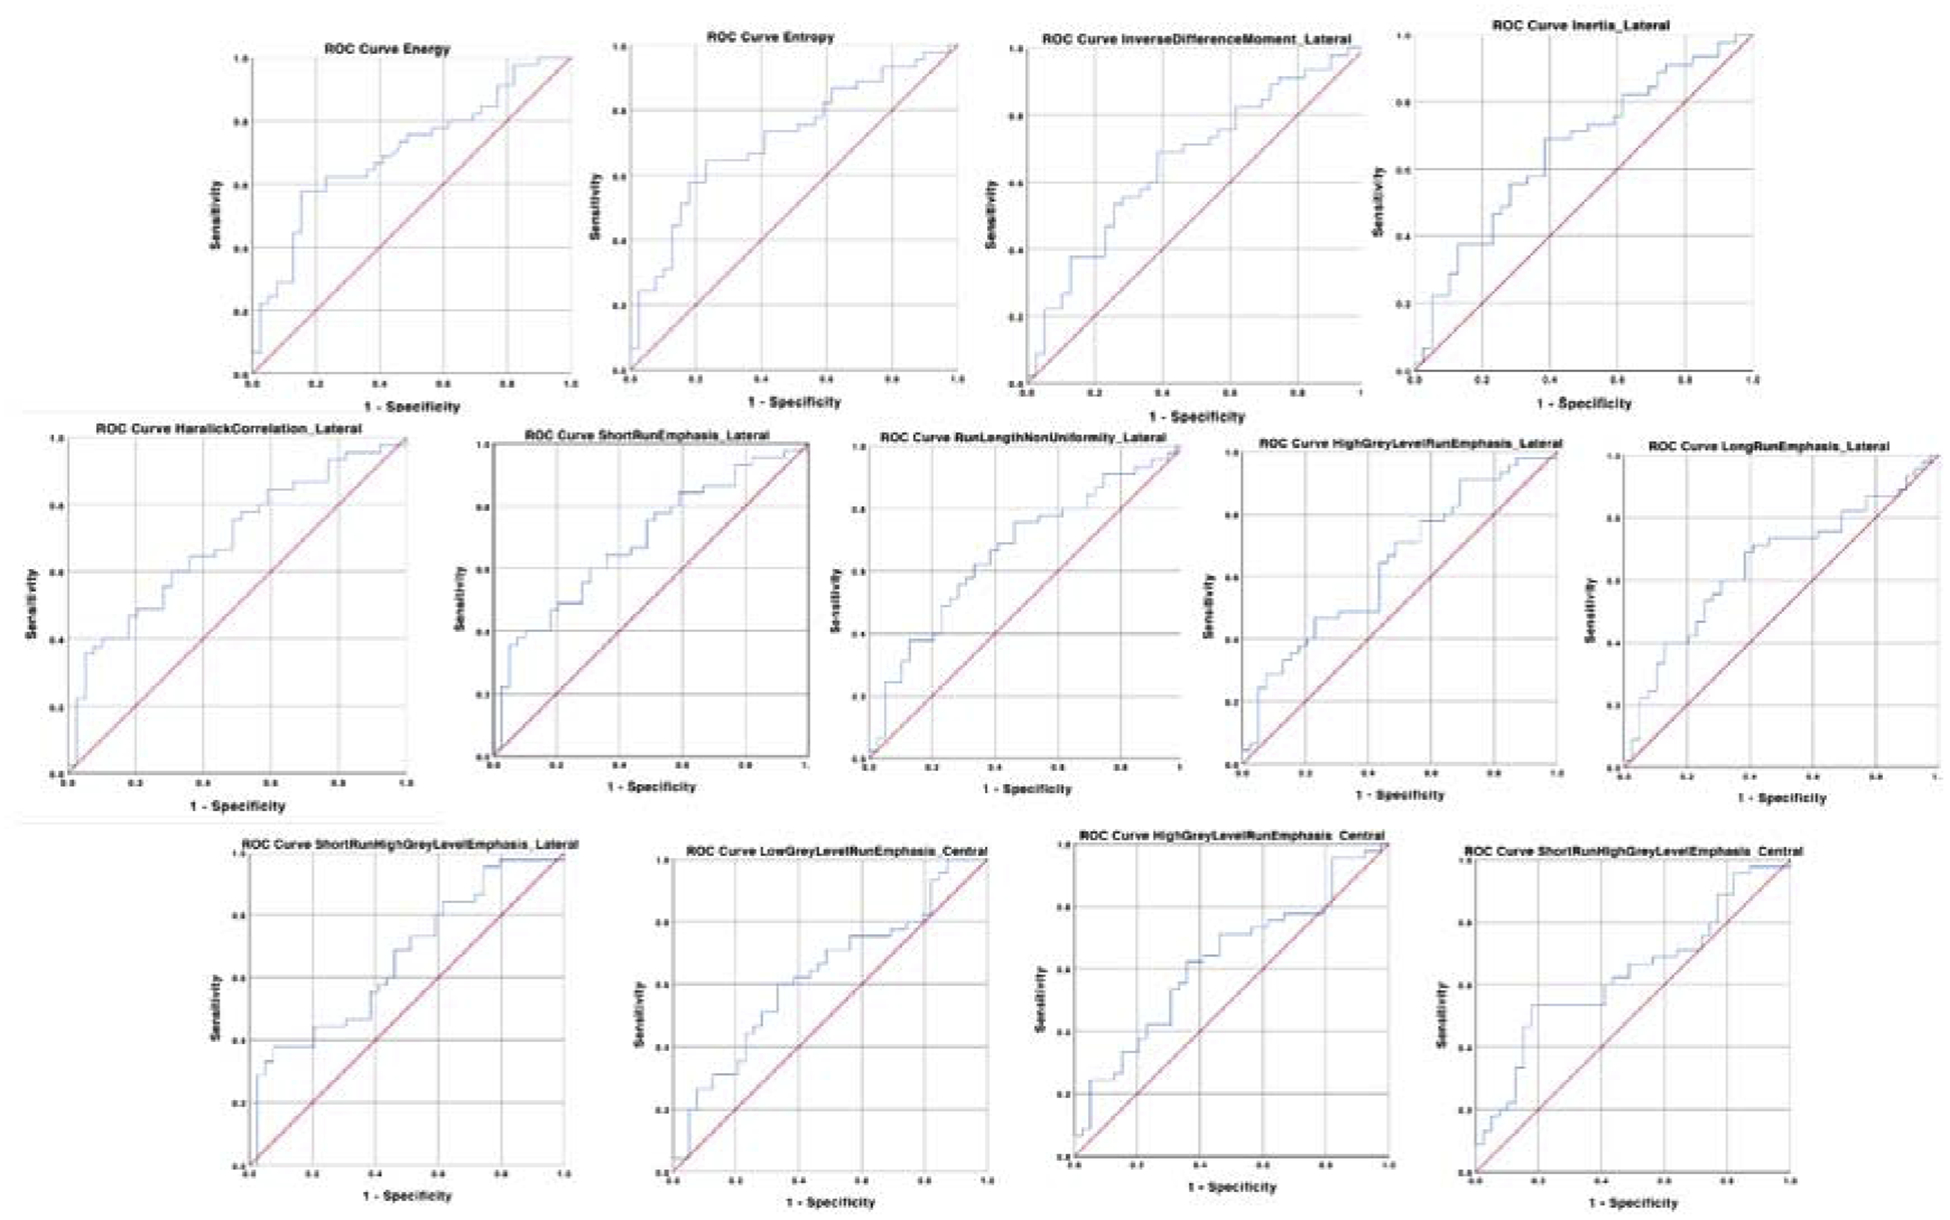
Bone degradation of the condylar surface is seen in temporomandibular joint osteoarthritis (TMJ OA); however, the initial changes occur in the subchondral bone. This cross-sectional study was performed to evaluate 23 subchondral bone imaging biomarkers for TMJ OA. The sample consisted of high-resolution cone beam computed tomography scans of 84 subjects, divided into two groups: TMJ OA (45 patients with TMJ OA) and control (39 asymptomatic subjects). Six regions of each mandibular condyle scan were extracted for computation of five bone morphometric and 18 grey-level texture-based variables. The groups were compared using the Mann-Whitney U-test, and the receiver operating characteristics (ROC) curve was determined for each variable that showed a statically significance difference. The results showed statistically significant differences in the subchondral bone microstructure in the lateral and central condylar regions between the control and TMJ OA groups (P< 0.05). The area under the ROC curve (AUC) for these variables was between 0.620 and 0.710. In conclusion, 13 imaging bone biomarkers presented an acceptable diagnostic performance for the diagnosis of TMJ OA, indicating that the texture and geometry of the subchondral bone microarchitecture may be useful for quantitative grading of the disease.

Keywords: biomarkers; cone beam computed tomography; osteoarthritis; temporomandibular joint.


Conflict of interest statement

Competing interests

The authors declare that there is no conflict of interest regarding the publication of this article.

Figures

Fig. 1.
Fig. 1.
Computational processing workflow. First, all the left hr-CBCT scans were mirrored to the right side using the ‘transforms’ tool in 3D Slicer software. The subsequent steps were as follows: (A) 3D Slicer software was used to convert the original hr-CBCT files to a compressed format. (B) ITK-Snap software was used to segment the entire condyle. (C) 3D Slicer was used to convert the segmented condyle volume to a 3D surface. (D) Using the ‘transform’ module in 3D Slicer, a spatial orientation for each 3D condyle model was made. (E) The spatial orientation matrix created in the last step was applied to the condyle scan. Each condyle had its proper orientation according to its orientation matrix. (F) Using the ‘crop-volume’ tool, six different regions of the condyle (anterior, posterior, lateral, medial, superior, and central) were selected. (G) Using the ‘BoneTexture’ module in 3D Slicer, all of the variables studied for each region of the condyle were computed.
Fig. 2.
Fig. 2.
Mandibular condyle orientation. (I) The ‘transforms’ tool of the 3D Slicer software was used to standardize the spatial orientation of the 3D condyles: (A) the condyle before orientation; (B) the condyle after orientation; (C) example of eight condyles oriented. Reference lines (red, green, and yellow) were used in the same spatial position for all condyles to allow a common spatial position for all condyles. In the lateral view, the yellow line was parallel to the condylar neck. In the posterior view, the red line connects the lateral and medial poles. In the superior view, the green line also connects the lateral and medial poles. (II) Volume of interest (VOI) extractions. After spatial orientation, the ‘crop-volume’ module in 3D Slicer was used to generate the VOIs: (A) selection of the anterior, posterior, and superior VOIs; (B) selection of the lateral, medial, and central VOIs; (C) example of the anterior region containing the greyscale information of that VOI; (D) 3D rendering to illustrate each VOI and the condylar region where it belongs. The criteria for the boundaries were as follows: for the lateral, medial, posterior, superior, and anterior VOIs, the rectangular prism starts in the most external condylar bone and extends in the direction of the trabecular condyle center; for the central VOI, the cube is positioned in the central region of the trabecular bone.
Fig. 3.
Fig. 3.
Summary illustration showing the biomarkers that were statistically significant (P < 0.05) in the Mann-Whitney analysis. Only the central and lateral regions showed significant differences between the osteoarthritis and control groups.
Fig. 4.
Fig. 4.
Receiver operating characteristics (ROC) curves for detecting osteoarthritis. Diagnostic performance of each variable.

References

    1. Glyn-Jones S, Palmer AJR, Agricola R, et al. Osteoarthritis. Lancet 2015: 386: 376–387. doi: 10.1016/S0140-6736(14)60802-3 - DOI - PubMed
    1. Rando C, Waldron T. TMJ osteoarthritis: a new approach to diagnosis. Am J Phys Anthropol 2012: 148: 45–53. doi: 10.1002/ajpa.22039 - DOI - PubMed
    1. Abramson SB, Attur M. Developments in the scientific understanding of osteoarthritis. Arthritis Res Ther 2009: 11: 227. doi: 10.1186/ar2655 - DOI - PMC - PubMed
    1. Schiffman E, Ohrbach R, Truelove E, et al. Diagnostic criteria for temporomandibular disorders (DC/TMD) for clinical and research applications: recommendations of the International RDC/TMD Consortium Network and Orofacial Pain Special Interest Group. J Oral Facial Pain Headache 2014: 8: 6–27. doi: 10.11607/jop.1151 - DOI - PMC - PubMed
    1. Wenham CYJ, Grainger AJ, Conaghan PG. The role of imaging modalities in the diagnosis, differential diagnosis and clinical assessment of peripheral joint osteoarthritis. Osteoarthritis Cartilage 2014: 22: 1692–1702. doi: 10.1016/J.JOCA.2014.06.005 - DOI - PubMed