

Plant Hosts Modify Belowground Microbial Community Response to Extreme Drought
- PMID: 32606021
- PMCID: PMC7329318
- DOI: 10.1128/mSystems.00092-20
Plant Hosts Modify Belowground Microbial Community Response to Extreme Drought
Abstract
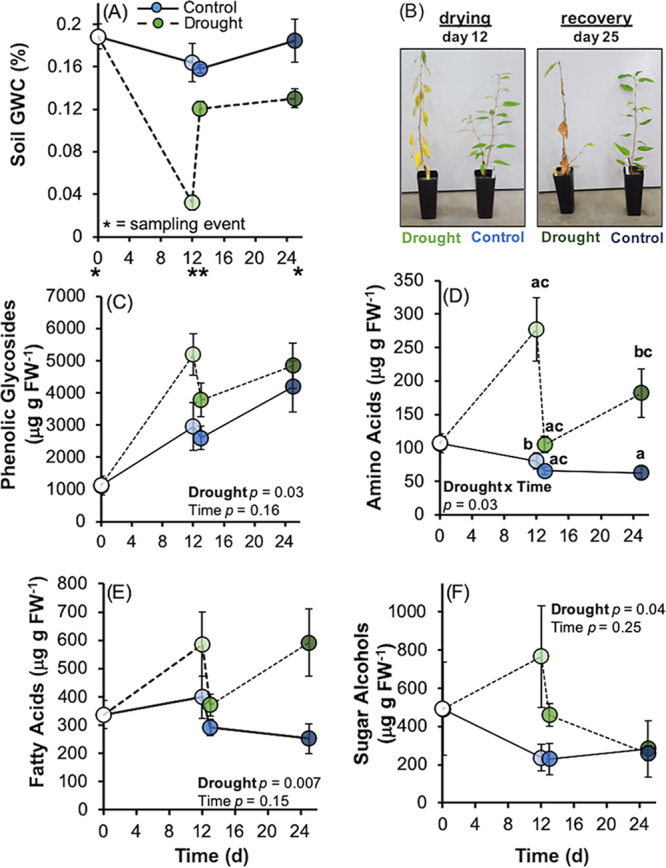
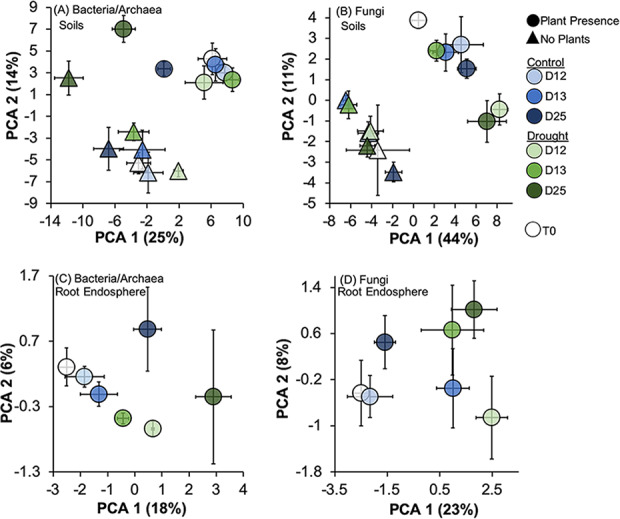
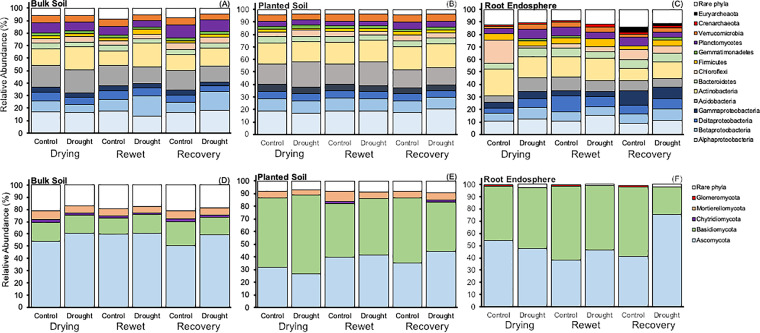
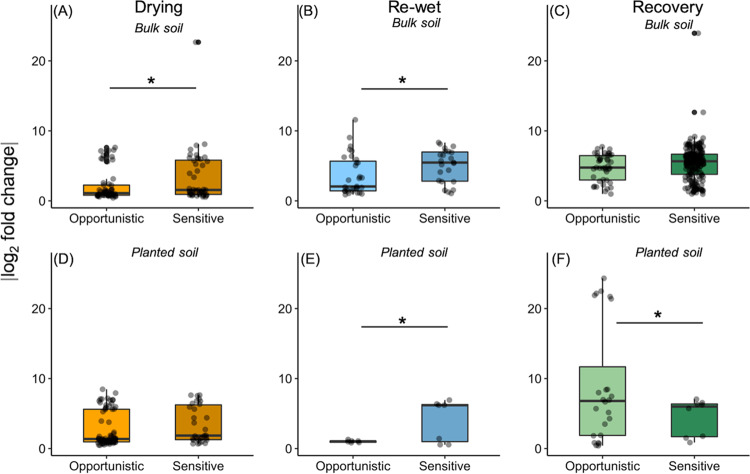
Drought stress negatively impacts microbial activity, but the magnitude of stress responses is likely dependent on a diversity of belowground interactions. Populus trichocarpa individuals and no-plant bulk soils were exposed to extended drought (∼0.03% gravimetric water content [GWC] after 12 days), rewet, and a 12-day "recovery" period to determine the effects of plant presence in mediating soil microbiome stability to water stress. Plant metabolomic analyses indicated that drought exposure increased host investment in C and N metabolic pathways (amino acids, fatty acids, phenolic glycosides) regardless of recovery. Several metabolites positively correlated with root-associated microbial alpha-diversity, but not those of soil communities. Soil bacterial community composition shifted with P. trichocarpa presence and with drought relative to irrigated controls, whereas soil fungal composition shifted only with plant presence. However, root fungal communities strongly shifted with drought, whereas root bacterial communities changed to a lesser degree. The proportion of bacterial water-stress opportunistic operational taxonomic units (OTUs) (enriched counts in drought) was high (∼11%) at the end of drying phases and maintained after rewet and recovery phases in bulk soils, but it declined over time in soils with plants present. For root fungi, opportunistic OTUs were high at the end of recovery in drought treatments (∼17% abundance), although relatively not responsive in soils, particularly planted soils (<0.5% abundance for sensitive or opportunistic). These data indicate that plants modulate soil and root-associated microbial drought responses via tight plant-microbe linkages during extreme drought scenarios, but trajectories after extreme drought vary with plant habitat and microbial functional groups.IMPORTANCE Climate change causes significant alterations in precipitation and temperature regimes that are predicted to become more extreme throughout the next century. Microorganisms are important members within ecosystems, and how they respond to these changing abiotic stressors has large implications for the functioning of ecosystems, the recycling of nutrients, and the health of the aboveground plant community. Drought stress negatively impacts microbial activity, but the magnitude of this stress response may be dependent on above- and belowground interactions. This study demonstrates that beneficial associations between plants and microbes can enhance tolerance to abiotic stress.
Keywords: Populus; bacteria; drought; fungi.
Figures
References
-
- Oliver RJ, Finch JW, Taylor G. 2009. Second generation bioenergy crops and climate change: a review of the effects of elevated atmospheric CO2 and drought on water use and the implications for yield. Glob Change Biol Bioenergy 1:97–114. doi:10.1111/j.1757-1707.2009.01011.x. - DOI
-
- Tuck G, Glendining MJ, Smith P, House JI, Wattenbach M. 2006. The potential distribution of bioenergy crops in Europe under present and future climate. Biomass Bioenergy 30:183–197. doi:10.1016/j.biombioe.2005.11.019. - DOI
LinkOut - more resources
Full Text Sources
