. 2020 Jun 30;11(1):3093.
doi: 10.1038/s41467-020-16834-0.

The increasing likelihood of temperatures above 30 to 40 °C in the United Kingdom

Affiliations

The increasing likelihood of temperatures above 30 to 40 °C in the United Kingdom

Nikolaos Christidis et al. Nat Commun. .

Abstract

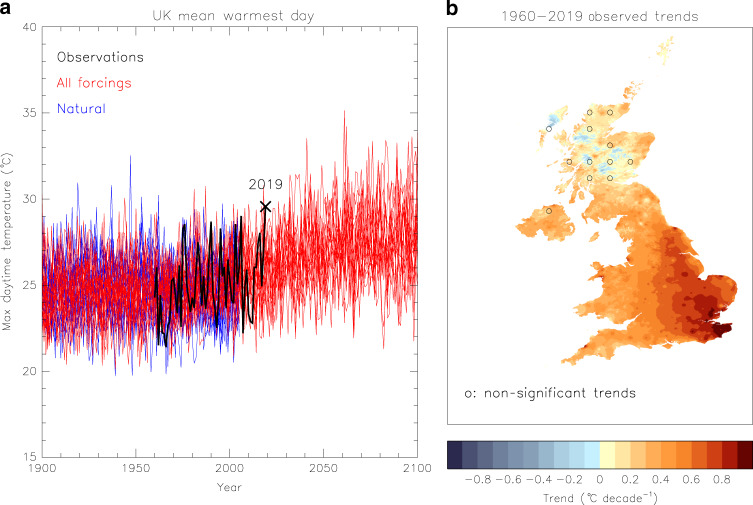
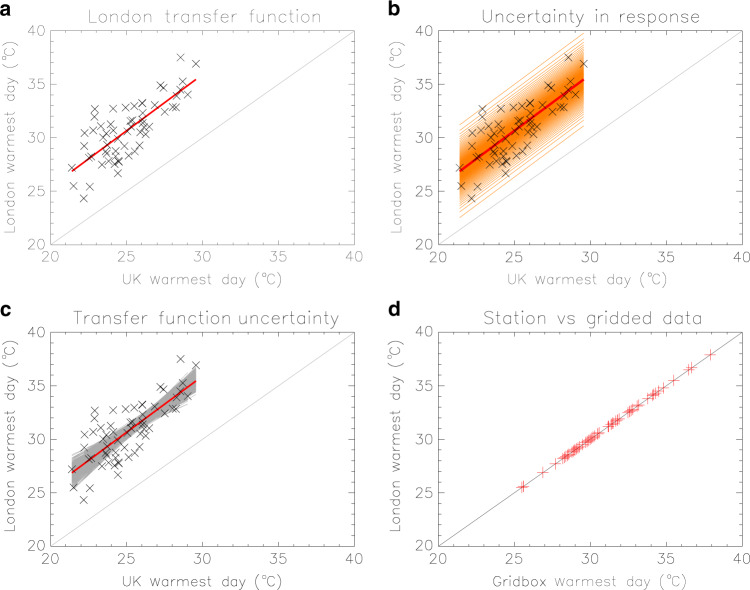
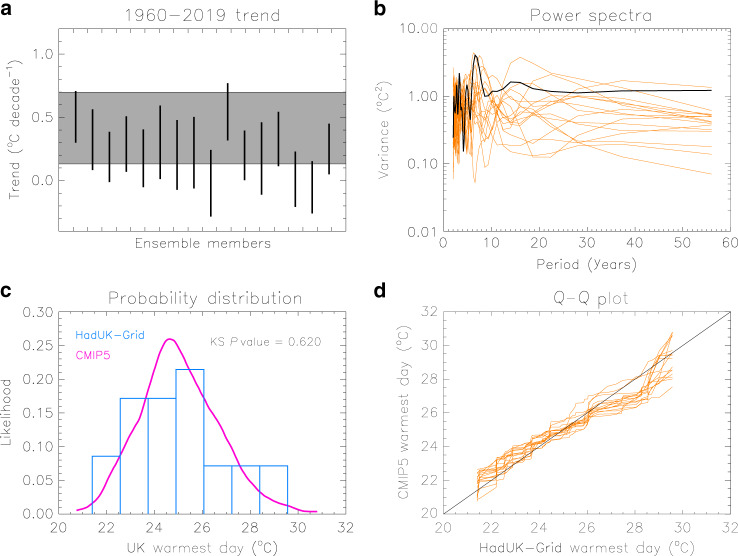
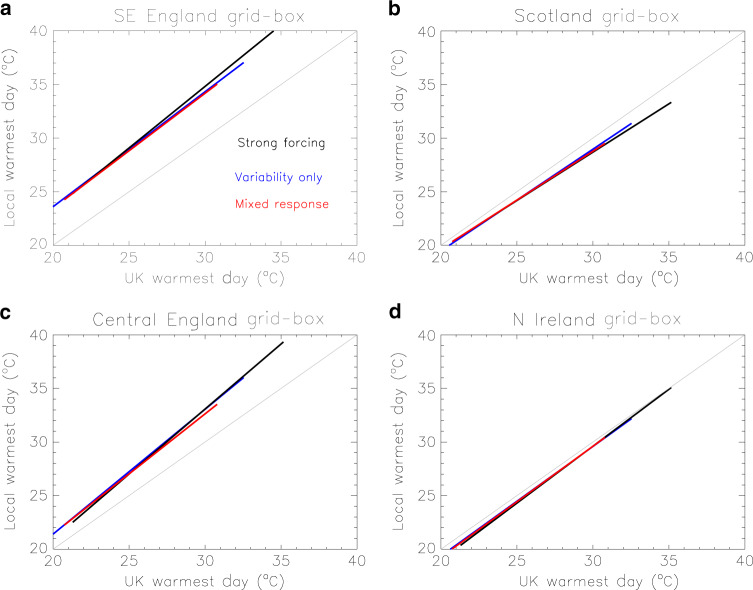
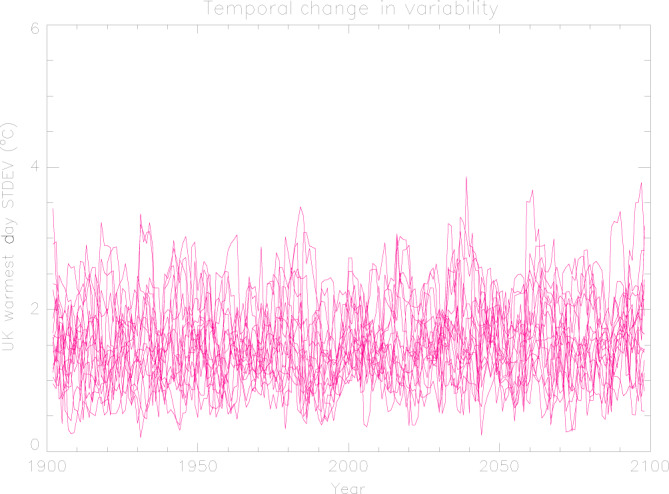
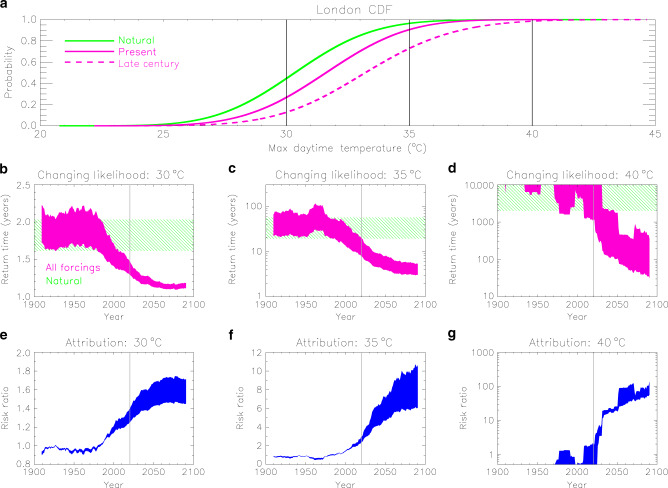
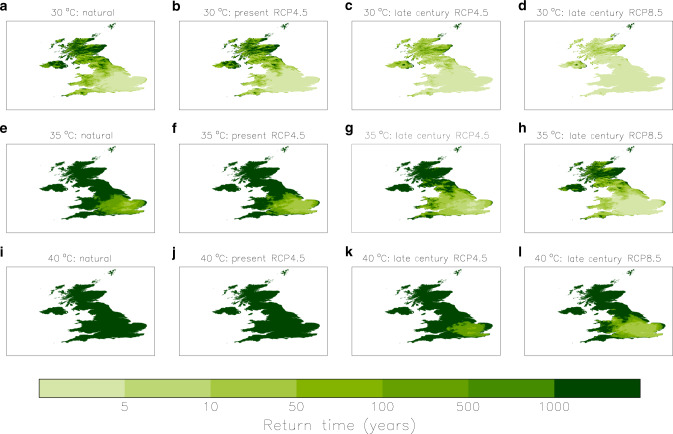
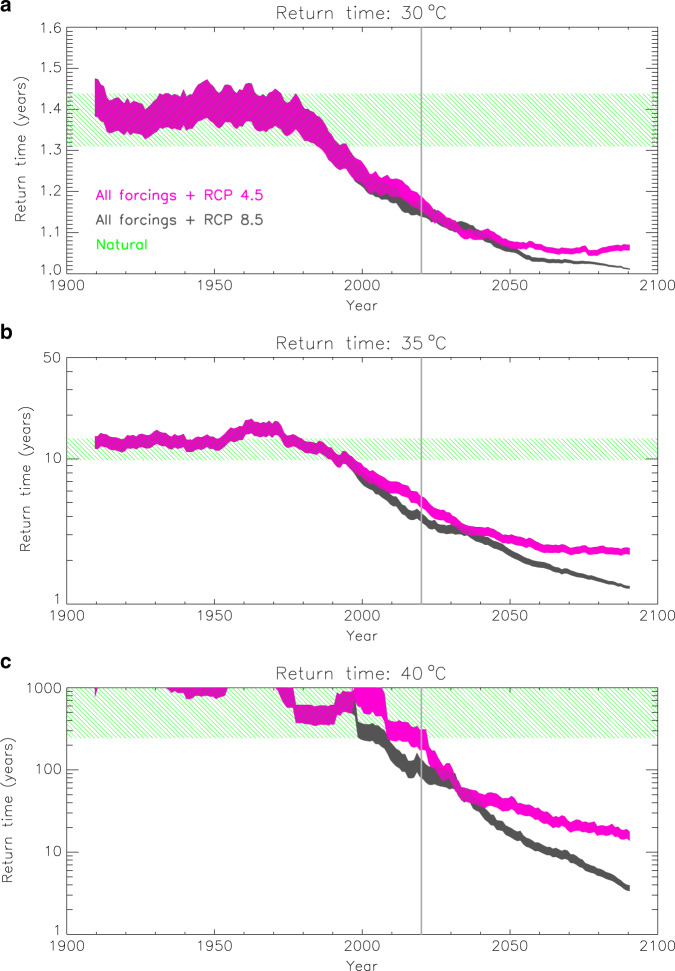
As European heatwaves become more severe, summers in the United Kingdom (UK) are also getting warmer. The UK record temperature of 38.7 °C set in Cambridge in July 2019 prompts the question of whether exceeding 40 °C is now within reach. Here, we show how human influence is increasing the likelihood of exceeding 30, 35 and 40 °C locally. We utilise observations to relate local to UK mean extremes and apply the resulting relationships to climate model data in a risk-based attribution methodology. We find that temperatures above 35 °C are becoming increasingly common in the southeast, while by 2100 many areas in the north are likely to exceed 30 °C at least once per decade. Summers which see days above 40 °C somewhere in the UK have a return time of 100-300 years at present, but, without mitigating greenhouse gas emissions, this can decrease to 3.5 years by 2100.


Conflict of interest statement

The authors declare no competing interests.

Figures

Fig. 1
Fig. 1. Warmest daytime temperatures (tx01) in the UK.
a Timeseries of the UK mean tx01 from HadUK-Grid observations (black line), and simulations with 16 CMIP5 models with all climatic forcings (red lines) and natural forings only (blue lines). The observed value in 2019 is marked with a cross. Simulations of future years follow the RCP 4.5 scenario. The model data were bias-corrected to have the same mean during a reference period as the observations. b A map of the tx01 trends during 1960–2019 computed with HadUK-Grid data. Circles mark areas (of ~60 × 60 km) where most grid boxes have trends not significantly different from zero (tested at the 10% level), as determined by a Mann–Kendall test.
Fig. 2
Fig. 2. Transfer functions for the estimation of the local warmest daytime temperature (tx01).
An example for a grid-box in London. a Local observations of tx01 plotted against the UK mean observed values (crosses). A linear fit to the data (red line) represents the transfer function for the grid-box. b Inclusion of the confidence bounds for the response variable (orange lines) leads to a set of a 100 transfer functions in total. c A bootstrapping procedure applied to the observed data (crosses) provides alternative transfer functions (grey lines), used to assess the effect of sampling uncertainty. For each of the grey lines, a set of 100 transfer functions can be obtained as shown in panel b. d Observed tx01 data from a station within the reference grid-box agree well with the HadUK-Grid data.
Fig. 3
Fig. 3. Model evaluation.
a The ±2 standard deviation range of the 1960–2019 trend (°C decade−1) in the UK mean warmest daytime temperature (tx01) estimated with HadUK-Grid observations (grey band) and CMIP5 model simulations with all forcings (vertical bars). b Power spectra from detrended timeseries of the UK mean tx01 computed with observations (black line) and model simulations (orange lines). c Normalised distributions of the UK mean tx01 in period 1960–2019 from observations (blue histogram) and aggregated data from the all-forcing simulations (pink line). The P-value of a Kolmogorov–Smirnov test that assesses whether the two distributions are significantly different is also shown. d Quantile–quantile (Q–Q) plots for each of the 16 models, comparing the simulated and the observed UK mean tx01 distributions.
Fig. 4
Fig. 4. Transfer functions derived from the 16 models.
Functions computed with simulations with all external forcings and training periods 2020–2100 (strong forcing) and 1960–2019 (mixed response) are shown in black and red, respectively. Functions from simulations with natural forcings only (variability only) are shown in blue. Each panel corresponds to a different grid-box.
Fig. 5
Fig. 5. Timeseries of the standard deviation of the UK mean warmest daytime temperature (tx01) constructed with each of the 16 models.
The standard deviation was computed in 5-year rolling windows after subtracting the forced response from model simulations with all forcings.
Fig. 6
Fig. 6. Increasing chance of high-threshold exceedance illustrated for a location in London.
a Cumulative distribution functions of the local warmest daytime temperature (tx01) for the natural climate (green line), the present-day climate (pink solid line) and the climate of the late twenty-first century (pink dashed line). The 30, 35 and 40 °C thresholds are marked by the vertical black lines. Panels b-d show timeseries of the return time (inverse probability) for the exceedance of the three thresholds with all forcings (in pink). The thickness of the timeseries illustrates the uncertainty in the transfer functions used in the analysis. The expected range in the natural climate is marked in green. Panels eg show timeseries of the risk ratio (in blue) for the three thresholds, measuring the change in the likelihood of exceeding the threshold relative to the natural climate. The thickness of the timeseries represents the 5–95% uncertainty range. The vertical grey lines in panels bg mark year 2020 (i.e., the present climate).
Fig. 7
Fig. 7. The changing likelihood of locally exceeding high thresholds of the warmest daytime temperature (tx01) in the UK.
Maps of the return time for tx01 going above 30 °C (panels ad), 35 °C (eh) and 40 °C (il) in the natural climate (panels a, e, i), the present climate (b, f, j), and the climate of the late twenty-first century simulated with the RCP 4.5 (c, g, k) and RCP 8.5 scenarios (d, h, l).
Fig. 8
Fig. 8. The increasing likelihood of exceeding high temperature thresholds anywhere in the UK.
Timeseries of the return time for observing temperatures in the UK above a 30 °C, b 35 °C and c 40 °C with all forcings and future projections following the RCP 4.5 (in pink) and RCP 8.5 (in grey) scenarios. The thickness of the timeseries illustrates the uncertainty in the transfer functions used in the analysis. The expected range in the natural climate is marked in green. The vertical grey lines mark year 2020 (i.e., the present climate).

References

    1. Seneviratne SI, Donat M, Mueller B, Alexander LV. No pause in the increase of hot temperature extremes. Nat. Clim. Change. 2014;4:161–163. doi: 10.1038/nclimate2145. - DOI
    1. Christidis N, Mitchell D, Stott PA. Anthropogenic climate change and heat effects on health. Int. J. Climatol. 2019;39:4751–4768. doi: 10.1002/joc.6104. - DOI
    1. Christidis N, Donaldson GC, Stott PA. Causes for the recent changes in cold-related and heat-related mortality in England and Wales. Clim. Change. 2010;102:539–553. doi: 10.1007/s10584-009-9774-0. - DOI
    1. Easterling DR, et al. Climate extremes: observations, modelling and impacts. Science. 2000;289:2068–2074. doi: 10.1126/science.289.5487.2068. - DOI - PubMed
    1. Carleton TA, Hsiang SM. Social and economic impacts of climate. Science. 2016;353:6304. doi: 10.1126/science.aad9837. - DOI - PubMed

Publication types