. 2020 Jun 30;11(1):3279.
doi: 10.1038/s41467-020-17047-1.

Structural characterization of a novel human adeno-associated virus capsid with neurotropic properties

Affiliations

Structural characterization of a novel human adeno-associated virus capsid with neurotropic properties

Hung-Lun Hsu et al. Nat Commun. .

Abstract

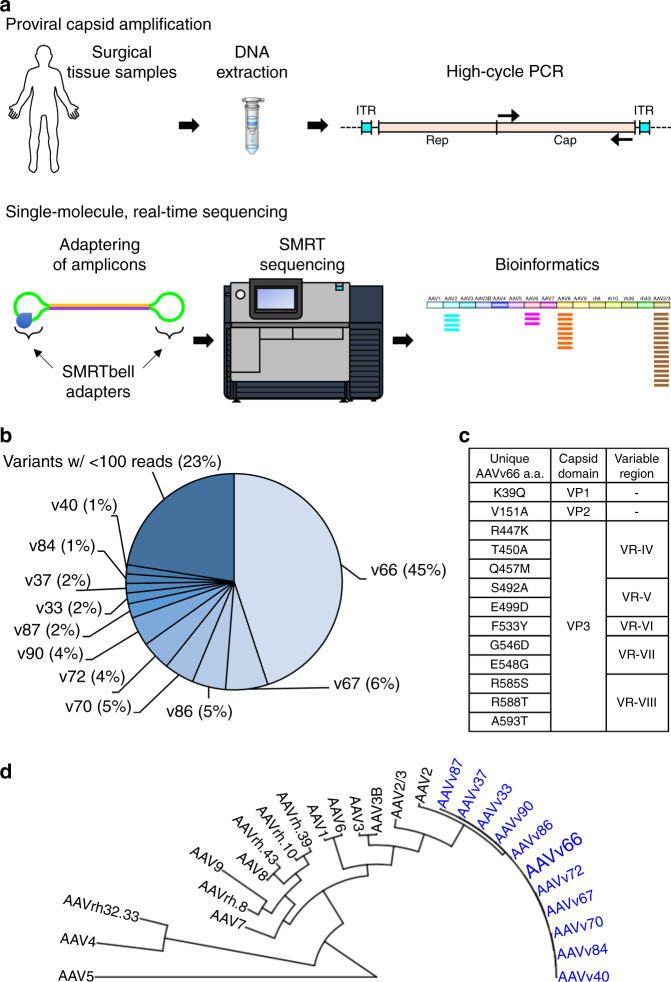
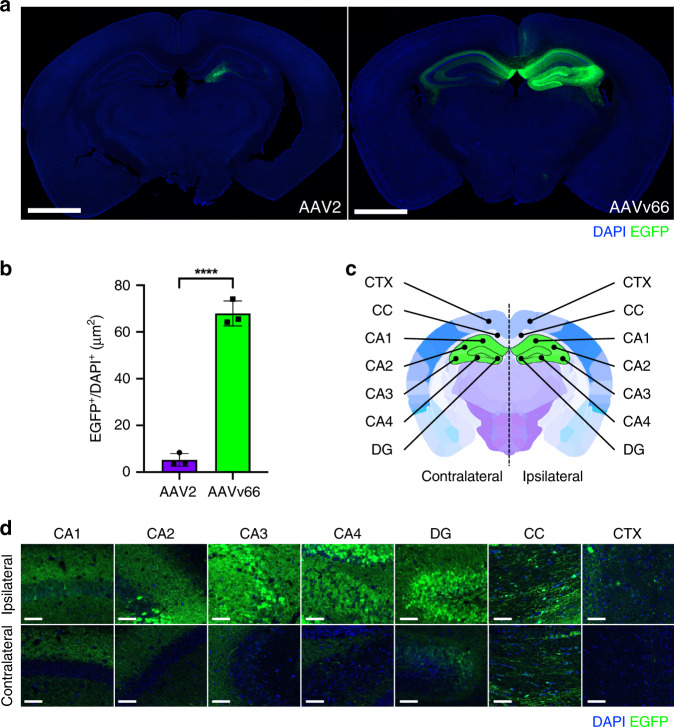
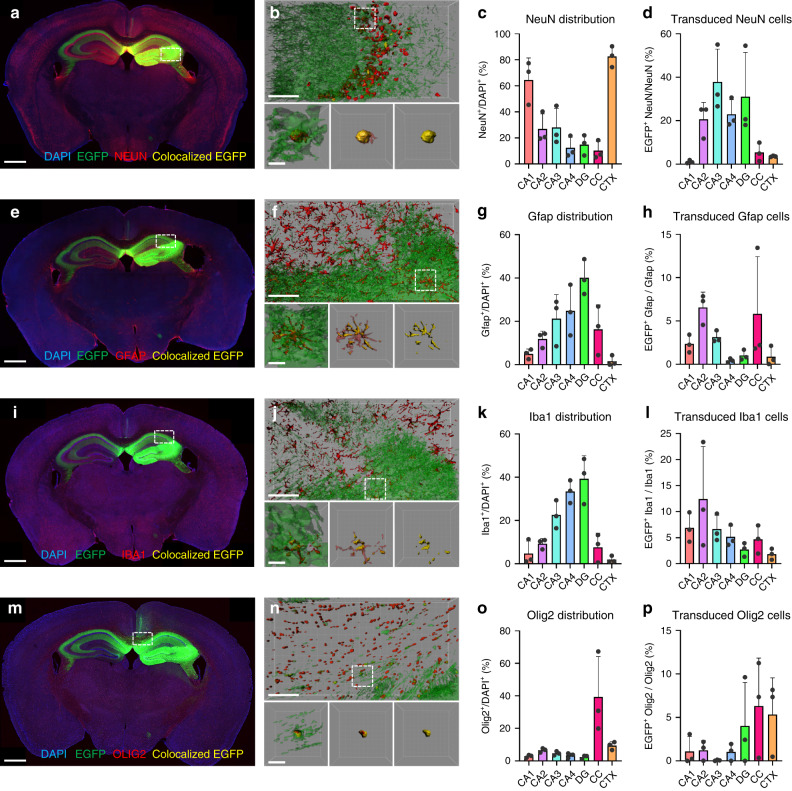
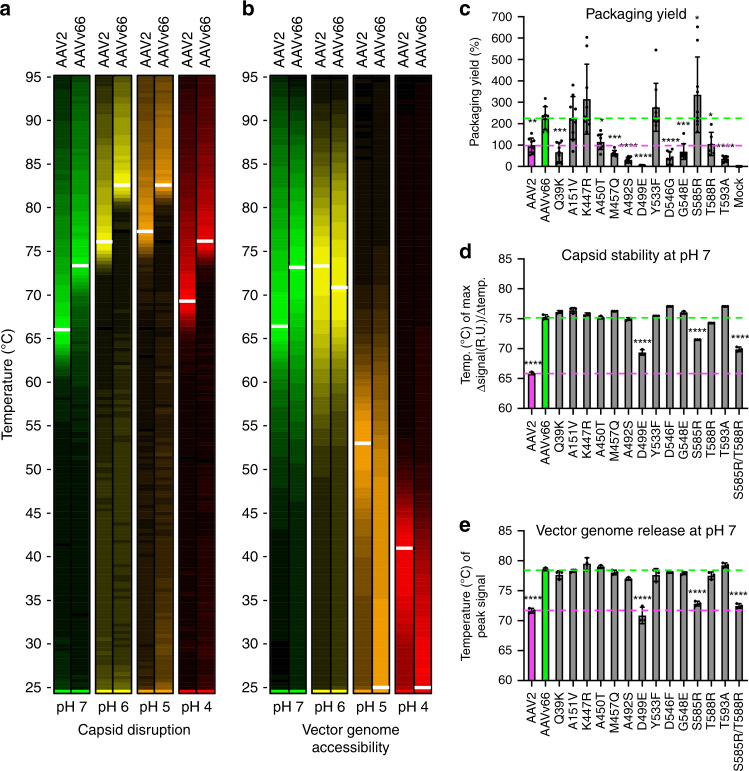
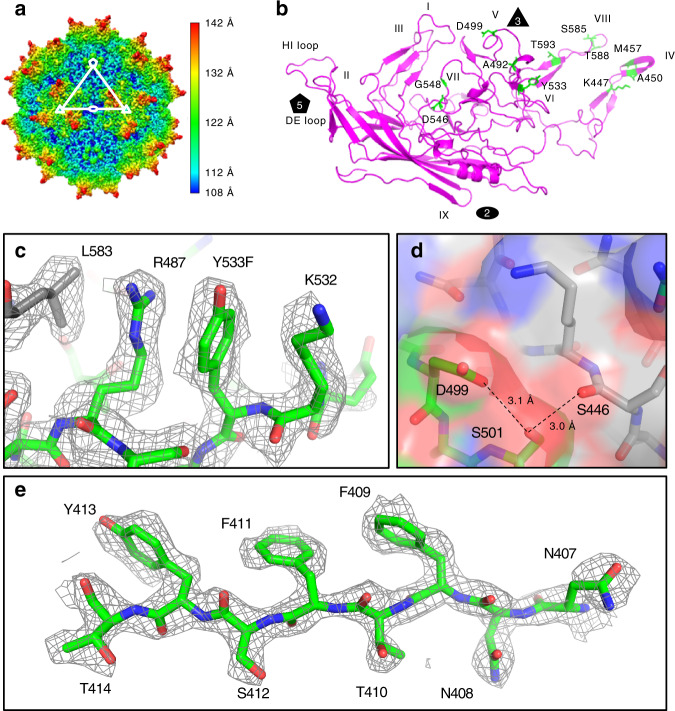
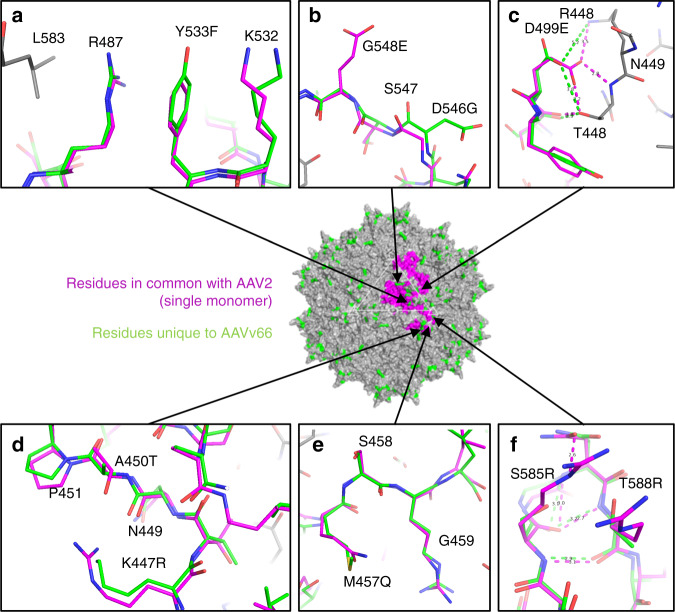
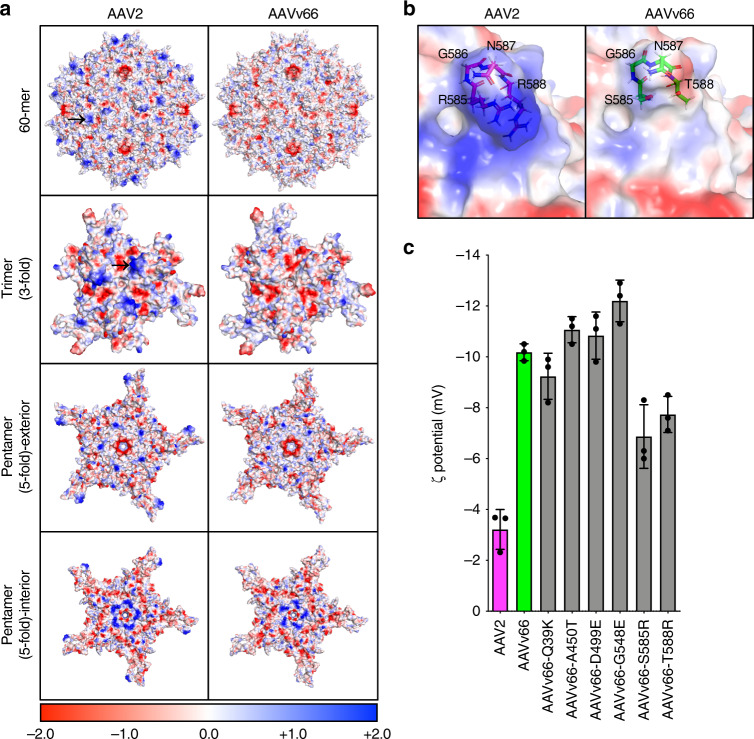
Recombinant adeno-associated viruses (rAAVs) are currently considered the safest and most reliable gene delivery vehicles for human gene therapy. Three serotype capsids, AAV1, AAV2, and AAV9, have been approved for commercial use in patients, but they may not be suitable for all therapeutic contexts. Here, we describe a novel capsid identified in a human clinical sample by high-throughput, long-read sequencing. The capsid, which we have named AAVv66, shares high sequence similarity with AAV2. We demonstrate that compared to AAV2, AAVv66 exhibits enhanced production yields, virion stability, and CNS transduction. Unique structural properties of AAVv66 visualized by cryo-EM at 2.5-Å resolution, suggest that critical residues at the three-fold protrusion and at the interface of the five-fold axis of symmetry likely contribute to the beneficial characteristics of AAVv66. Our findings underscore the potential of AAVv66 as a gene therapy vector.


Conflict of interest statement

G.G. is a scientific co-founder of Voyager Therapeutics and holds equity in the company. G.G. is an inventor on patents with potential royalties licensed to Voyager Therapeutics and other biopharmaceutical companies. G.G. and D.J.G. are scientific co-founders of Aspa Therapeutics Inc., and hold equity in the company. G.G. and D.J.G. are inventors on patents with potential royalties licensed to Aspa Therapeutics Inc., and other biopharmaceutical companies. Remaining authors declare no competing interests.

Figures

Fig. 1
Fig. 1. Identification of a novel proviral AAV capsid sequences from a human surgical sample.
a AAV capsid proviral sequences were first PCR amplified from a human surgical sample using primers that flank the AAV cap ORF. Amplicons were subjected to single molecule, real-time (SMRT) sequencing and the resulting reads were analyzed by BWA-MEM alignment to contemporary AAV serotype sequences, InDelFixer to remove insertion/deletions related to PCR or SMRT sequencing errors, and de novo assembly to cluster reads of high sequence similarity. b The cap sequence of variant AAVv66 was found to be the most abundant in the analysis (45%). c Summary of the 13 unique residues in the AAVv66 capsid sequence that are different from AAV2. d Phylogenetic tree of AAV2 variants reported in this study (blue) and contemporary serotypes.
Fig. 2
Fig. 2. Transduction spread of rAAV2 and rAAVv66 following intrahippocampal injection.
a Representative native EGFP (green) expression following rAAV2-CB6-PI-EGFP or rAAVv66-CB6-PI-EGFP injection via unilateral intrahippocampal administration. Scale bars = 700 μm. b Quantification of EGFP-positive surface normalized to DAPI-positive surface from panel a data. Data are presented as the mean ± SD; n = 3 animals/group from one experiment. ****P < 0.0001, two-tailed Student’s t test. c Coronal brain schematic depicting sub-anatomical regions of interest in both contralateral and ipsilateral hemispheres (adapted from Allen Mouse Brain Atlas). Cornu ammonis (CA1–CA4), dentate gyrus (DG), corpus callosum (CC), and cortex (CTX). d Representative high-magnification images of rAAVv66 transduced sub-anatomical regions from n = 3 animals from one experiment. Scale bars = 50 μm.
Fig. 3
Fig. 3. Transduction of major cell types of the brain by rAAVv66.
a, e, i, m Coronal sections of rAAVv66-CB6-PI-EGFP transduced mouse brains. IF-stained sections (red) with antibodies against NEUN (a, neurons), GFAP (e, astrocytes), IBA1 (i, microglia), or OLIG2 (m, oligodendrocytes) indicate the distribution of cell types across the brain. Native EGFP expression (green) that colocalize with IF staining (yellow) reveal the positively transduced cell type indicated. Scale bars = 700 μm. b, f, j, n 3D rendering of sub-anatomical regions of single representative frames from dashed line rectangle boxes within coronal section views (top panels) with single-cell representations from fields defined by dashed lined square boxes (bottom three panels). Left panels, total area EGFP and cell marker IF stains; center panels, colocalized EGFP with total cell marker IF stains; right panels, colocalized EGFP and cell marker IF stains. Scale bars = 50 μm (top panels), 5 μm (bottom three panels). c, g, k, o Quantification of cell type-specific IF staining across indicated hippocampal regions (x-axes), normalized to DAPI signal. d, h, l, p Quantification of cell type-specific transduction across indicated regions, normalized to total cell-type IF and DAPI signal. Data are presented as the mean ± SD, n = 3 animals/group from one experiment. Cornu ammonis (CA1–CA4), dentate gyrus (DG), corpus callosum (CC), and cortex (CTX).
Fig. 4
Fig. 4. Biophysical analyses of AAVv66.
a, b Heatmap displays of differential scanning fluorimetry (DSF) analyses to query (a) capsid protein unfolding (uncoating) and (b) DNA accessibility (vector genome extrusion) at pHs 7, 6, 5, and 4. Color scaling depicted represent relative peak signals from highest to lowest value (brightest to dimmest, respectively). ce Each defining amino acid residue of AAVv66 was converted to those of AAV2 by site-directed mutagenesis and examined for changes in c packaging yield, d capsid stability, and e genome release at pH 7. Values represent mean ± SD. p Values were determined by one-way ANOVA. *p < 0.05, **p < 0.01, ***p < 0.001, ****p < 0.0001. n = 3/group.
Fig. 5
Fig. 5. Cryo-EM primary metrics, map reconstruction, and model generation of AAVv66.
a Density map of AAVv66. Color scheme demarcates the topological distance from the center (Å). b Ribbon structure of the refined AAVv66 capsid monomer. Amino acids differing from AAV2 are highlighted in green. The twofold (oval), threefold (triangle), and fivefold (pentagon) symmetries are annotated. Part of AAVv66 electron density (dark grey mesh) and residues (green for one monomer and grey for neighboring monomers) are shown for regions close to c L583, R487, Y533, and K532, d S446, D499, and S501, and e N407-T414.
Fig. 6
Fig. 6. Structural differences between AAVv66 and AAV2.
At the center is the AAVv66 60-mer structure (grey). Amino acid residues unique to AAVv66 are highlighted in green, while amino acid residues for a single monomer that are in common with AAV2 are colored in magenta. ae Atomic models showing residue side chains of select regions with substantial difference between AAVv66 and AAV2. The alignments were made using monomers of AAV2 (1lp3) and AAVv66, with modeled side chains from neighboring residues displayed in grey. Annotations for amino acids shown are indicated as those belonging to AAVv66, the position number, and then AAV2. c, f Distances between atoms of interest are indicated by dashed lines (AAV2, magenta; AAVv66, green) and reported in angstroms (Å). Distance measurements were conducted in PyMOL and are also reported in Supplementary Table 3.
Fig. 7
Fig. 7. Differential capsid surface electrostatics between AAV2 and AAVv66.
a Surface positive (blue) and negative (red) charges are displayed for AAV2 and AAVv66 60-mer, trimer (threefold symmetry), and pentamers (exterior and interior of the fivefold symmetry) structures. Black arrows at the AAV2 60-mer and trimer structures indicate the approximate positions of R585 and R588 at a single threefold protrusion. The color scale bar represents the electrostatic potential on the solvent accessible surface in kT/e units. b Zoom-in of amino acid residues at 585–588 of AAV2 and AAVv66. c Bar graphs of the zeta potentials of purified vectors as measured by a Zetasizer. Values represent mean ± SD, n = 3.

References

    1. Muzyczka N, Berns K. Parvoviridae: the viruses and their replication. Fields Virol. 2001;2:2327–2359.
    1. Wang, D., Tai, P. W. L. & Gao, G. Adeno-associated virus vector as a platform for gene therapy delivery. Nat. Rev. Drug Discov. 10.1038/s41573-019-0012-9 (2019). - PMC - PubMed
    1. Ogden PJ, Kelsic ED, Sinai S, Church GM. Comprehensive AAV capsid fitness landscape reveals a viral gene and enables machine-guided design. Science. 2019;366:1139–1143. - PMC - PubMed
    1. Venkatakrishnan B, et al. Structure and dynamics of adeno-associated virus serotype 1 VP1-unique N-terminal domain and its role in capsid trafficking. J. Virol. 2013;87:4974–4984. - PMC - PubMed
    1. Grieger JC, Johnson JS, Gurda-Whitaker B, Agbandje-McKenna M, Samulski RJ. Surface-exposed adeno-associated virus Vp1-NLS capsid fusion protein rescues infectivity of noninfectious wild-type Vp2/Vp3 and Vp3-only capsids but not that of fivefold pore mutant virions. J. Virol. 2007;81:7833–7843. - PMC - PubMed

Publication types

MeSH terms