. 2020 Oct;125(4):253-268.
doi: 10.1038/s41437-020-0333-9. Epub 2020 Jun 30.

The wave of gene advance under diverse systems of mating

Affiliations

The wave of gene advance under diverse systems of mating

Xin-Xin Zhang et al. Heredity (Edinb). 2020 Oct.

Abstract

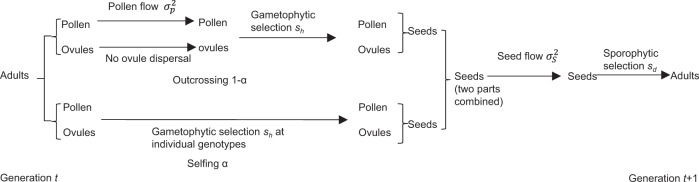
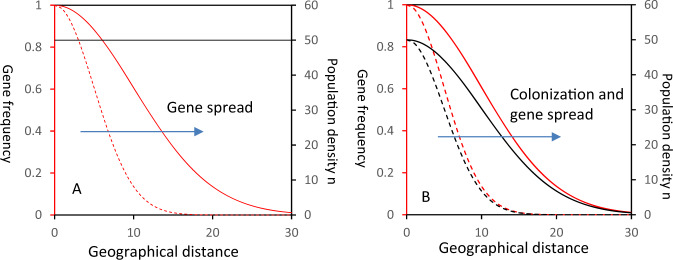
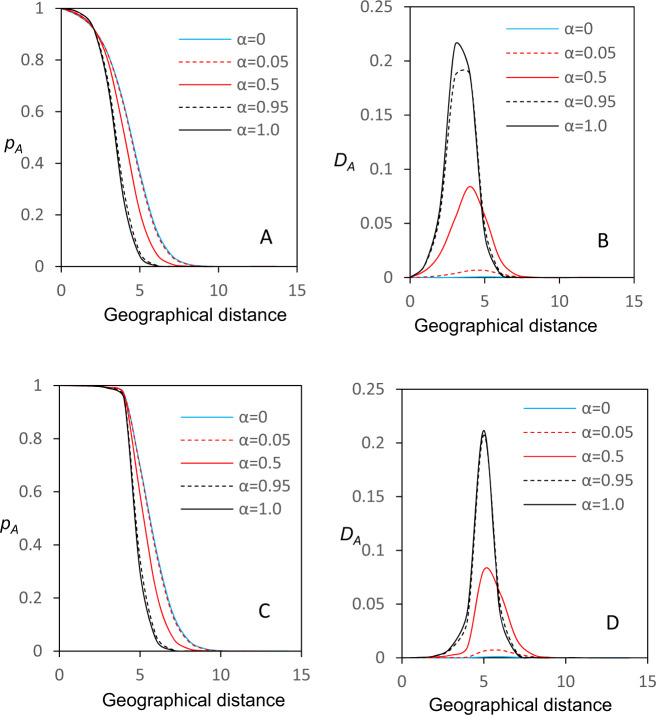
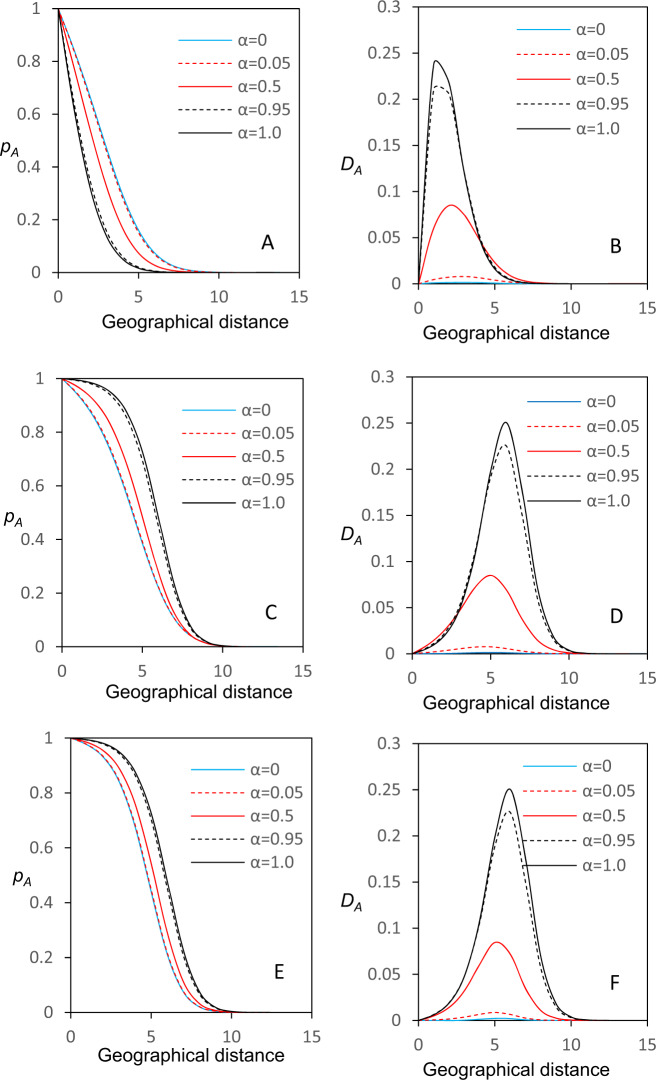
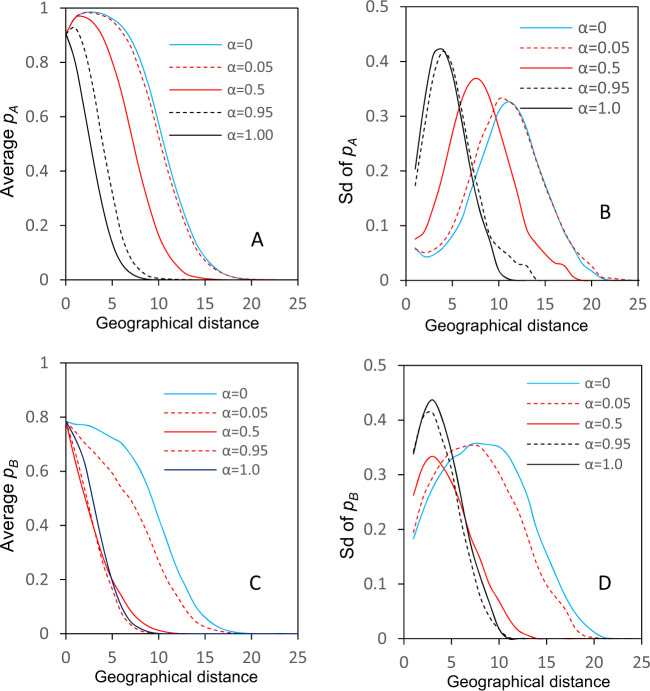
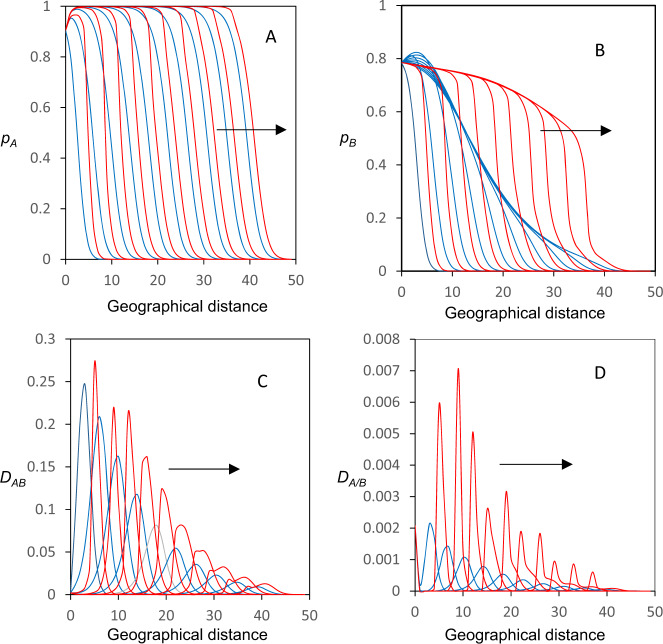
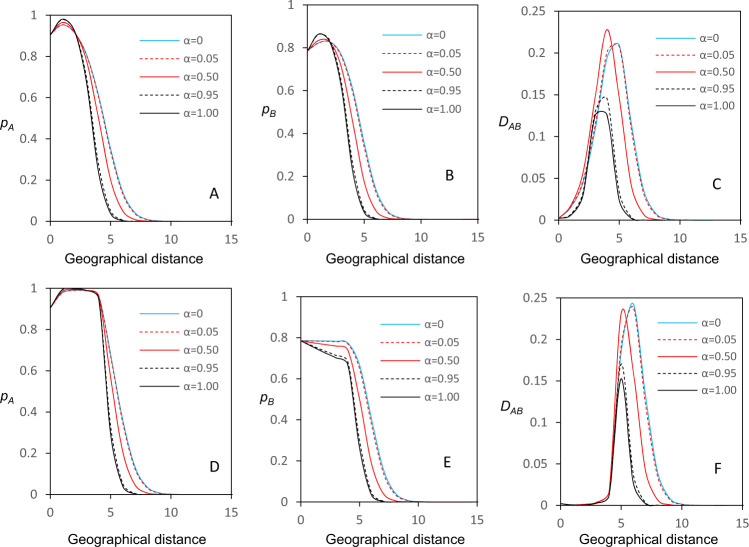
Mating systems will influence gene spread across the natural distribution of a plant species. Existing theories have not fully explored the role of mating systems on the wave of advance of an advantageous gene. Here, we develop a theory to account for the rate of spread of both advantageous and neutral genes under different mating systems, based on migration-selection processes. We show that a complex relationship exists between selfing rate and the speed of gene spread. The interaction of selfing with gametophytic selection shapes the traveling wave of the advantageous gene. Selfing can impede (or enhance) the spread of an advantageous gene in the presence (or absence) of gametophytic selection. The interaction of selfing with recombination shapes the spread of a neutral gene. Linkage disequilibrium, mainly generated by selfing, enhances the traveling wave of the neutral gene that is tightly linked with the selective gene. Recombination gradually breaks down the genetic hitchhiking effects along the direction of advantageous gene spread, yielding decreasing waves of advance of neutral genes. The stochastic process does not alter the pattern of selfing effects except for increasing the uncertainty of the waves of advance of both advantageous and neutral genes. This theory helps us to explain how mating systems act as a barrier to spread of adaptive and neutral genes, and to interpret species cohesion maintained by a low level of adaptive gene flow.


Conflict of interest statement

The authors declare that they have no conflict of interest.

Figures

Fig. 1
Fig. 1. The life cycle in the model shows a sequence of events, including the interactions of mating systems with pollen flow and gametophytic selection, seed flow and sporophytic selection.
These different events are biologically connected within one life cycle, with arrow lines showing the occurrence of sequential events.
Fig. 2
Fig. 2. Two hypothetical scenarios considered in the theory.
a Uniform density where the advantageous allele in the initial population spreads along one-dimensional space; b the initial population colonizes new space and adaptive genes spread accompanying the colonization process. In (a), black solid line represents uniform density distribution in space. Black dashed and solid lines represent population density at earlier and later times in (b), respectively; while red dashed and solid lines represent frequencies of adaptive genes at earlier and later times in (a) and (b), respectively.
Fig. 3
Fig. 3. Effects of selfing on the wave of gene advance.
a, c Traveling wave of allele frequency; b, d HWD coefficients. Results are derived at generation t = 100. a, b Refer to the results under uniform population density. c, d Refer to the results under nonuniform population density, (ln(n))′ ≠ 0. Common parameters are the gametic selection coefficient sh = 0.02, zygotic selection coefficient sd = 0.04, pollen dispersal variance = 0.05, and seed dispersal variance = 0.01. The initial population is set as pA = 1.0, DA = 0.0, and n0 = 100 for the case of (ln(n))′ ≠ 0.
Fig. 4
Fig. 4. Effects of gametophytic or sporophytic selection on the wave of gene advance.
a, c, e Traveling wave of allele frequency; b, d, f HWD coefficients. Results are derived at generation t = 100 under uniform population density. a, b Refer to the results with gametophytic selection only sh = 0.02 and sd = 0.0. c, d Refer to the results with sporophytic selection only sd = 0.04 and sh = 0.0. Common parameters in (ad) are the pollen dispersal variance = 0.05, and seed dispersal variance=0.04. e, f Refer to the results with selection sd = 0.04 and sh = 0.02, the pollen dispersal variance=0.0, and seed dispersal variance = 0.04. The initial population in each case is set as pA = 1.0 and DA = 0.0.
Fig. 5
Fig. 5. Effects of selfing rates on traveling waves under the stochastic process and uniform population density.
a Average allele frequency pA; b standard deviations Sd(pA); c average neutral gene frequency pB; and d standard deviations Sd(pB). All results are derived at the 100th generation. One thousand independent runs are conducted. Initial population settings are n = 50, pAABB = 0.5, pAABb = 0.3, pAAbb = 0.03, pAaBB = 0.1, pAaBb = 0.04, pAabb = 0.01, paaBB = 0.01, paaBb = 0.01, and paabb = 0.0. Other common parameters are the recombination rate = 0.05, gametic selection coefficient sh = 0.01, zygotic selection coefficient sd = 0.02, pollen dispersal variance = 0.05, and seed dispersal variance = 0.01.
Fig. 6
Fig. 6. Effects of selfing rates on traveling waves under the stochastic process and nonuniform population density.
a Average population density; b standard deviations of population density; c average allele frequency pA; d standard deviations of allele frequency Sd(pA); e average neutral gene frequency pB; and f standard deviations of allele frequency Sd(pB). All results are derived at the 500th generation. One thousand independent runs are conducted. Initial population settings are n0 = 50, environmental capacity K = 50 for all genotypes, pAABB = 0.5, pAABb = 0.3, pAAbb = 0.03, pAaBB = 0.1, pAaBb = 0.04, pAabb = 0.01, paaBB = 0.01, paaBb = 0.01, and paabb = 0.0. Other common parameters are the recombination rate = 0.05, gametic selection coefficient sh = 0.01, zygotic selection coefficient sd = 0.02, pollen dispersal variance = 0.1, and seed dispersal variance = 0.1.
Fig. 7
Fig. 7. Traveling waves of both advantageous and neutral genes.
a Allele frequency of an advantageous gene; b neutral gene frequency; c gametic LD DAB; and d gametic LD DA/B. Lines from left to right in each figure represent the results at generation 50, 100, 150,...,500, respectively. The Y-axis values are higher for DAB than for DA/B. Lines in blue refer to the results under uniform density (ln(n))′ = 0. Lines in red refer to the results under nonuniform density (ln(n))′ ≠ 0. Initial population settings are n0 = 100 for nonuniform density, pAABB = 0.5, pAABb = 0.3, pAAbb = 0.03, pAaBB = 0.1, pAaBb = 0.04, pAabb = 0.01, paaBB = 0.01, paaBb = 0.01, and paabb = 0.0. Other common parameters are the selfing rate α = 0.0, the recombination rate = 0.01, gametic selection coefficient sh = 0.02, zygotic selection coefficient sd = 0.04, pollen dispersal variance = 0.05, and seed dispersal variance = 0.04.
Fig. 8
Fig. 8. Effects of selfing rates on traveling waves of neutral genes.
a, d Allele frequency of the advantageous gene; b, e neutral gene frequency; c, f gametic LD DAB. All results are derived at the 100th generation. ac are the results under uniform density (ln(n))′ = 0; df are the results under nonuniform density (ln(n))′ ≠ 0. Initial population settings are n0 = 100 for (ln(n))′ ≠ 0, pAABB = 0.5, pAABb = 0.3, pAAbb = 0.03, pAaBB = 0.1, pAaBb = 0.04, pAabb = 0.01, paaBB = 0.01, paaBb = 0.01, and paabb = 0.0. Other common parameters are the recombination rate=0.01, gametic selection coefficient sh = 0.02, zygotic selection coefficient sd = 0.04, pollen dispersal variance=0.05, and seed dispersal variance = 0.01.

Similar articles

References

    1. Barrett SCH. Evolution of mating systems: outcrossing versus selfing. In: Losos J, editor. The Princeton guide to evolution. Princeton, NJ: Princeton University Press; 2014. pp. 356–362.
    1. Barton NH. Gene flow past a cline. Heredity. 1979;43:333–340.
    1. Barton NH. Genetic hitchhiking. Philos Trans R Soc Lond Ser B Biol Sci. 2000;355:1553–1562. - PMC - PubMed
    1. Barton NH, Bengtsson BO. The barrier to genetic exchange between hybridizing populations. Heredity. 1986;57:357–376. - PubMed
    1. Caballero A, Hill WG. Effective size of non-random mating populations. Genetics. 1992;130:909–916. - PMC - PubMed

Publication types