

Field courses narrow demographic achievement gaps in ecology and evolutionary biology
- PMID: 32607142
- PMCID: PMC7319162
- DOI: 10.1002/ece3.6300
Field courses narrow demographic achievement gaps in ecology and evolutionary biology
Abstract
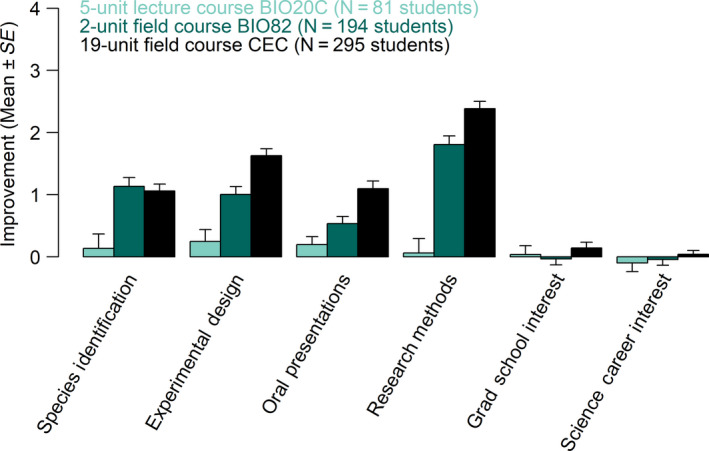
Disparities remain in the representation of marginalized students in STEM. Classroom-based experiential learning opportunities can increase student confidence and academic success; however, the effectiveness of extending learning to outdoor settings is unknown. Our objectives were to examine (a) demographic gaps in ecology and evolutionary biology (EEB) major completion, college graduation, and GPAs for students who did and did not enroll in field courses, (b) whether under-represented demographic groups were less likely to enroll in field courses, and (c) whether under-represented demographic groups were more likely to feel increased competency in science-related tasks (hereafter, self-efficacy) after participating in field courses. We compared the relationships among academic success measures and demographic data (race/ethnicity, socioeconomic status, first-generation, and gender) for UC Santa Cruz undergraduate students admitted between 2008 and 2019 who participated in field courses (N = 941 students) and who did not (N = 28,215 students). Additionally, we administered longitudinal surveys to evaluate self-efficacy gains during field-based versus classroom-based courses (N = 570 students). We found no differences in the proportion of students matriculating at the university as undecided, proposed EEB, or proposed other majors across demographic groups. However, five years later, under-represented students were significantly less likely to graduate with EEB degrees, indicating retention rather than recruitment drives disparities in representation. This retention gap is partly due to a lower rate of college completion and partly through attrition to other majors. Although under-represented students were less likely to enroll in field courses, field courses were associated with higher self-efficacy gains, higher college graduation rates, higher EEB major retention, and higher GPAs at graduation. All demographic groups experienced significant increases in self-efficacy during field-based but not lecture-based courses. Together, our findings suggest that increasing the number of field courses and actively facilitating access to students from under-represented groups can be a powerful tool for increasing STEM diversity.
Keywords: STEM; assessments; marginalized; minority; outcomes; student; success.
© 2020 The Authors. Ecology and Evolution published by John Wiley & Sons Ltd.
Conflict of interest statement
The authors declare no competing interests.
Figures


References
-
- Adams, D. J. (2009). Current trends in laboratory class teaching in university bioscience programmes. Bioscience Education, 13(1), 1–14. 10.3108/beej.13.3 - DOI
-
- Ahern‐Dodson, J. , Clark, C. R. , Mourad, T. , & Reynolds, J. A. (2020). Beyond the numbers: Understanding how a diversity mentoring program welcomes students into a scientific community. Ecosphere, 11(2), e03025 10.1002/ecs2.3025 - DOI
LinkOut - more resources
Full Text Sources
Other Literature Sources
Miscellaneous
