

Small coastal streams-Critical reservoirs of genetic diversity for trout (Salmo trutta L.) in the face of increasing anthropogenic stressors
- PMID: 32607181
- PMCID: PMC7319166
- DOI: 10.1002/ece3.6306
Small coastal streams-Critical reservoirs of genetic diversity for trout (Salmo trutta L.) in the face of increasing anthropogenic stressors
Abstract
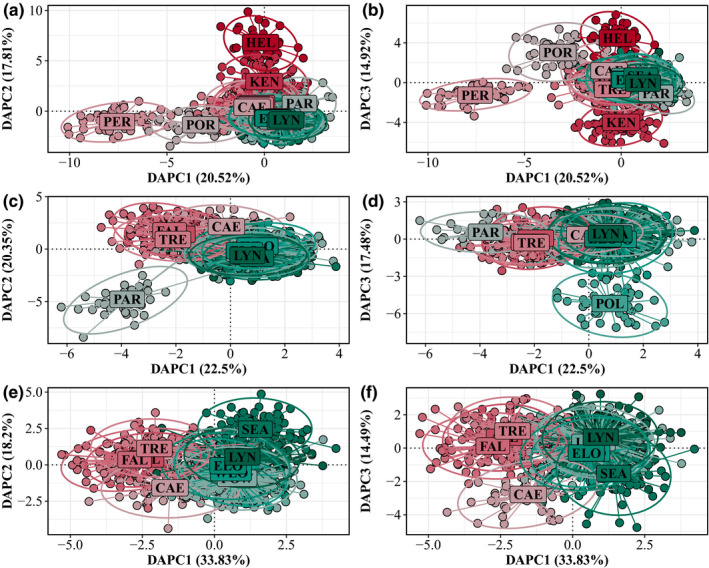
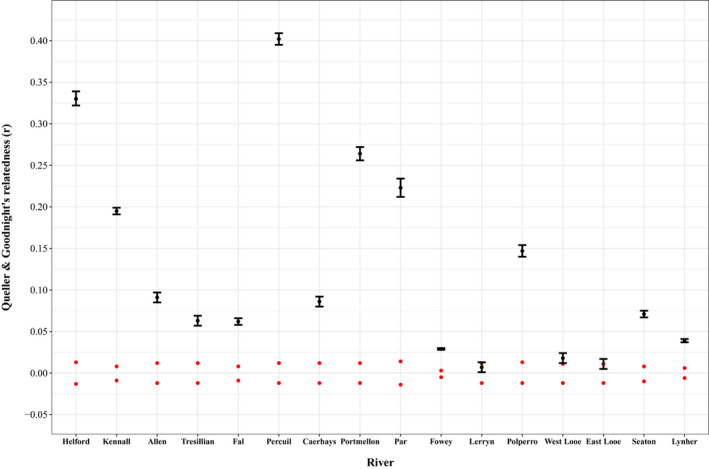
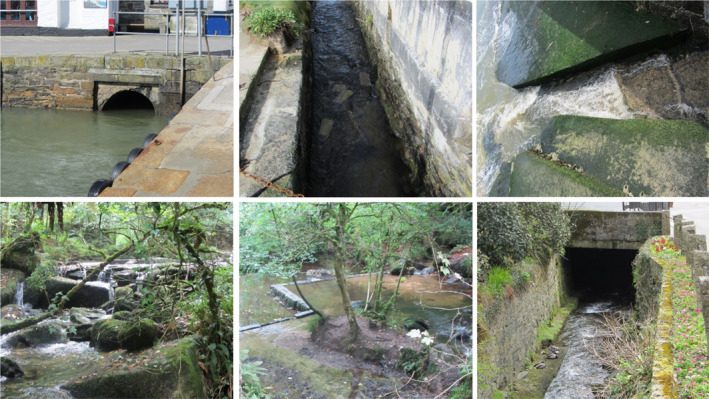
We used microsatellite markers to investigate levels and structuring of genetic diversity in trout (Salmo trutta L.) sampled from 16 rivers along the south coast of Cornwall in southwest England. This region is characterized by many small coastal streams with a few larger catchments. At a regional level, genetic structuring of contemporary populations has been influenced by a combination of events, including the last Ice Age and also more recent human activities over the last millennium. All populations are shown to have gone through strong genetic bottlenecks, coinciding with increased exploitation of mineral resources within catchments, beginning during the Medieval period. At more local levels, contemporary human-induced habitat fragmentation, such as weir and culvert construction, has disproportionally affected trout populations in the smaller catchments within the study area. However, where small catchments are relatively unaffected by such activities, they can host trout populations with diversity levels comparable to those found in larger rivers in the region. We also predict significant future loses of diversity and heterozygosity in the trout populations inhabiting small, isolated catchments. Our study highlights how multiple factors, especially the activity of humans, have and continue to affect the levels and structuring of genetic diversity in trout over long timescales.
Keywords: Salmo trutta; bottleneck; habitat fragmentation; microsatellite; migration barriers.
© 2020 The Authors. Ecology and Evolution published by John Wiley & Sons Ltd.
Conflict of interest statement
None declared.
Figures


Similar articles
-
Impacts of acidification on brown trout Salmo trutta populations and the contribution of stocking to population recovery and genetic diversity.J Fish Biol. 2019 Sep;95(3):719-742. doi: 10.1111/jfb.14054. Epub 2019 Jun 24. J Fish Biol. 2019. PMID: 31111501 Free PMC article.
-
Genetic structure and relatedness of brown trout (Salmo trutta) populations in the drainage basin of the Ölfusá river, South-Western Iceland.PeerJ. 2023 Sep 5;11:e15985. doi: 10.7717/peerj.15985. eCollection 2023. PeerJ. 2023. PMID: 37692111 Free PMC article.
-
Long-term temporal changes of genetic composition in brown trout (Salmo trutta L.) populations inhabiting an unstable environment.Mol Ecol. 2003 Nov;12(11):3123-35. doi: 10.1046/j.1365-294x.2003.01976.x. Mol Ecol. 2003. PMID: 14629391
-
Anadromy, potamodromy and residency in brown trout Salmo trutta: the role of genes and the environment.J Fish Biol. 2019 Sep;95(3):692-718. doi: 10.1111/jfb.14005. Epub 2019 Jun 13. J Fish Biol. 2019. PMID: 31197849 Free PMC article. Review.
-
Temperature requirements of Atlantic salmon Salmo salar, brown trout Salmo trutta and Arctic charr Salvelinus alpinus: predicting the effects of climate change.J Fish Biol. 2010 Nov;77(8):1793-817. doi: 10.1111/j.1095-8649.2010.02762.x. Epub 2010 Oct 6. J Fish Biol. 2010. PMID: 21078091 Review.
Cited by
-
The Genomic Signature and Transcriptional Response of Metal Tolerance in Brown Trout Inhabiting Metal-Polluted Rivers.Mol Ecol. 2025 Jan;34(1):e17591. doi: 10.1111/mec.17591. Epub 2024 Nov 19. Mol Ecol. 2025. PMID: 39558756 Free PMC article.
-
Dispersal and Gene Flow Among Potential Spawners: Source-Sink Structure Among Populations of Anadromous Brown Trout Exposed to Multifaceted Anthropogenic Impacts.Evol Appl. 2025 Jul 8;18(7):e70130. doi: 10.1111/eva.70130. eCollection 2025 Jul. Evol Appl. 2025. PMID: 40636775 Free PMC article.
-
A low-density single nucleotide polymorphism panel for brown trout (Salmo trutta L.) suitable for exploring genetic diversity at a range of spatial scales.J Fish Biol. 2023 Jan;102(1):258-270. doi: 10.1111/jfb.15258. Epub 2022 Nov 25. J Fish Biol. 2023. PMID: 36281821 Free PMC article.
-
Leveraging the genetic diversity of trout in the rivers of the British Isles and northern France to understand the movements of sea trout (Salmo trutta L.) around the English Channel.Evol Appl. 2024 Jul 22;17(7):e13759. doi: 10.1111/eva.13759. eCollection 2024 Jul. Evol Appl. 2024. PMID: 39040811 Free PMC article.
References
-
- Antoine, P. , Coutard, J.‐P. , Gibbard, P. , Hallegouet, B. , Lautridou, J.‐P. , & Ozouf, J.‐C. (2003). The Pleistocene rivers of the English Channel region. Journal of Quaternary Science, 18(3–4), 227–243. 10.1002/jqs.762 - DOI
-
- Beerli, P. , & Felsenstein, J. (2001). Maximum likelihood estimation of a migration matrix and effective population sizes in n subpopulations by using a coalescent approach. Proceedings of the National Academy of Sciences of the United States of America, 98(8), 4563–4568. 10.1073/pnas.081068098 - DOI - PMC - PubMed
-
- Bekkevold, D. , Jacobsen, L. , Hemmer‐Hansen, J. , Berg, S. , & Skov, C. (2015). From regionally predictable to locally complex population structure in a freshwater top predator: River systems are not always the unit of connectivity in Northern Pike Esox Lucius . Ecology of Freshwater Fish, 24(2), 305–316. 10.1111/eff.12149 - DOI
Associated data
LinkOut - more resources
Full Text Sources
