[Preprint]. 2020 Sep 8:2020.06.22.20136309.
doi: 10.1101/2020.06.22.20136309.

Test sensitivity is secondary to frequency and turnaround time for COVID-19 surveillance

Affiliations

Test sensitivity is secondary to frequency and turnaround time for COVID-19 surveillance

Daniel B Larremore et al. medRxiv. .

Update in

Abstract

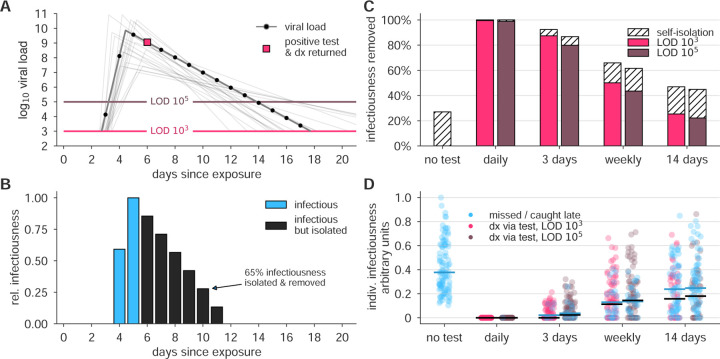
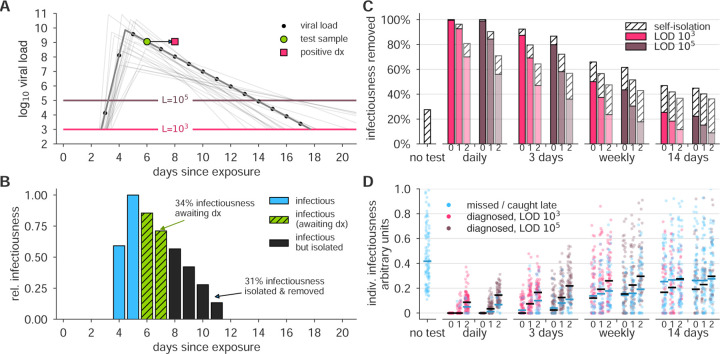
The COVID-19 pandemic has created a public health crisis. Because SARS-CoV-2 can spread from individuals with pre-symptomatic, symptomatic, and asymptomatic infections, the re-opening of societies and the control of virus spread will be facilitated by robust surveillance, for which virus testing will often be central. After infection, individuals undergo a period of incubation during which viral titers are usually too low to detect, followed by an exponential viral growth, leading to a peak viral load and infectiousness, and ending with declining viral levels and clearance. Given the pattern of viral load kinetics, we model surveillance effectiveness considering test sensitivities, frequency, and sample-to-answer reporting time. These results demonstrate that effective surveillance depends largely on frequency of testing and the speed of reporting, and is only marginally improved by high test sensitivity. We therefore conclude that surveillance should prioritize accessibility, frequency, and sample-to-answer time; analytical limits of detection should be secondary.


Figures

Figure 1:
Figure 1:. Surveillance testing effectiveness depends on frequency.
(A) An example viral load trajectory is shown with LOD thresholds of two tests, and a hypothetical positive test on day 6, two days after peak viral load. 20 other stochastically generated viral loads are shown to highlight trajectory diversity (light grey; see Methods). (B) Relative infectiousness for the viral load shown in panel A pre-test, totaling 35% (blue) and post-isolation, totaling 65% (black). (C) Surveillance programs using tests at LODs of 103 and 105 at frequencies indicated were applied to 10, 000 individuals’ trajectories of whom 35% would undergo symptomatic isolation near their peak viral load if they had not been tested and isolated first. Total infectiousness removed during surveillance (colors) and self isolation (hatch) are shown for surveillance as indicated, relative to total infectiousness with no surveillance or self-isolation. (D) The impact of surveillance on the infectiousness of 100 individuals is shown for each surveillance program and no testing, as indicated, with each individual colored by test if their infection was detected during infectiousness (medians, black lines) or colored blue if their infection was missed by surveillance or detected positive after their infectious period (medians, blue lines). Units are arbitrary and scaled to the maximum infectiousness of sampled individuals.
Figure 2:
Figure 2:. Surveillance testing affects disease dynamics.
Both the fully-mixed compartmental model (top row) and agent based model (bottom row) are affected by surveillance programs. (A, B) More frequent testing reduces the effective reproductive number R, shown as the percentage by which R0 is reduced, 100 × (R0R)/R0. Values of R were estimated from 50 independent simulations of dynamics (see Methods). (C, D) Relative to no testing (grey bars), surveillance suppresses the total number of infections in both models when testing every day or every three days, but only partially mitigates total cases for weekly or bi-weekly testing. Error bars indicate inner 95% quantiles of 50 independent simulations each.
Figure 3:
Figure 3:. Effectiveness of surveillance testing is compromised by delays in reporting.
(A) An example viral load trajectory is shown with LOD thresholds of two tests, and a hypothetical positive test on day 6, but with results reported on day 8. 20 other stochastically generated viral loads are shown to highlight trajectory diversity (light grey; see Methods). (B) Relative infectiousness for the viral load shown in panel A pre-test (totaling 35%; blue) and post-test but pre-diagnosis (totaling 34%; green), and post-isolation (totaling 31%; black). (C) Surveillance programs using tests at LODs of 103 and 105 at frequencies indicated, and with results returned after 0, 1, or 2 days (indicated by small text beneath bars) were applied to 10, 000 individuals trajectories of whom 35% were symptomatic and self-isolated after peak viral load if they had not been tested and isolated first. Total infectiousness removed during surveillance (colors) and self isolation (hatch) are shown, relative to total infectiousness with no surveillance or self-isolation. Delays substantially impact the fraction of infectiousness removed. (D) The impact of surveillance with delays in returning diagnosis of 0, 1, or 2 days (small text beneath axis) on the infectiousness of 100 individuals is shown for each surveillance program and no testing, as indicated, with each individual colored by test if their infection was detected during infectiousness (medians, black lines) or colored blue if their infection was missed by surveillance or diagnosed positive after their infectious period (medians, blue lines). Units are arbitrary and scaled to the maximum infectiousness of sampled individuals.
Figure 4:
Figure 4:. Delays in reporting decrease the epidemiological impact of surveillance-driven isolation.
The effectiveness of surveillance programs are dramatically diminished by delays in reporting in both the fully-mixed compartmental model (top row) and agent based model (bottom row). (A, B) The impact of surveillance every day, 3 days, weekly, or biweekly, on the reproductive number R, calculated as 100 × (R0R)/R0, is shown for LODs 103 and 105 and delays of 0, 1, or 2 days (small text below axis). Values of R were estimated from 50 independent simulations of dynamics (see Methods). (C, D) Relative to no testing (grey bars), surveillance suppresses the total number of infections in both models when testing every day or every three days, but delayed results lead to only partial mitigation of total cases, even for testing every day or 3 days. Error bars indicate inner 95% quantiles of 50 independent simulations each.
Figure 5:
Figure 5:. Surveillance testing suppresses an ongoing epidemic.
Widespread testing and isolation of infected individuals drives prevalence downward for both (A) the fully-mixed compartmental model and (B) the agent based model. Time-series of prevalence, measured as the total number of infectious individuals, are shown for no intervention (solid) and surveillance testing scenarios (various dashed; see legend). Surveillance testing began only when prevalence reached 4% (box), and time series are shifted such that testing begins at t = 0. Scenarios show the impact of a test with LOD 105, no delay in results, and with 10% of samples assumed to be incorrectly collected (and therefore negative) to reflect decreased sensitivity incurred at sample collection in a mass testing scenario. Annotations show total number of post-intervention infections, as a percentage of the no-intervention scenario, labeled as 100%. See Fig. S9 for identical simulations using a test with LOD 106.
Figure 6:
Figure 6:. Example asymptomatic and symptomatic viral loads with model control points.
Examples of model viral loads (lines) and corresponding stochastically drawn control points (squares, circles) are shown for (A) an asymptomatic viral load trajectory and (B) a symptomatic viral load trajectory. Because simulations took place in discrete time, black dots show points at which this example viral load would have been sampled. Light grey lines show 20 alternative trajectories in each panel to illustrate the diversity of viral loads drawn from the simple model. Red circles indicate the control points which are modified in symptomatic trajectories to account for symptom onset and prolonged time till clearance.

References

    1. Arons Melissa M, Hatfield Kelly M, Reddy Sujan C, Kimball Anne, James Allison, Jacobs Jesica R, Taylor Joanne, Spicer Kevin, Bardossy Ana C, Oakley Lisa P, et al. Presymptomatic SARS-CoV-2 infections and transmission in a skilled nursing facility. New England Journal of Medicine, 2020. - PMC - PubMed
    1. Sutton Desmond, Fuchs Karin, D’alton Mary, and Goffman Dena. Universal screening for SARS-CoV-2 in women admitted for delivery. New England Journal of Medicine, 2020. - PMC - PubMed
    1. Oran Daniel P and Topol Eric J. Prevalence of asymptomatic SARS-CoV-2 infection: A narrative review. Annals of Internal Medicine, 2020. - PMC - PubMed
    1. Moghadas Seyed M, Fitzpatrick Meagan C, Sah Pratha, Pandey Abhishek, Shoukat Affan, Singer Burton H, and Galvani Alison P. The implications of silent transmission for the control of covid-19 outbreaks. Proceedings of the National Academy of Sciences, 117(30):17513–17515, 2020. - PMC - PubMed
    1. Grassly Nicholas C, Margarita Pons-Salort, Parker Edward P K, White Peter J, Ferguson Neil M, and “The Imperial College COVID-19 Response Team”. Comparison of molecular testing strategies for covid-19 control: a mathematical modelling study. The Lancet Infectious Diseases, 2020. - PMC - PubMed

Publication types