[Preprint]. 2020 Aug 28:2020.06.18.20134858.
doi: 10.1101/2020.06.18.20134858.

Practical considerations for measuring the effective reproductive number, R t

Affiliations

Practical considerations for measuring the effective reproductive number, R t

Katelyn M Gostic et al. medRxiv. .

Update in

  • Practical considerations for measuring the effective reproductive number, Rt.
    Gostic KM, McGough L, Baskerville EB, Abbott S, Joshi K, Tedijanto C, Kahn R, Niehus R, Hay JA, De Salazar PM, Hellewell J, Meakin S, Munday JD, Bosse NI, Sherrat K, Thompson RN, White LF, Huisman JS, Scire J, Bonhoeffer S, Stadler T, Wallinga J, Funk S, Lipsitch M, Cobey S. Gostic KM, et al. PLoS Comput Biol. 2020 Dec 10;16(12):e1008409. doi: 10.1371/journal.pcbi.1008409. eCollection 2020 Dec. PLoS Comput Biol. 2020. PMID: 33301457 Free PMC article.

Abstract

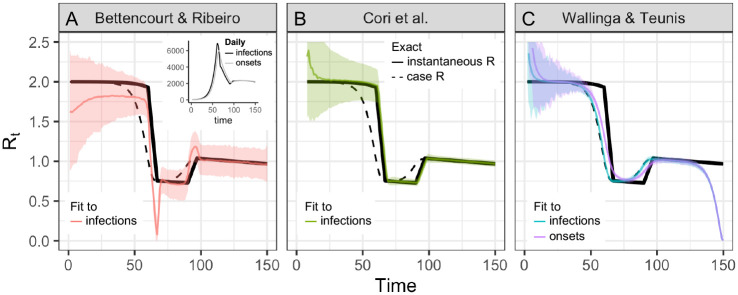
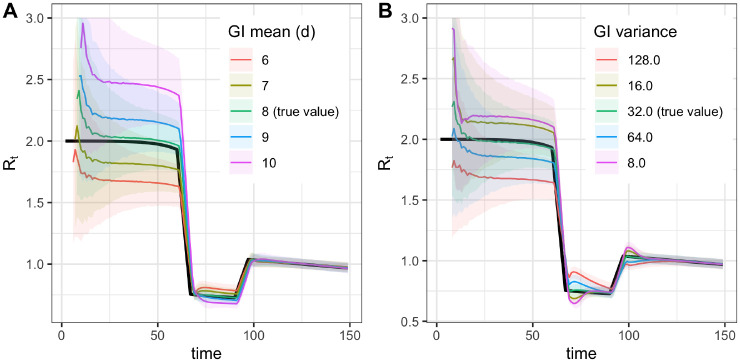
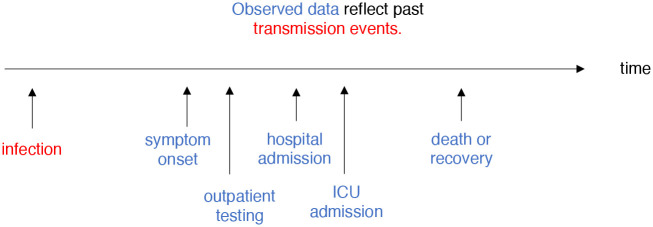
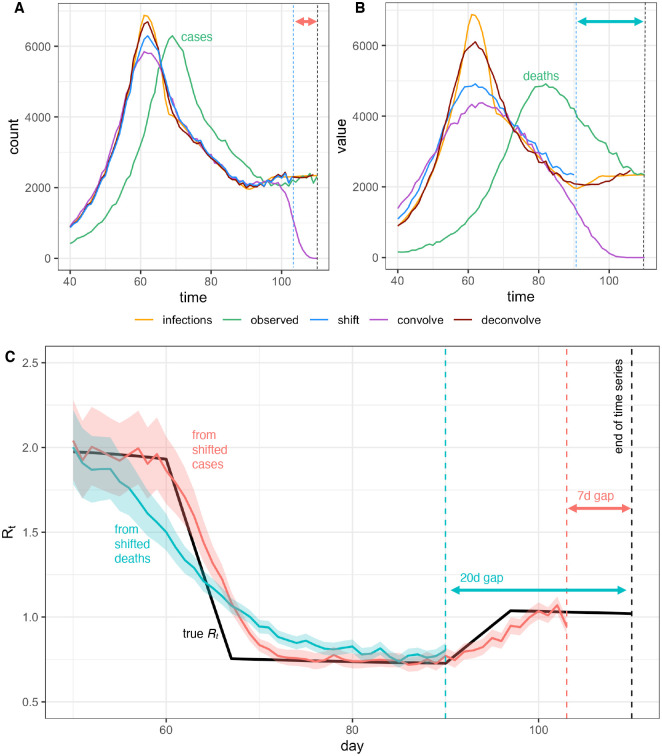
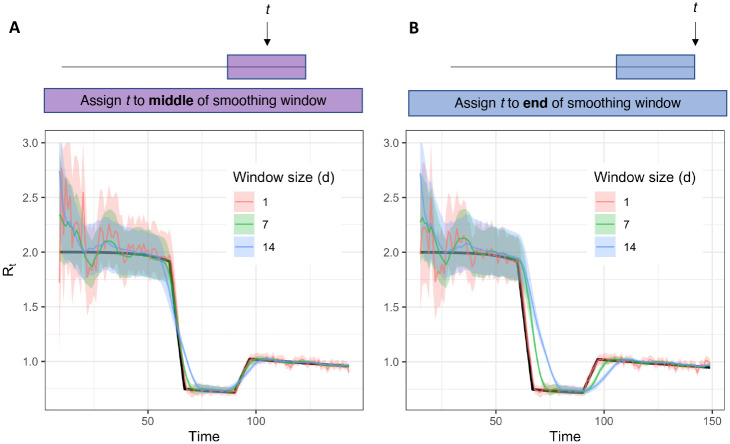
Estimation of the effective reproductive number, R t , is important for detecting changes in disease transmission over time. During the COVID-19 pandemic, policymakers and public health officials are using R t to assess the effectiveness of interventions and to inform policy. However, estimation of R t from available data presents several challenges, with critical implications for the interpretation of the course of the pandemic. The purpose of this document is to summarize these challenges, illustrate them with examples from synthetic data, and, where possible, make recommendations. For near real-time estimation of R t , we recommend the approach of Cori et al. (2013), which uses data from before time t and empirical estimates of the distribution of time between infections. Methods that require data from after time t, such as Wallinga and Teunis (2004), are conceptually and methodologically less suited for near real-time estimation, but may be appropriate for retrospective analyses of how individuals infected at different time points contributed to spread. We advise against using methods derived from Bettencourt and Ribeiro (2008), as the resulting R t estimates may be biased if the underlying structural assumptions are not met. Two key challenges common to all approaches are accurate specification of the generation interval and reconstruction of the time series of new infections from observations occurring long after the moment of transmission. Naive approaches for dealing with observation delays, such as subtracting delays sampled from a distribution, can introduce bias. We provide suggestions for how to mitigate this and other technical challenges and highlight open problems in R t estimation.


Figures

Fig 1.
Fig 1.. Instantaneous reproductive number as estimated by the method of Cori et al. versus cohort reproductive number estimated by Wallinga and Teunis.
For each definition of Rt, arrows show the times at which infectors (upwards), and their infectees (downwards) appear in the data. Curves show the generation interval distribution (A,B), or serial interval distribution (C). A: The instantaneous reproductive number quantifies the number of new infections incident at a single point in time (ti, blue arrow), relative to the number of infections incident in the previous generation (green arrows), and their current infectiousness (green curve). This figure illustrates the method of Cori et al. B & C: The case reproductive number of Wallinga and Teunis is the average number of new infections that an individual who becomes (B) infected on day ti (green arrow) or (C) symptomatic on day ts (yellow arrow) will eventually go on to cause (blue downward arrows show timing of daughter cases). The first definition applies when estimating the case reproductive number using inferred times of infection, and the second applies when using data on times of symptom onset.
Fig 2.
Fig 2.. Accuracy of Rt estimation methods given ideal, synthetic data.
Solid and dashed black line shows the instantaneous and case reproductive numbers, respectively, calculated from synthetic data. Colored lines show estimates and confidence or credible intervals. To mimic an epidemic progressing in real-time, the time series of infections or symptom onset events up to t = 150 was input into each estimation method (inset). Terminating the time series while Rt is falling or rising produces similar results S2 Fig. (A) By assuming a SIR model (rather than SEIR, the source of the synthetic data), the method of Bettencourt and Ribeiro systematically underestimates Rt when the true value is substantially higher than one. The method is also biased as transmission shifts. (B) The Cori method accurately measures the instantaneous reproductive number. (C) The Wallinga and Teunis method estimates the cohort reproductive number, which incorporates future changes in transmission. Thus, the method produces Rt estimates that lead the instantaneous effective reproductive number and becomes unreliable for real-time estimation at the end of the observed time series without adjustment for right truncation [4,30]. In (A,B) the colored line shows the posterior mean and the shaded region the 95% credible interval. In (C) the colored line shows the maximum likelihood estimate and the shaded region the 95% confidence interval.
Fig 3.
Fig 3.. Biases from misspecification of the generation interval mean (A) or variance (B).
Demonstrated using the method of Cori et al.
Fig 4.
Fig 4.
Rt is a measure of transmission at time t. Observations after time t must be adjusted.
Fig 5.
Fig 5.. Pitfalls of simple methods to adjust for delays to observation when estimating Rt.
Infections back calculated from (A) observed cases or (B) observed deaths either by shifting the observed curve back in time by the mean observation delay (shift), by subtracting a random sample from the delay distribution from each individual time of observation (convolve), or by deconvolution (deconvolve), without adjustment for right truncation. Neither back-calculation strategy accurately recovers peaks or valleys in the true infection curve. The inferred infection curve is less accurate when the variance of the delay distribution is greater (B vs. A). (C) Posterior mean and credible interval of Rt estimates from the Cori et al. method. Inaccuracies in the inferred incidence curves affect Rt estimates, especially when Rt is changing (here Rt was estimated using shifted values from A and B). Finally we note that shifting the observed curves back in time without adjustment for right truncation leads to a gap between the last date in the inferred time series of infection and the last date in the observed data, as shown by the dashed lines and horizontal arrows in A-C.
Fig 6.
Fig 6.
Accuracy of Rt estimates given smoothing window width and location of t within the smoothing window. Estimates were obtained using synthetic data drawn from the S → E transition of a stochastic SEIR model (inset) as an input to the method of Cori et al. Colored estimates show the posterior mean and 95% credible interval. Black line shows the exact instantaneous Rt calculated from synthetic data.

References

    1. Pan A, Liu L, Wang C, Guo H, Hao X, Wang Q, et al. Association of Public Health Interventions With the Epidemiology of the COVID-19 Outbreak in Wuhan, China. JAMA. 2020;323(19):1915. doi: 10.1001/jama.2020.6130 - DOI - PMC - PubMed
    1. Sciré J, Nadeau SA, Vaughan TG, Gavin B, Fuchs S, Sommer J, et al. Reproductive number of the COVID-19 epidemic in Switzerland with a focus on the Cantons of Basel-Stadt and Basel-Landschaft. Swiss Medical Weekly. 2020;150(19–20):w20271. - PubMed
    1. Kucharski AJ, Russell TW, Diamond C, Liu Y, Edmunds J, Funk S, et al. Early dynamics of transmission and control of COVID-19: a mathematical modelling study. The lancet infectious diseases. 2020;. - PMC - PubMed
    1. Cauchemez S, Boëlle PY, Donnelly CA, Ferguson NM, Guy T, Leung GM, et al. Real-time Estimates in Early Detection of SARS. Emerging Infectious Diseases. 2006;12(1):110–113. doi: 10.3201/eid1201.050593 - DOI - PMC - PubMed
    1. Flaxman S, Mishra S, Gandy A, et al. Estimating the number of infections and the impact of nonpharmaceutical interventions on COVID-19 in 11 European countries. Imperial College London; 2020. Available from: 10.25561/77731 - DOI

Publication types