. 2020 Oct 8;64(8):778-785.
doi: 10.1093/annweh/wxaa056.

Time-Based Data in Occupational Studies: The Whys, the Hows, and Some Remaining Challenges in Compositional Data Analysis (CoDA)

Affiliations

Time-Based Data in Occupational Studies: The Whys, the Hows, and Some Remaining Challenges in Compositional Data Analysis (CoDA)

Nidhi Gupta et al. Ann Work Expo Health. .

Abstract

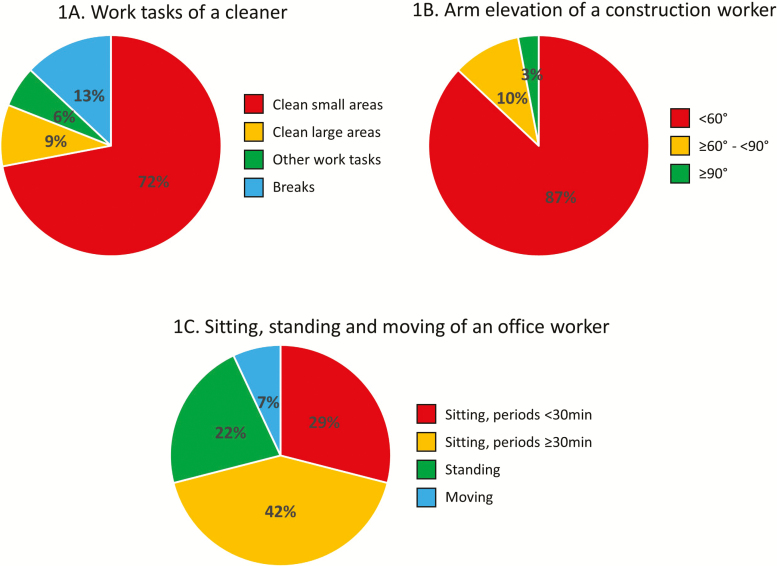
Data on the use of time in different exposures, behaviors, and work tasks are common in occupational research. Such data are most often expressed in hours, minutes, or percentage of work time. Thus, they are constrained or 'compositional', in that they add up to a finite sum (e.g. 8 h of work or 100% work time). Due to their properties, compositional data need to be processed and analyzed using specifically adapted methods. Compositional data analysis (CoDA) has become a particularly established framework to handle such data in various scientific fields such as nutritional epidemiology, geology, and chemistry, but has only recently gained attention in public and occupational health sciences. In this paper, we introduce the reader to CoDA by explaining why CoDA should be used when dealing with compositional time-use data, showing how to perform CoDA, including a worked example, and pointing at some remaining challenges in CoDA. The paper concludes by emphasizing that CoDA in occupational research is still in its infancy, and stresses the need for further development and experience in the use of CoDA for time-based occupational exposures. We hope that the paper will encourage researchers to adopt and apply CoDA in studies of work exposures and health.

Keywords: constrained data; ergonomics; isometric log-ratio; work environment.


Figures

Figure 1.
Figure 1.
Examples of compositions of time at work spent: (A) on different tasks for a cleaner; (B) in different categories of arm elevation for a construction worker, and (C) in sitting (in periods of <30 and ≥30 min), standing and moving for an office worker.
Figure 2.
Figure 2.
Isotemporal substitution illustrating the direction and strength of the association between time in sitting, relative to standing and walking, and LBP intensity. Zeroes on the x and y axes correspond to the average composition (175 min sitting, 205 min standing, 98 min walking), and the mean pain intensity (2.9) in the source population, respectively. Numbers on the x-axis show reallocations of time to/from sitting from/to standing and walking (see running text for details). For example, reallocating 60 min from sitting to standing and walking (41 min to standing and 19 min to walking) is estimated to be associated with a LBP 0.36 [95% CI (−0.59, −0.12)] lower than the group average.
Figure 3.
Figure 3.
A ternary plot illustrating the estimated LBP intensity at different compositions of sitting, standing, and walking, according to a CoDA regression analysis among 209 blue-collar workers. The gray-blue contour plot indicates the occurrence of compositions in the source population, with the density of the gray-blue color representing the number of workers; lighter blue color, higher density. For example, many workers had compositions of about 20% sitting, 55% standing, and 25% walking (upper right ‘mountain’), and many had about 60% sitting, 30% standing, and 10% walking (lower left mountain). The circles illustrate the estimated pain intensity for selected compositions, sizes coded as shown in the legend. The white dot shows the average composition and pain intensity in the source population.

Similar articles

Cited by

References

    1. Aadland E, Andersen LB, Resaland GK et al. (2019) Interpretation of multivariate association patterns between multicollinear physical activity accelerometry data and cardiometabolic health in children—a tutorial. Metabolites; 9: 129. - PMC - PubMed
    1. Aitchison J. (1982) The statistical analysis of compositional data. J R Stat Soc Ser B (Methodol); 44: 139–77.
    1. Aitchison J. (1986) The statistical analysis of compositional data. London, UK: Chapman & Hall Ltd.
    1. Bauman A, Bittman M, Gershuny J (2019) A short history of time use research; implications for public health. BMC Public Health; 19 (Suppl. 2): 607. - PMC - PubMed
    1. Biddle GJH, Edwardson CL, Henson J et al. (2018) Associations of physical behaviours and behavioural reallocations with markers of metabolic health: a compositional data analysis. Int J Environ Res Public Health; 15: E2280. - PMC - PubMed

Publication types

LinkOut - more resources