

Detection of COVID-19 Infection from Routine Blood Exams with Machine Learning: A Feasibility Study
- PMID: 32607737
- PMCID: PMC7326624
- DOI: 10.1007/s10916-020-01597-4
Detection of COVID-19 Infection from Routine Blood Exams with Machine Learning: A Feasibility Study
Abstract
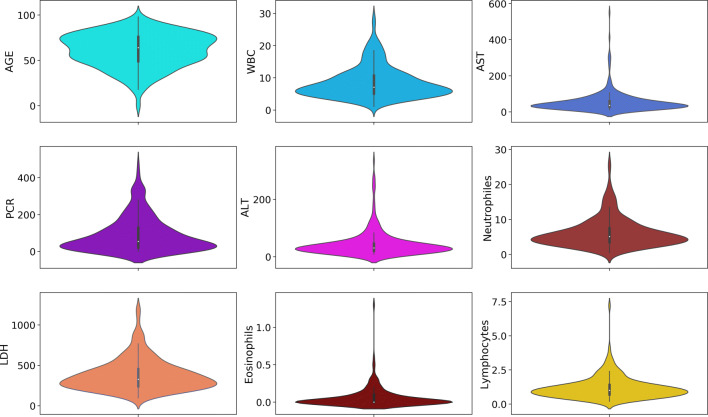
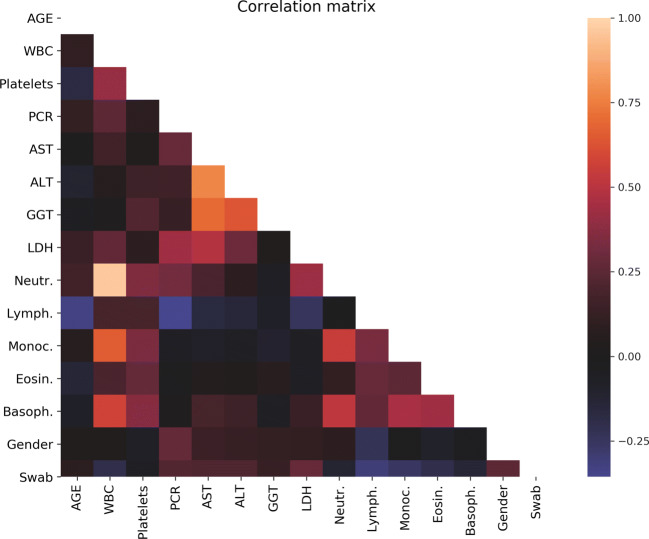
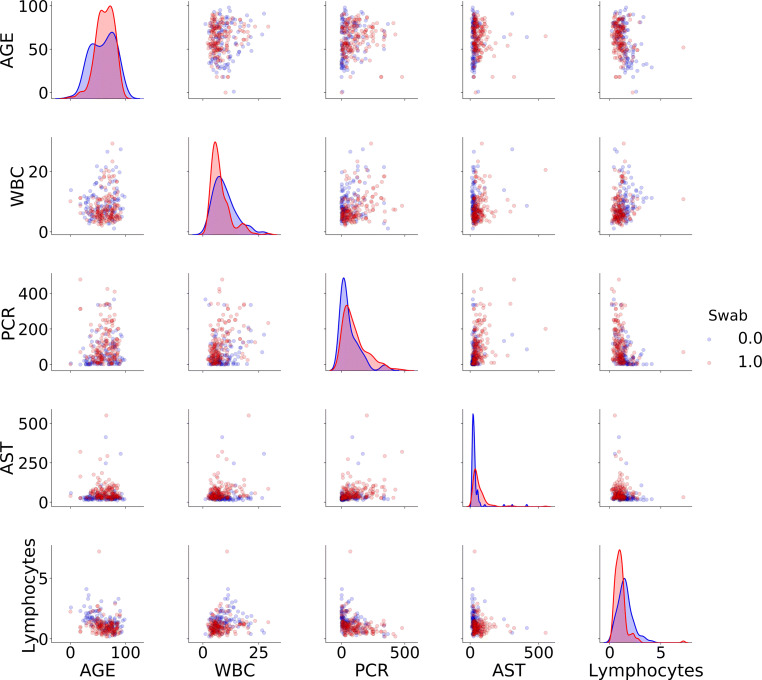
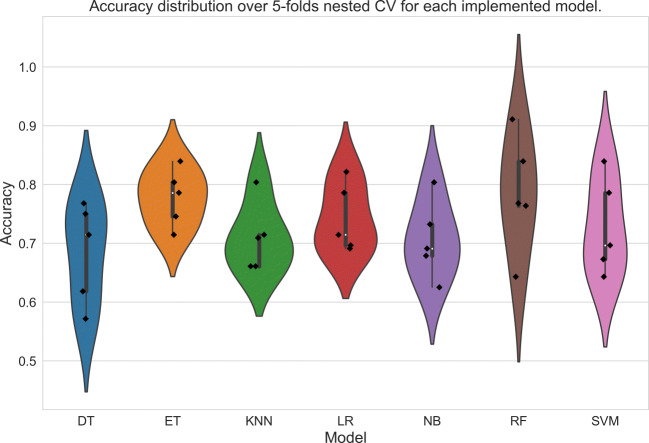
The COVID-19 pandemia due to the SARS-CoV-2 coronavirus, in its first 4 months since its outbreak, has to date reached more than 200 countries worldwide with more than 2 million confirmed cases (probably a much higher number of infected), and almost 200,000 deaths. Amplification of viral RNA by (real time) reverse transcription polymerase chain reaction (rRT-PCR) is the current gold standard test for confirmation of infection, although it presents known shortcomings: long turnaround times (3-4 hours to generate results), potential shortage of reagents, false-negative rates as large as 15-20%, the need for certified laboratories, expensive equipment and trained personnel. Thus there is a need for alternative, faster, less expensive and more accessible tests. We developed two machine learning classification models using hematochemical values from routine blood exams (namely: white blood cells counts, and the platelets, CRP, AST, ALT, GGT, ALP, LDH plasma levels) drawn from 279 patients who, after being admitted to the San Raffaele Hospital (Milan, Italy) emergency-room with COVID-19 symptoms, were screened with the rRT-PCR test performed on respiratory tract specimens. Of these patients, 177 resulted positive, whereas 102 received a negative response. We have developed two machine learning models, to discriminate between patients who are either positive or negative to the SARS-CoV-2: their accuracy ranges between 82% and 86%, and sensitivity between 92% e 95%, so comparably well with respect to the gold standard. We also developed an interpretable Decision Tree model as a simple decision aid for clinician interpreting blood tests (even off-line) for COVID-19 suspect cases. This study demonstrated the feasibility and clinical soundness of using blood tests analysis and machine learning as an alternative to rRT-PCR for identifying COVID-19 positive patients. This is especially useful in those countries, like developing ones, suffering from shortages of rRT-PCR reagents and specialized laboratories. We made available a Web-based tool for clinical reference and evaluation (This tool is available at https://covid19-blood-ml.herokuapp.com/ ).
Keywords: Blood tests; COVID-19; Machine learning; RT-PCR test; Random forest; Three-way.
Conflict of interest statement
The authors have declared no conflict of interest.
Figures


References
-
- Altman NS. An introduction to kernel and nearest-neighbor nonparametric regression. The American Statistician. 1992;46(3):175–185.
-
- Anguita D., Ghio A., Greco N., et al.: Model selection for support vector machines: Advantages and disadvantages of the machine learning theory.. In: IJCNN-2010, 2010, pp 1–8, 10.1109/IJCNN.2010.5596450
-
- van Buuren S, Groothuis-Oudshoorn K. mice: Multivariate imputation by chained equations in r. Journal of Statistical Software, Articles. 2011;45(3):1–67.
MeSH terms
LinkOut - more resources
Full Text Sources
Other Literature Sources
Research Materials
Miscellaneous
