

Determination of ammonia and hydrogen sulfide emissions from a commercial dairy farm with an exercise yard and the health-related impact for residents
- PMID: 32608005
- PMCID: PMC7496066
- DOI: 10.1007/s11356-020-09858-y
Determination of ammonia and hydrogen sulfide emissions from a commercial dairy farm with an exercise yard and the health-related impact for residents
Abstract
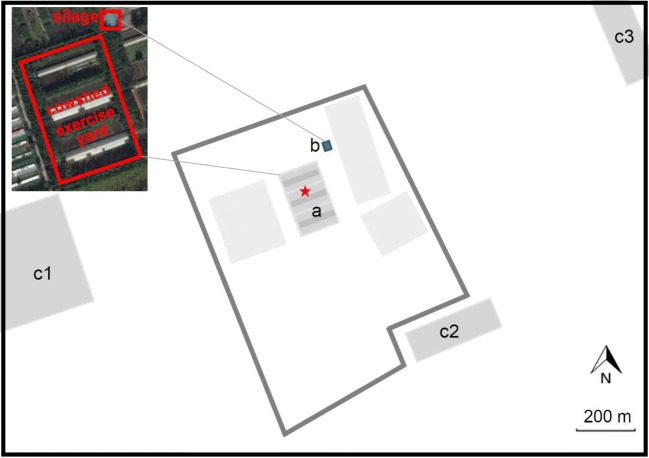
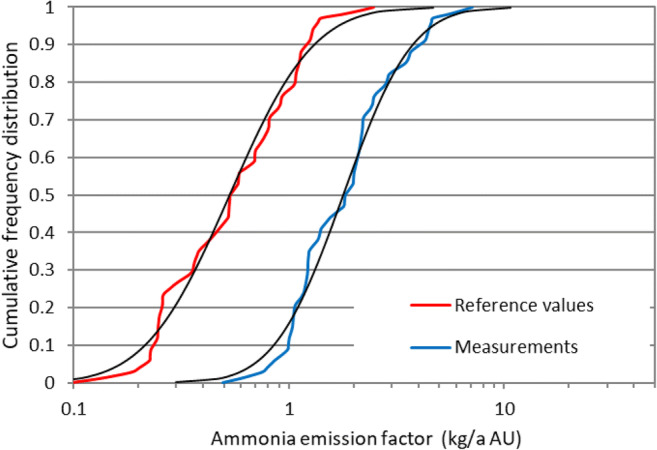
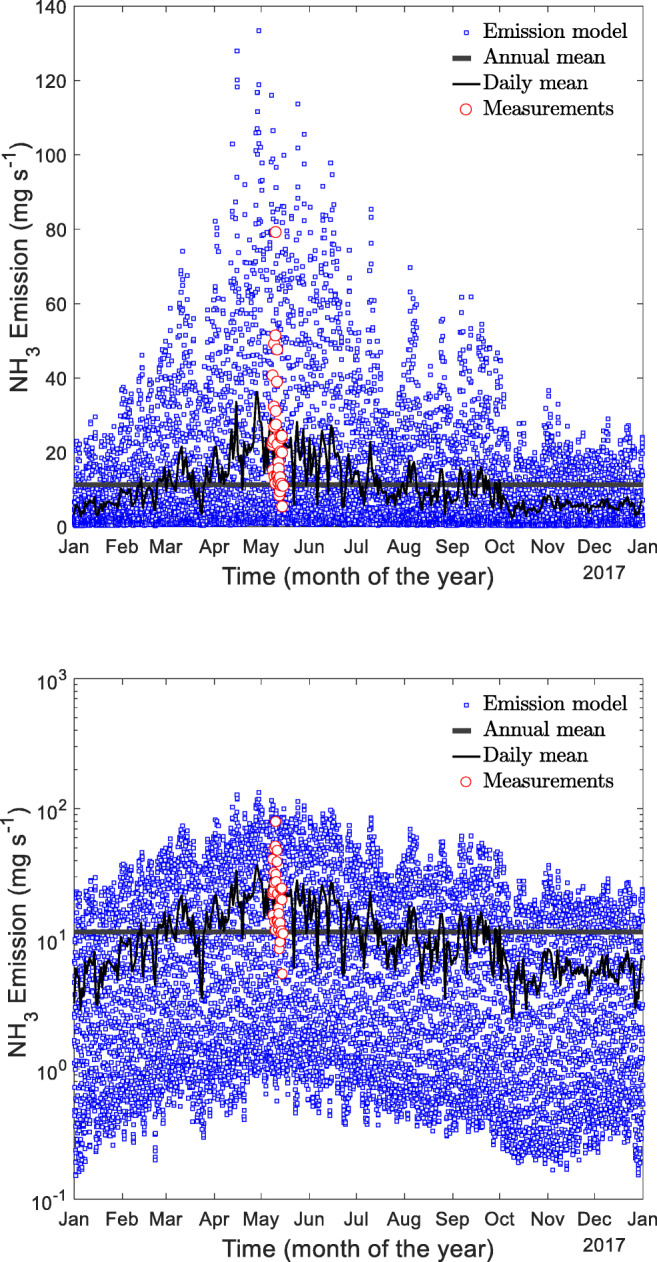
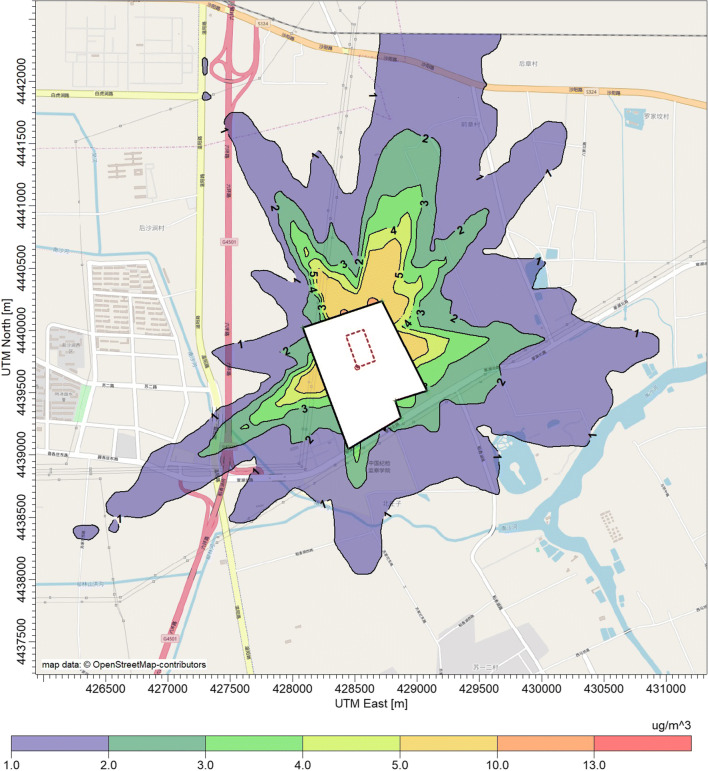
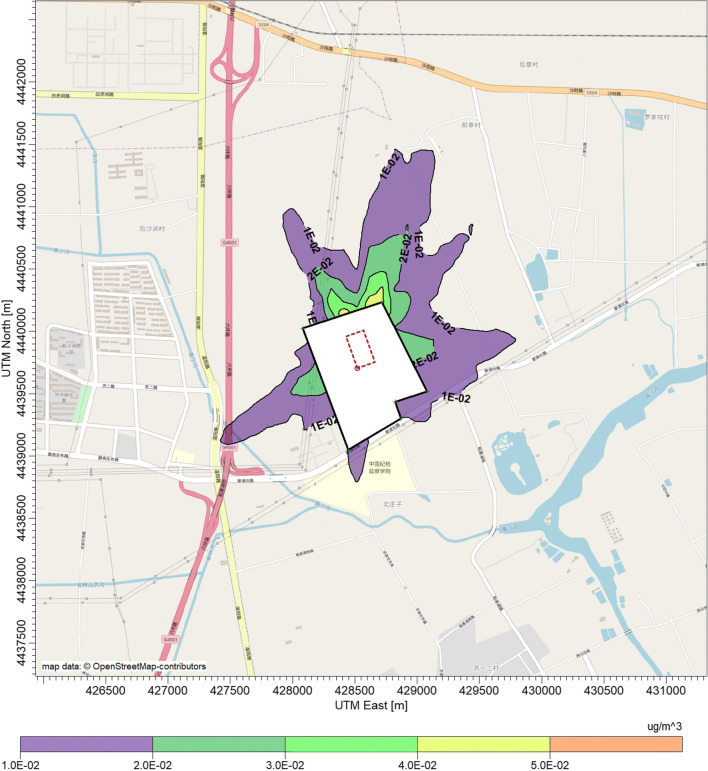
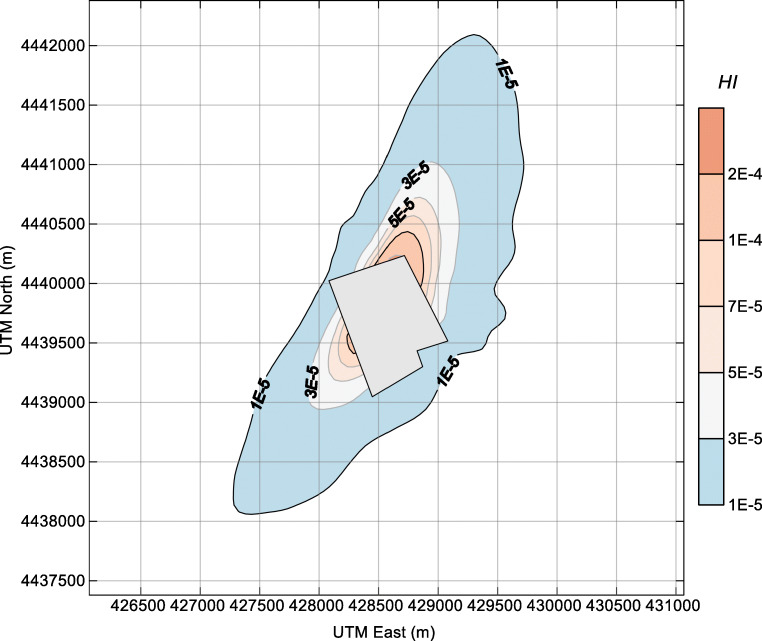
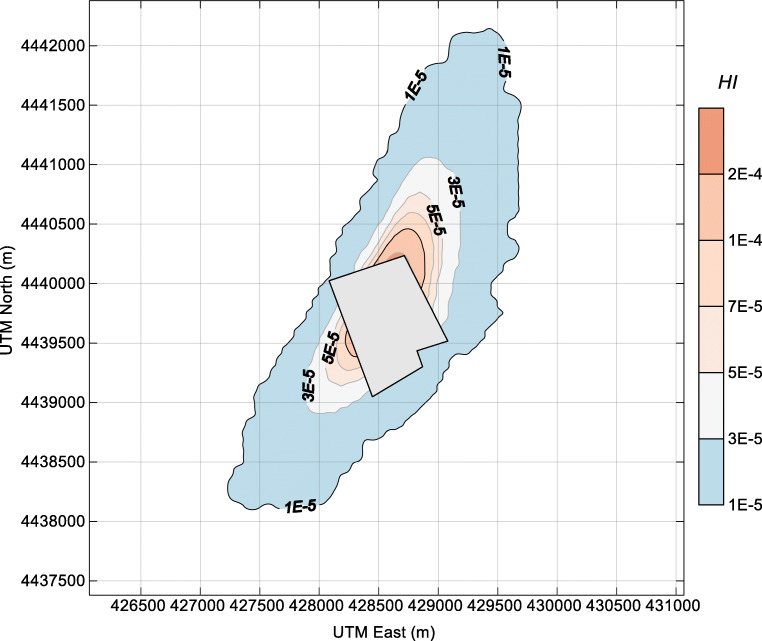
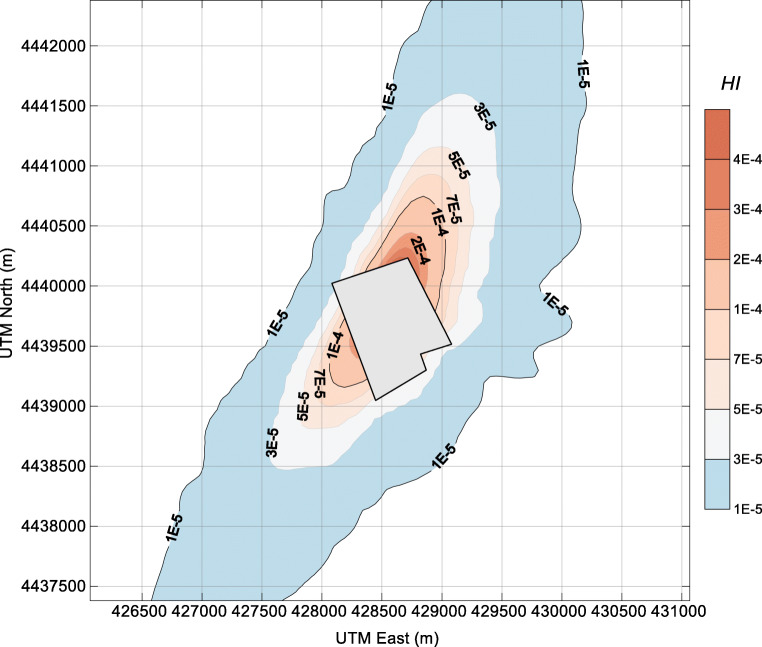
Airborne emissions from concentrated animal feeding operations (CAFOs) have the potential to pose a risk to human health and the environment. Here, we present an assessment of the emission, dispersion, and health-related impact of ammonia and hydrogen sulfide emitted from a 300-head, full-scale dairy farm with an exercise yard in Beijing, China. By monitoring the referred gas emissions with a dynamic flux chamber for seven consecutive days, we examined their emission rates. An annual hourly emission time series was constructed on the basis of the measured emission rates and a release modification model. The health risk of ammonia and hydrogen sulfide emissions around the dairy farm was then determined using atmospheric dispersion modeling and exposure risk assessment. The body mass-related mean emission factors of ammonia and hydrogen sulfide were 2.13 kg a-1 AU-1 and 24.9 g a-1 AU-1, respectively (one animal unit (AU) is equivalent to 500 kg body mass). A log-normal distribution fitted well to ammonia emission rates. Contour lines of predicted hourly mean concentrations of ammonia and hydrogen sulfide were mainly driven by the meteorological conditions. The concentrations of ammonia and hydrogen sulfide at the fence line were below 10 μg m-3 and 0.04 μg m-3, respectively, and were 2-3 orders of magnitude lower than the current Chinese air quality standards for such pollutants. Moreover, the cumulative non-carcinogenic risks (HI) of ammonia and hydrogen sulfide were 4 orders of magnitudes lower than the acceptable risk levels (HI = 1). Considering a health risk criterion of 1E-4, the maximum distance from the farm fence line to meet this criterion was nearly 1000 m towards north-northeast. The encompassed area of the contour lines of the ambient concentration of ammonia is much larger than that of hydrogen sulfide. However, the contour lines of the ammonia health risk are analogous to those of hydrogen sulfide. In general, the ammonia and hydrogen sulfide emissions from the dairy farm are unlikely to cause any health risks for the population living in the neighborhood.
Keywords: Ammonia; Dairy farm; Dispersion model; Emission; Health risk; Hydrogen sulfide.
Conflict of interest statement
The authors declare that they have no competing interests.
Figures
Similar articles
-
Components and dispersion characteristics of organic and inorganic odorous gases in a large-scale dairy farm.J Air Waste Manag Assoc. 2019 Jun;69(6):717-725. doi: 10.1080/10962247.2018.1562389. Epub 2019 Mar 25. J Air Waste Manag Assoc. 2019. PMID: 30576261
-
Diurnal and seasonal variations of odor and gas emissions from a naturally ventilated free-stall dairy barn on the Canadian prairies.J Air Waste Manag Assoc. 2017 Oct;67(10):1092-1105. doi: 10.1080/10962247.2017.1329172. Epub 2017 Jun 2. J Air Waste Manag Assoc. 2017. PMID: 28574753
-
Dispersion modeling of odour, gases, and respirable dust using AERMOD for poultry and dairy barns in the Canadian Prairies.Sci Total Environ. 2019 Nov 10;690:620-628. doi: 10.1016/j.scitotenv.2019.07.010. Epub 2019 Jul 3. Sci Total Environ. 2019. PMID: 31301502
-
A critical review on characterization, human health risk assessment and mitigation of malodorous gaseous emission during the composting process.Environ Pollut. 2024 Jun 15;351:124115. doi: 10.1016/j.envpol.2024.124115. Epub 2024 May 6. Environ Pollut. 2024. PMID: 38718963 Review.
-
Worker health and safety in concentrated animal feeding operations.J Agric Saf Health. 2008 Apr;14(2):163-87. doi: 10.13031/2013.24349. J Agric Saf Health. 2008. PMID: 18524283 Review.
Cited by
-
Spatial Distribution of Ammonia Concentrations and Modeled Dry Deposition in an Intensive Dairy Production Region.Atmosphere (Basel). 2023 Dec 22;15(1):1-23. doi: 10.3390/atmos15010015. Atmosphere (Basel). 2023. PMID: 39439773 Free PMC article.
-
Particulate Matter Emission Factors for Dairy Facilities and Cattle Feedlots during Summertime in Texas.Int J Environ Res Public Health. 2022 Oct 28;19(21):14090. doi: 10.3390/ijerph192114090. Int J Environ Res Public Health. 2022. PMID: 36360966 Free PMC article.
-
Ammonia and hydrogen sulfide - new insights into gut microbiota and male infertility through meta-analysis.Front Cell Infect Microbiol. 2025 Jan 6;14:1449453. doi: 10.3389/fcimb.2024.1449453. eCollection 2024. Front Cell Infect Microbiol. 2025. PMID: 39835276 Free PMC article.
-
Effects of Different Laying Hen Species on Odour Emissions.Animals (Basel). 2020 Nov 21;10(11):2172. doi: 10.3390/ani10112172. Animals (Basel). 2020. PMID: 33233353 Free PMC article.
-
Factors Influencing Gaseous Emissions in Constructed Wetlands: A Meta-Analysis and Systematic Review.Int J Environ Res Public Health. 2023 Feb 22;20(5):3876. doi: 10.3390/ijerph20053876. Int J Environ Res Public Health. 2023. PMID: 36900888 Free PMC article.
References
-
- Adviento-Borbe M, Wheeler EF, Brown NE, Topper PA, Graves R, Ishler V, Varga G. Ammonia and greenhouse gas flux from manure in freestall barn with dairy cows on precision fed rations. Trans Asabe. 2010;53:1251–1266.
-
- Arogo J, Westerman PW, Heber AJ. A review of ammonia emissions from confined swine feeding operations. Trans ASAE. 2003;46:805–817.
-
- Baldini C, Borgonovo F, Gardoni D, Guarino M. Comparison among NH3 and GHGs emissive patterns from different housing solutions of dairy farms. Atmos Environ. 2016;141:60–66.
-
- Bari MA, Kindzierski WB. Concentrations, sources and human health risk of inhalation exposure to air toxics in Edmonton, Canada. Chemosphere. 2017;173:160–171. - PubMed
-
- Blanes-Vidal V, Hansen MN, Pedersen S, Rom HB. Emissions of ammonia, methane and nitrous oxide from pig houses and slurry: effects of rooting material, animal activity and ventilation flow. Agric Ecosyst Environ. 2008;124:237–244.
MeSH terms
Substances
Grants and funding
LinkOut - more resources
Full Text Sources
