. 2020 Aug;34(8):10920-10930.
doi: 10.1096/fj.201903093R. Epub 2020 Jul 1.

Membrane cholesterol dependence of cannabinoid modulation of glycine receptor

Affiliations

Membrane cholesterol dependence of cannabinoid modulation of glycine receptor

Lei Yao et al. FASEB J. 2020 Aug.

Abstract

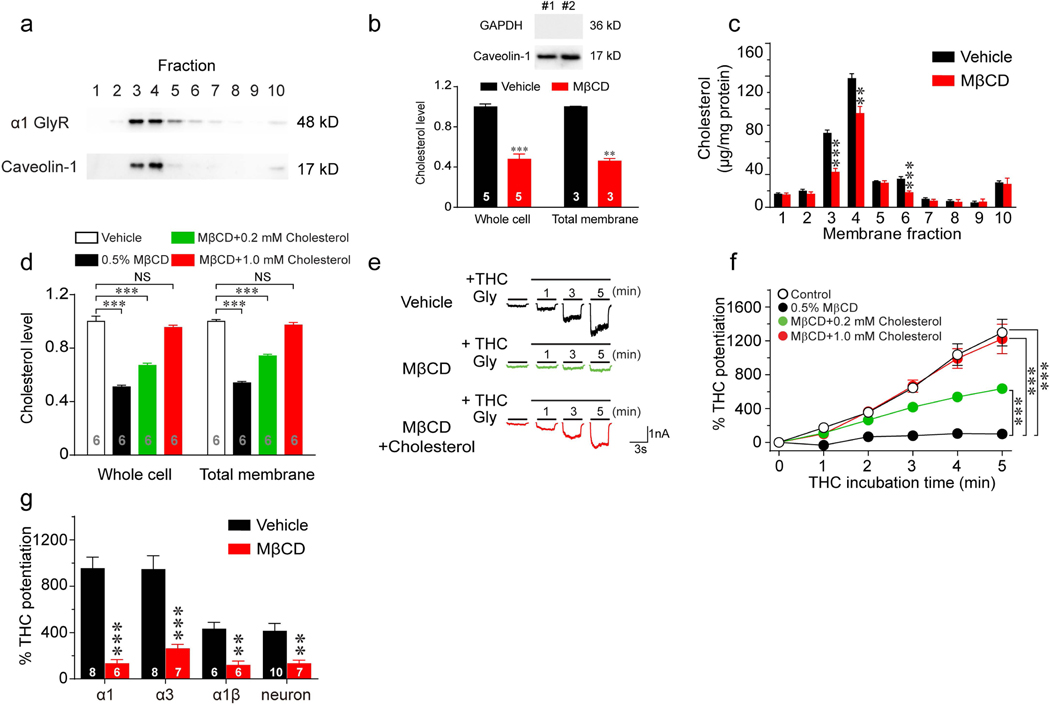
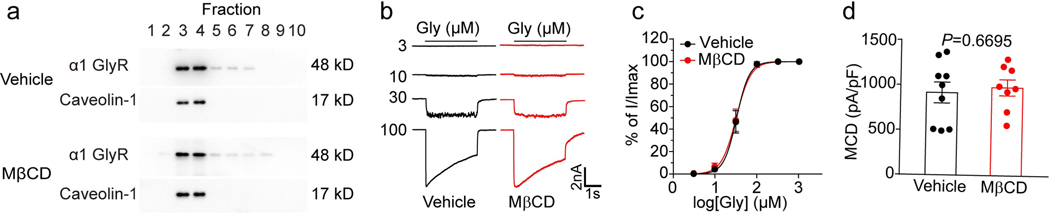
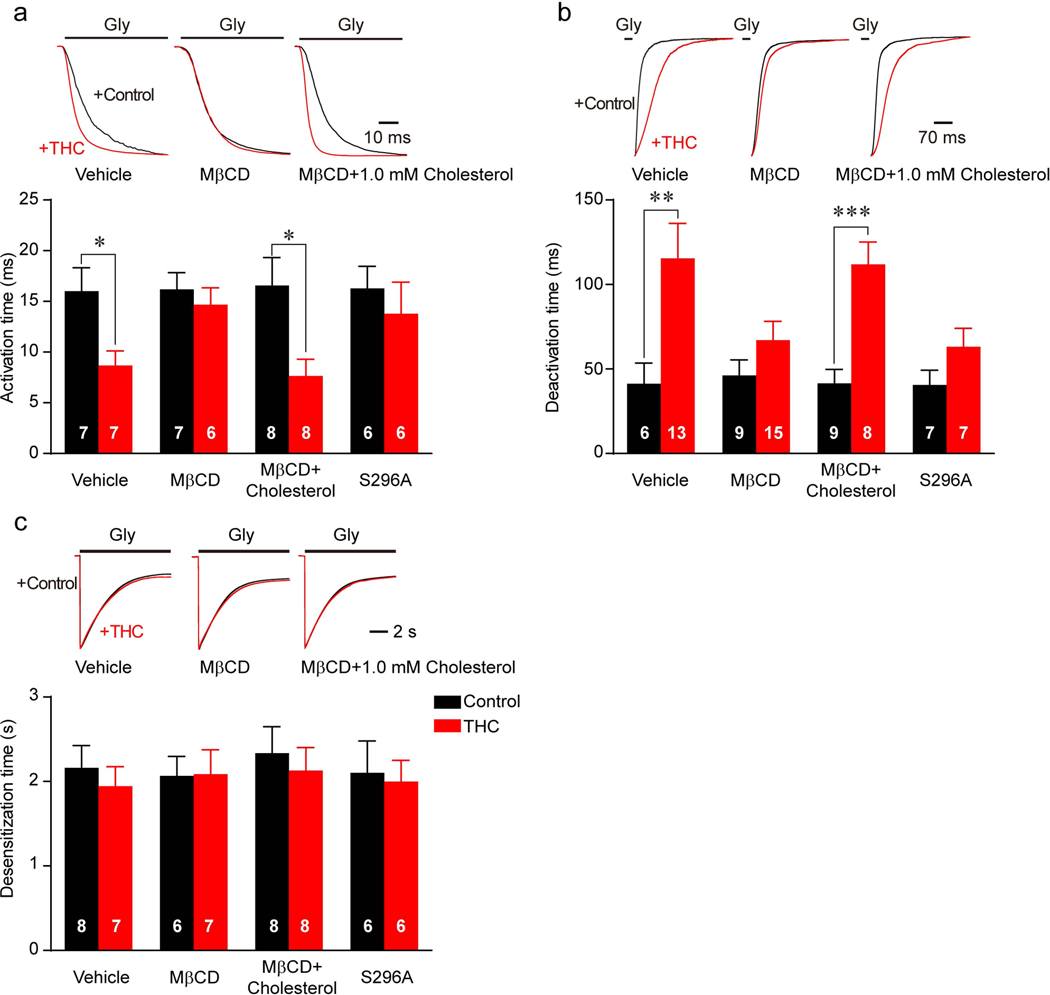
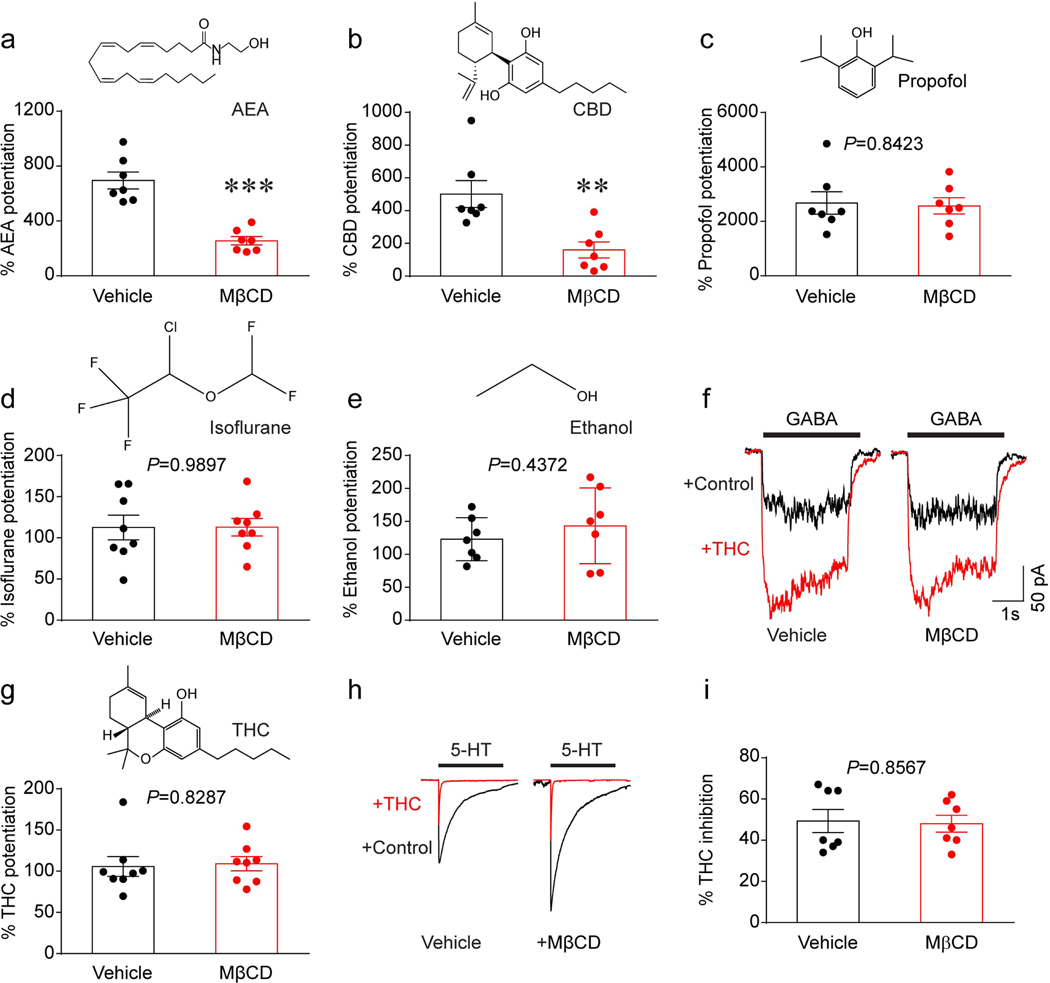
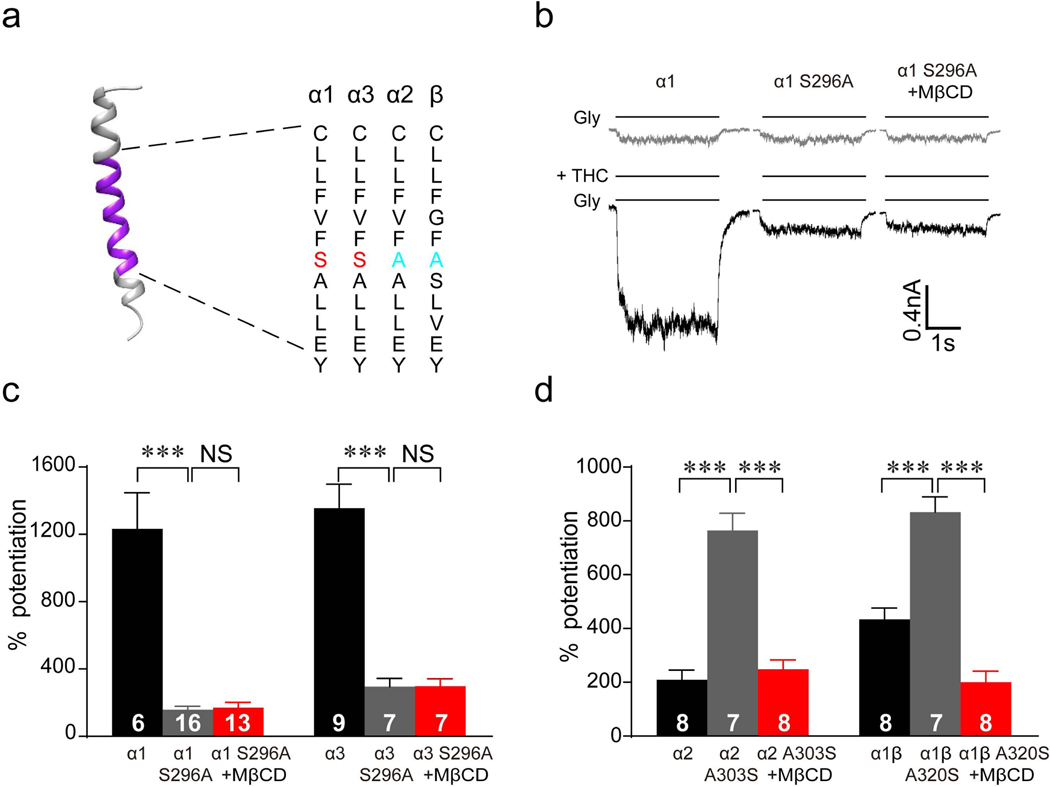
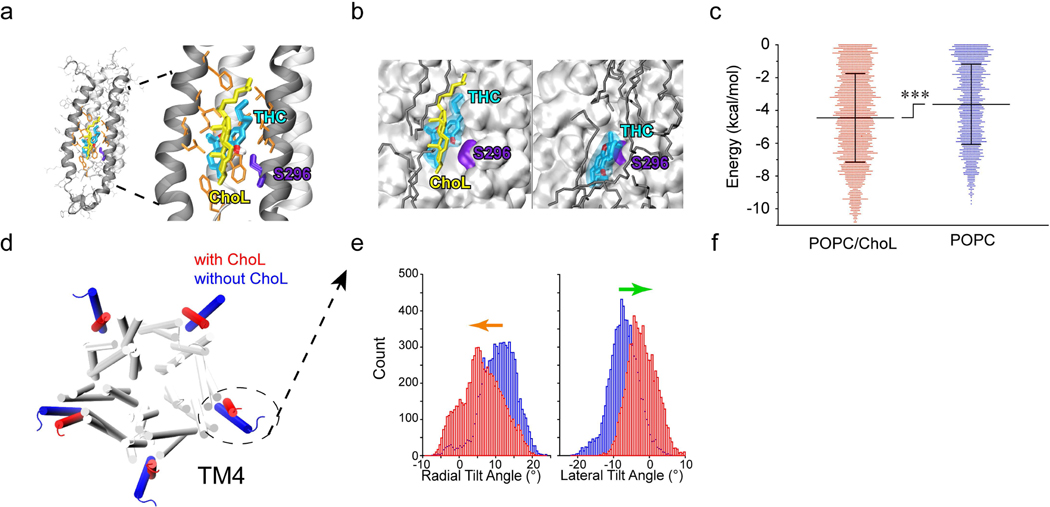
Cannabinoids exert therapeutic effects on several diseases such as chronic pain and startle disease by targeting glycine receptors (GlyRs). Our previous studies have shown that cannabinoids target a serine residue at position 296 in the third transmembrane helix of the α1/α3 GlyR. This site is located on the outside of the ion channel protein at the lipid interface where the cholesterol concentrates. However, whether membrane cholesterol regulates cannabinoid-GlyR interaction remains unknown. Here, we show that GlyRs are closely associated with cholesterol/caveolin-rich domains at subcellular levels. Membrane cholesterol reduction significantly inhibits cannabinoid potentiation of glycine-activated currents in cultured spinal neurons and in HEK 293T cells expressing α1/α3 GlyRs. Such inhibition is fully rescued by cholesterol replenishment in a concentration-dependent manner. Molecular docking calculations further reveal that cholesterol regulates cannabinoid enhancement of GlyR function through both direct and indirect mechanisms. Taken together, these findings suggest that cholesterol is critical for the cannabinoid-GlyR interaction in the cell membrane.

Keywords: cannabinoid; cholesterol; glycine receptor.


Figures

Figure 1.
Figure 1.. Effects of cholesterol depletion on cannabinoid potentiation of GlyRs.
(a) Western blot of α1 GlyR and caveolin-1 in gradient fractions from HEK 293T cells transfected with α1 GlyRs. (b) Upper panel: Total membrane samples were blotted with GAPDH and Caveolin-1. No GAPDH bands were detected, suggesting minimal cytosol contamination. Lower panel: Free cholesterol concentrations of whole-cell lysate and total membrane isolated from HEK 293T cells with or without 0.5% MβCD treatment for 30 min. All data were normalized to their respective controls (vehicle group). (c) The effect of 0.5% MβCD treatment on cholesterol concentrations in gradient fractions of HEK 293T cell membrane (n=7 per group). (d) Free cholesterol concentrations of whole-cell lysate and total membrane isolated from HEK 293T cells pretreated with vehicle, 0.5% MβCD alone, 0.5% MβCD + 0.2 mM cholesterol or 0.5% MβCD + 1 mM cholesterol. All data were normalized to their respective controls (vehicle group). ***P<0.001 based on one-way ANOVA; NS, not significant. (e) Current traces indicating THC potentiation of IGly activated by EC2 concentrations of glycine (5–10 μM) in HEK 293T cells expressing α1 GlyRs pretreated with vehicle, 0.5% MβCD or 0.5% MβCD + 1.0 mM cholesterol for 30 min. (f) Time courses of 1 μM THC potentiation of IGly in α1 GlyR-expressing HEK 293T cells pretreated with vehicle (n=14), 0.5% MβCD alone (n=9), 0.5% MβCD + 0.2 mM cholesterol (n=12) or 0.5% MβCD + 1 mM cholesterol (n=13). Statistical comparisons refer to the data at the 5th minute. (g) THC potentiation of IGly in HEK 293T cells expressing α1, α3 or α1β GlyRs and in cultured spinal neurons pretreated with vehicle or 0.5% MβCD. All digits within the columns represent samples or numbers of cells measured. Data are represented as mean ± SEM. * P < 0.05, ** P < 0.01, *** P < 0.001 based on unpaired t-tests with Welch’s correction.
Figure 2.
Figure 2.. The effects of MβCD treatment on GlyR basal function.
(a) Western blot of α1 GlyR and caveolin-1 in gradient fractions from HEK 293T cells transfected with α1 GlyRs after vehicle or MβCD pretreatment. (b) Current traces of IGly activated by various concentrations of glycine in GlyR α1-expressing HEK 293T cells pretreated with vehicle or MβCD (0.5%, 30 min). (c) Glycine concentration-response curves of HEK 293T cells transfected with α1 GlyR after vehicle (n=6) or MβCD (n=6) pretreatment. (d) The maximum current density of GlyR α1-expressing HEK 293T cells pretreated with vehicle (n=9) or MβCD (n=8). Data are represented as mean ± SEM. P value was determined based on unpaired t-tests with Welch’s correction.
Figure 3.
Figure 3.. The effects of MβCD treatment on cannabinoid modulation of GlyR gating kinetics.
(a-c) Influence of THC on activation (a), deactivation (b) and desensitization (c) time of α1WT or α1S296A mutant GlyR expressed in HEK 293T cells after vehicle, MβCD or MβCD+1.0 mM cholesterol pretreatment. All digits in the columns represent numbers of cells tested. Data are represented as mean ± SEM. *P<0.05, **P<0.01 based on unpaired t-tests with Welch’s correction.
Figure 4.
Figure 4.. Depletion of membrane cholesterol specifically affects cannabinoid-GlyR interaction.
(a-e) Diagrams of chemical structures and the 10 μM AEA- (a), 1 μM CBD- (b), 100 μM propofol- (c), 100 μM isoflurane (d) and 100 mM ethanol- (e) induced potentiation of IGly in GlyR α1-expressing HEK 293T cells pretreated with vehicle or 0.5% MβCD for 30 min. (f) Current traces of IGABA activated by the EC2 concentration of GABA before and after 3 μM THC treatment in α1β2γ2 GABAAR receptor-expressing HEK 293T cells preincubated with vehicle or 0.5% MβCD. (g) Diagrams of THC structures and 3 μM THC-induced potentiation of IGABA in α1β2γ2 GABAAR-expressing HEK 293T cells pretreated with vehicle or 0.5% MβCD for 30 min. (h) Current traces of I5-HT activated by the maximally effective concentration (30 μM) of 5-HT before and during continuous incubation with 0.3 μM THC in 5-HT3A receptor-expressing HEK 293T cells pretreated with vehicle or 0.5% MβCD. (i) The percentage of THC-induced inhibition of I5-HT in HEK 293T cells expressing 5-HT3A receptors after vehicle or 0.5% MβCD treatment. Data are represented as mean ± SEM. **P<0.01, ***P<0.001 based on an unpaired t-test with Welch’s correction.
Figure 5.
Figure 5.. Membrane cholesterol and S296 are both necessary for THC-GlyR interaction.
(a) Amino acid alignment of the third transmembrane helix in α1, α2, α3 and β subunits. (b) Current traces indicating THC (1 μM)-induced potentiation of IGly in HEK 293T cells expressing α1WT GlyRs and α1S296A GlyRs after 0.5% MβCD treatment. (c) Percentage of THC (1 μM)-induced potentiation of IGly in HEK 293T cells expressing α1WT, α3WT, α1S296A and α3S296A GlyRs after vehicle or 0.5% MβCD treatment. ***P<0.001 based on one-way ANOVA. (d) Percentage of THC (1 μM)-induced potentiation of IGly in HEK 293T cells expressing α2WT, α1βWT, α2A303S and α1βA320S GlyRs after vehicle or 0.5% MβCD treatment. All digits in the columns represent numbers of cells tested. Data are expressed as the mean ± SEM. ***P<0.001 based on one-way ANOVA.
Figure 6.
Figure 6.. Cholesterol dependence of THC-GlyR interaction through both direct and indirect mechanisms.
(a) Side view of docking model of α1 GlyR (black ribbons) and THC binding pocket. S296 is highlighted in violet, THC is labeled in cyan and cholesterol (ChoL) is shown in yellow. (b) Representative conformations of THC bound to α1 GlyR in POPC/cholesterol (left) or POPC alone (right). THC binds α1 GlyR closer to S296 and with lower energy in the presence of cholesterol than with POPC (dark gray) alone. (c) Free binding energy required for S296-THC interaction in the presence or absence of cholesterol (n=3). Data are expressed as the mean ± SD. ***P<0.001 based on an unpaired t-test. (d) Cholesterol-induced conformational changes in α1 GlyR in POPC/ChoL and pure POPC. The fourth transmembrane helices (TM4s) are highlighted in the presence of cholesterol (red) and in the absence of cholesterol (blue). (e) Histograms of radial (left) and lateral (right) α1 GlyR TM4 tilt angles in POPC/ChoL (red) and pure POPC (blue). Cholesterol-induced conformational change in TM4. Arrows (radial, orange) and (lateral, green) angles indicate the tilt direction of TM4.

Similar articles

Cited by

References

    1. Allen JA, Halverson-Tamboli RA, and Rasenick MM (2006) Lipid raft microdomains and neurotransmitter signalling. Nature Reviews Neuroscience 8, 128–140 - PubMed
    1. Sooksawate T, and Simmonds MA (2001) Effects of membrane cholesterol on the sensitivity of the GABA(A) receptor to GABA in acutely dissociated rat hippocampal neurones. Neuropharmacology 40, 178–184 - PubMed
    1. Bruses JL, Chauvet N, and Rutishauser U. (2001) Membrane lipid rafts are necessary for the maintenance of the (alpha)7 nicotinic acetylcholine receptor in somatic spines of ciliary neurons. The Journal of neuroscience : the official journal of the Society for Neuroscience 21, 504–512 - PMC - PubMed
    1. Barrantes FJ (2007) Cholesterol effects on nicotinic acetylcholine receptor. J Neurochem 103 Suppl 1, 72–80 - PubMed
    1. Frank C, Giammarioli AM, Pepponi R, Fiorentini C, and Rufini S. (2004) Cholesterol perturbing agents inhibit NMDA-dependent calcium influx in rat hippocampal primary culture. FEBS letters 566, 25–29 - PubMed

Publication types