. 2020 Aug 3;219(8):e201907016.
doi: 10.1083/jcb.201907016.

CDKD-dependent activation of CDKA;1 controls microtubule dynamics and cytokinesis during meiosis

Affiliations

CDKD-dependent activation of CDKA;1 controls microtubule dynamics and cytokinesis during meiosis

Kostika Sofroni et al. J Cell Biol. .

Abstract

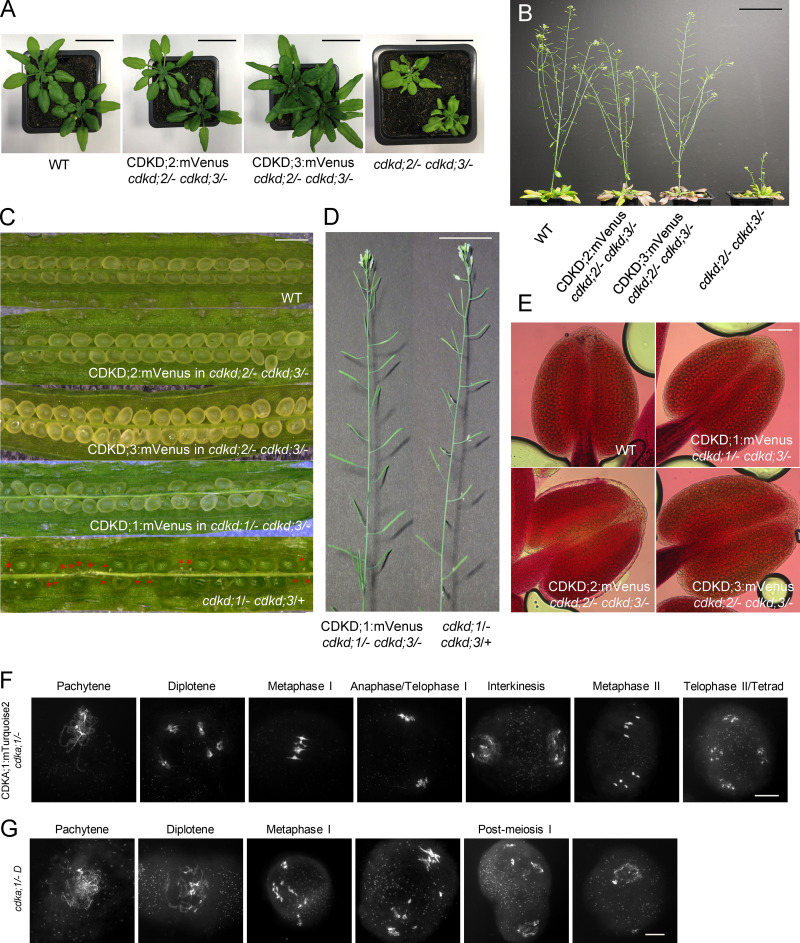
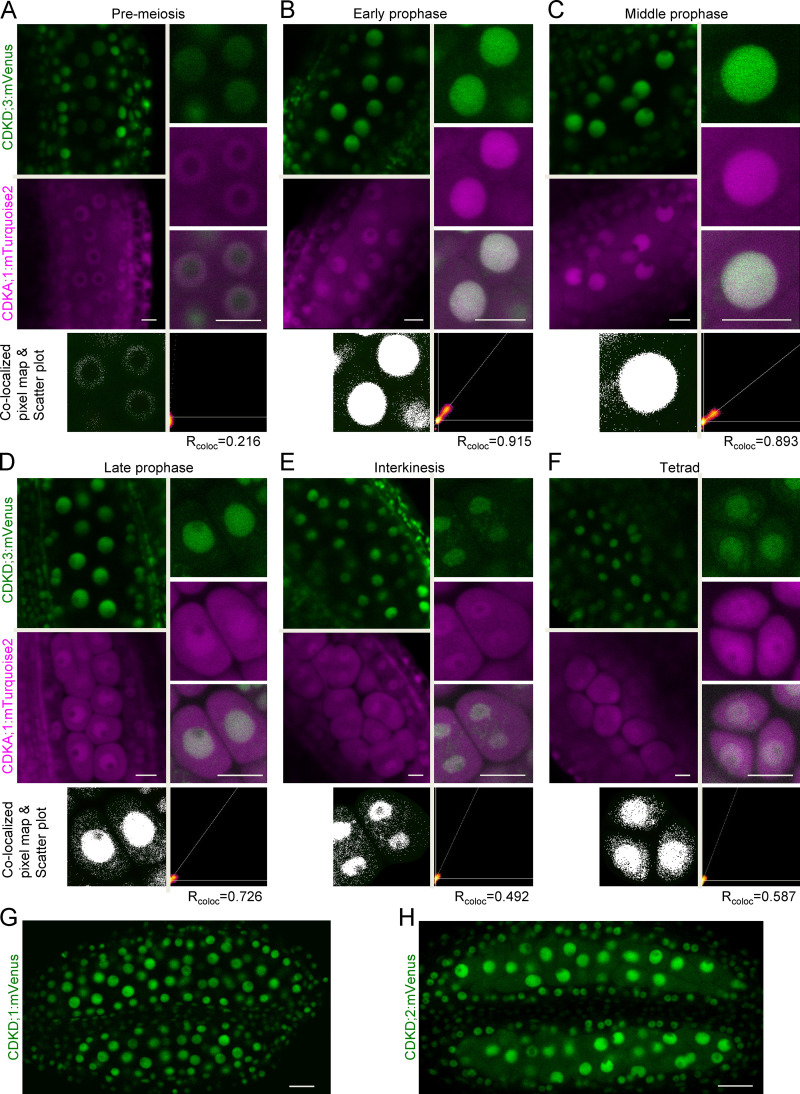
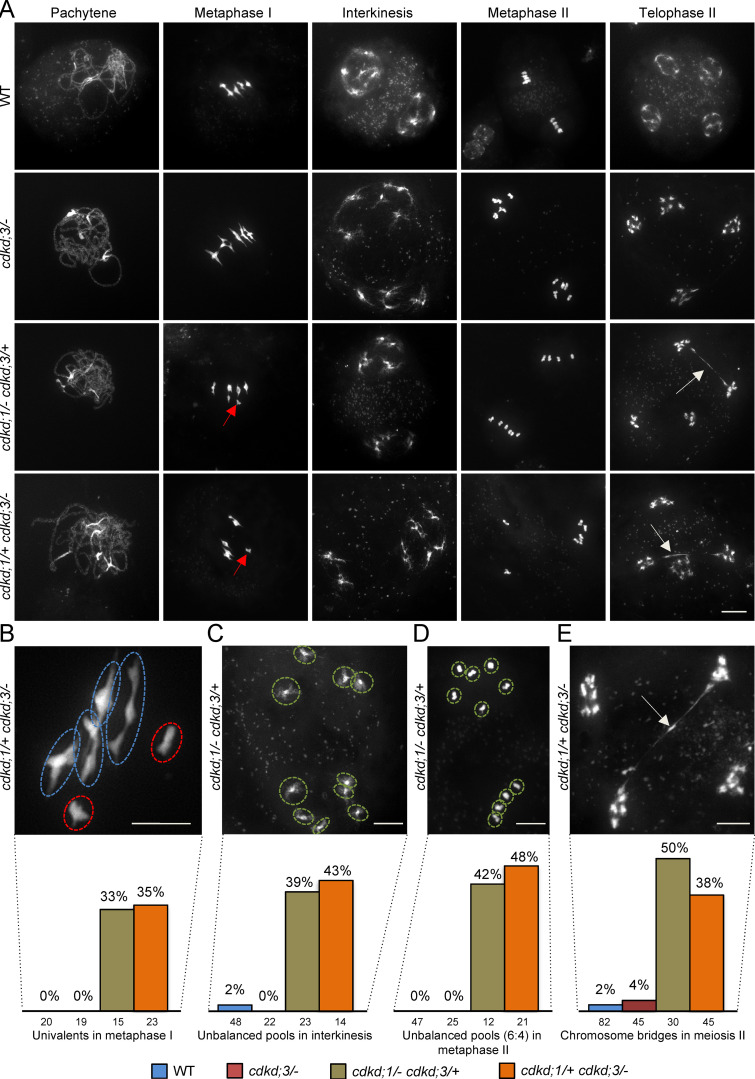
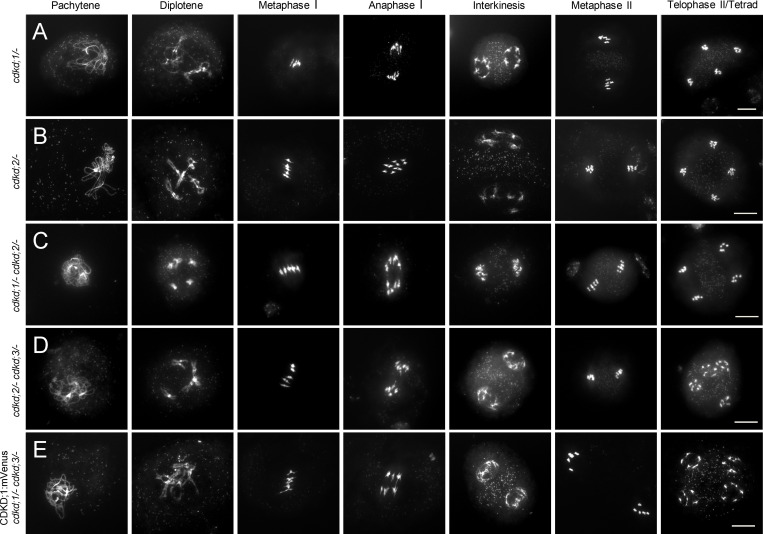
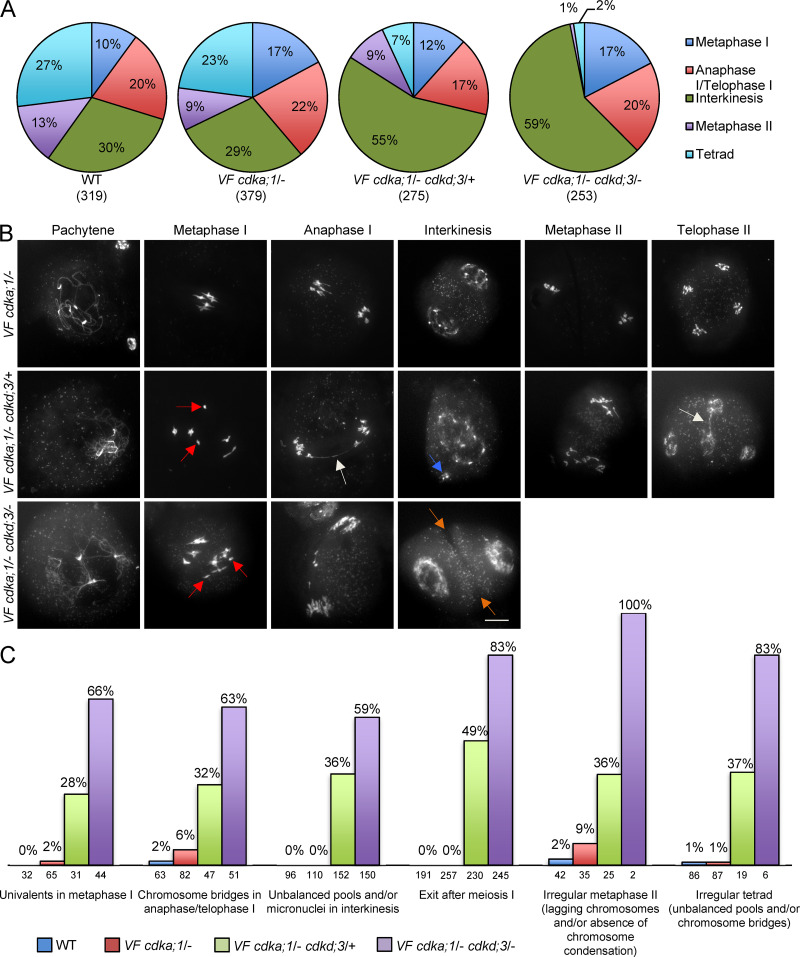
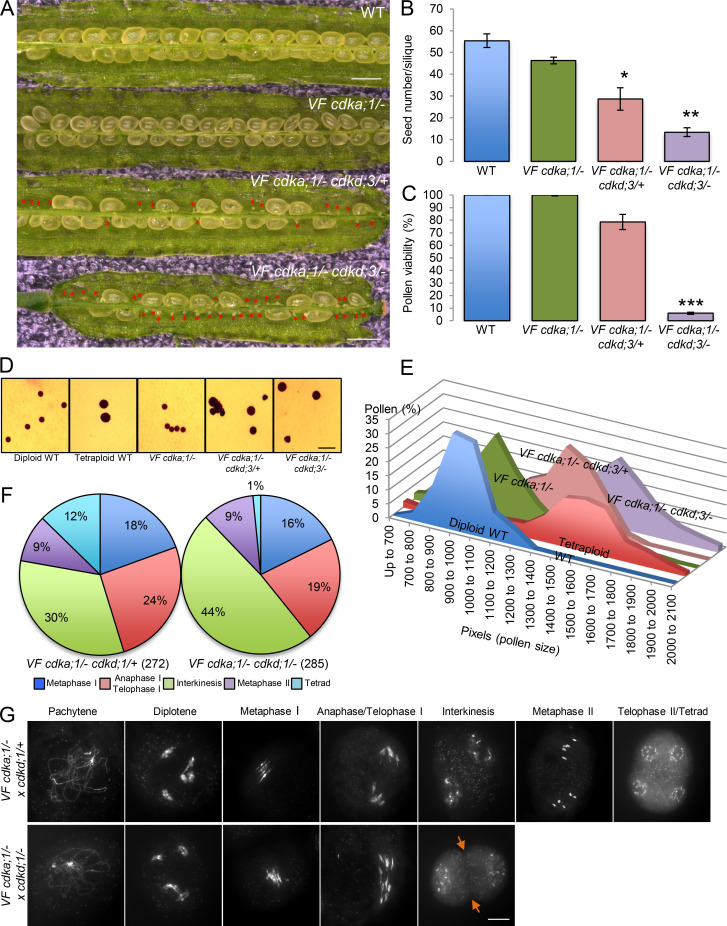
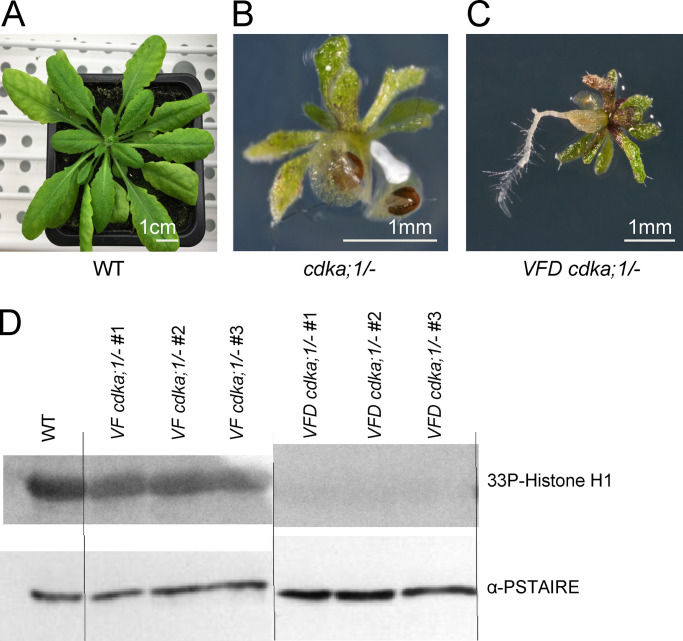
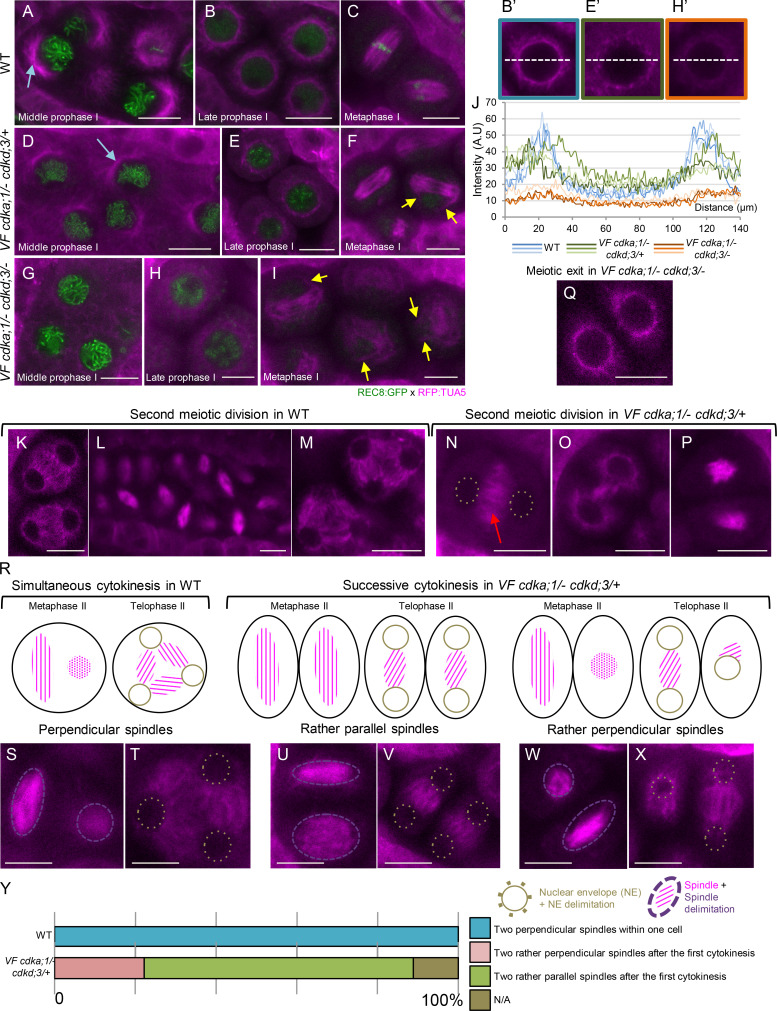
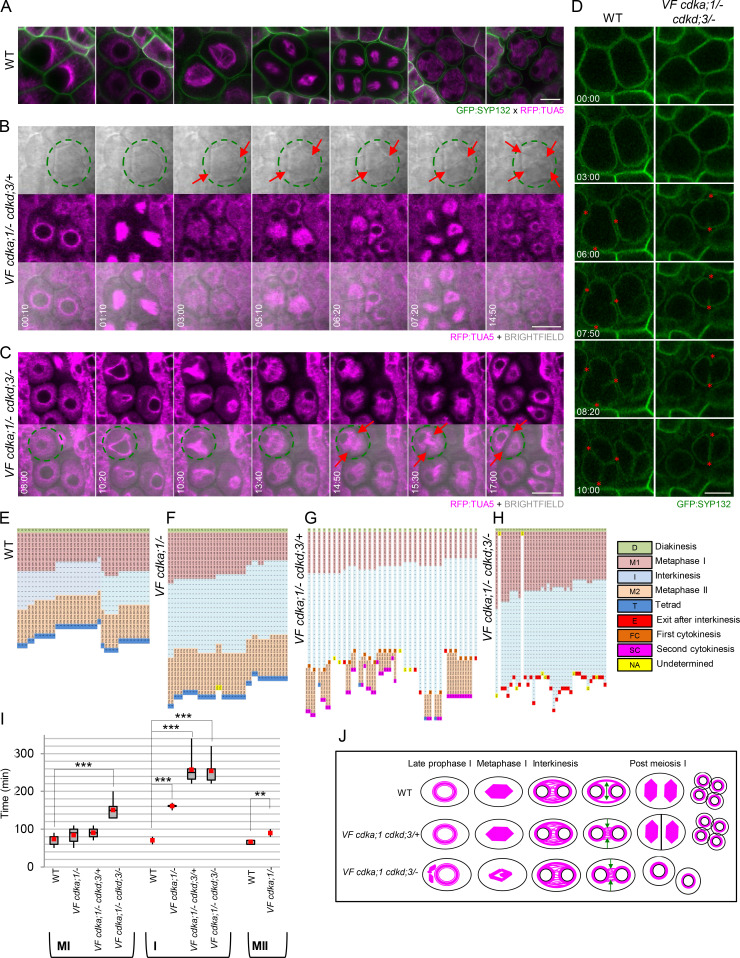
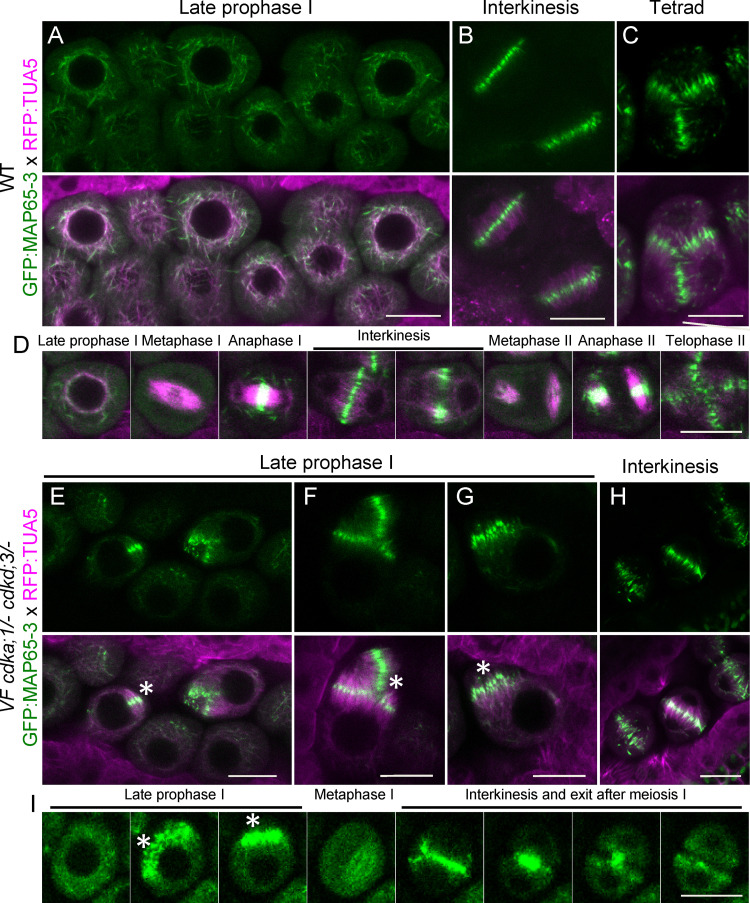
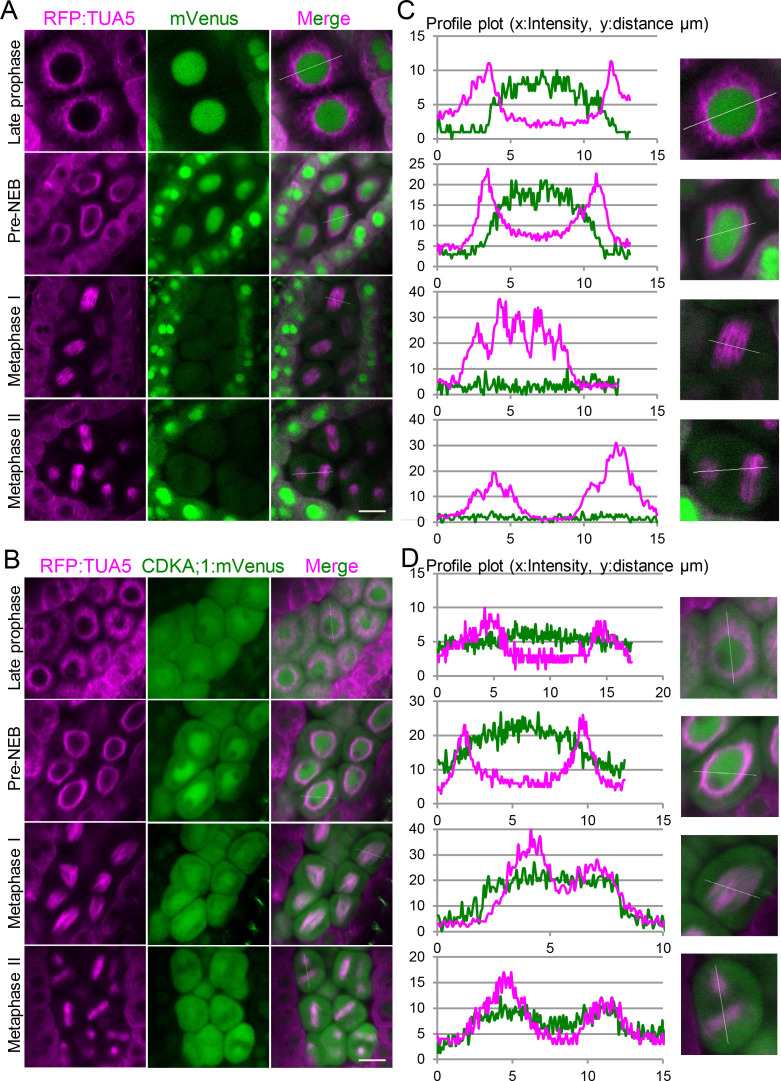
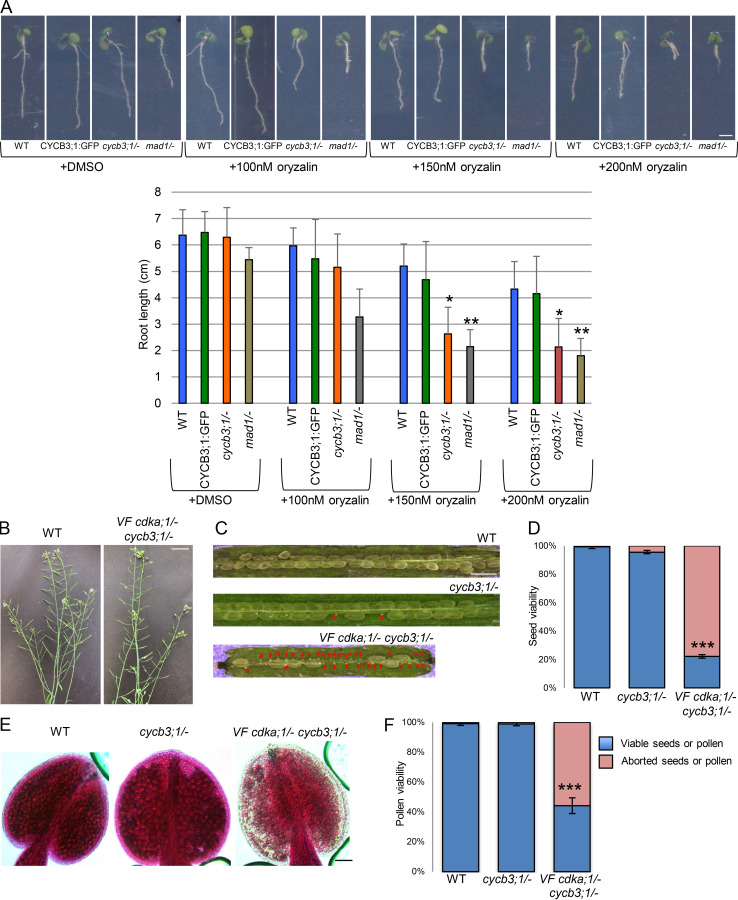
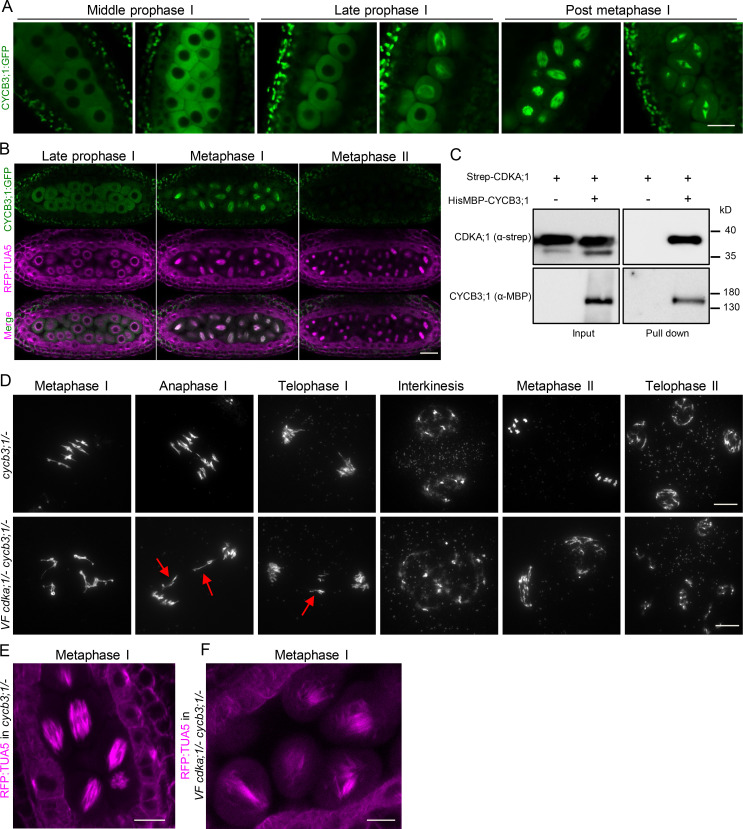
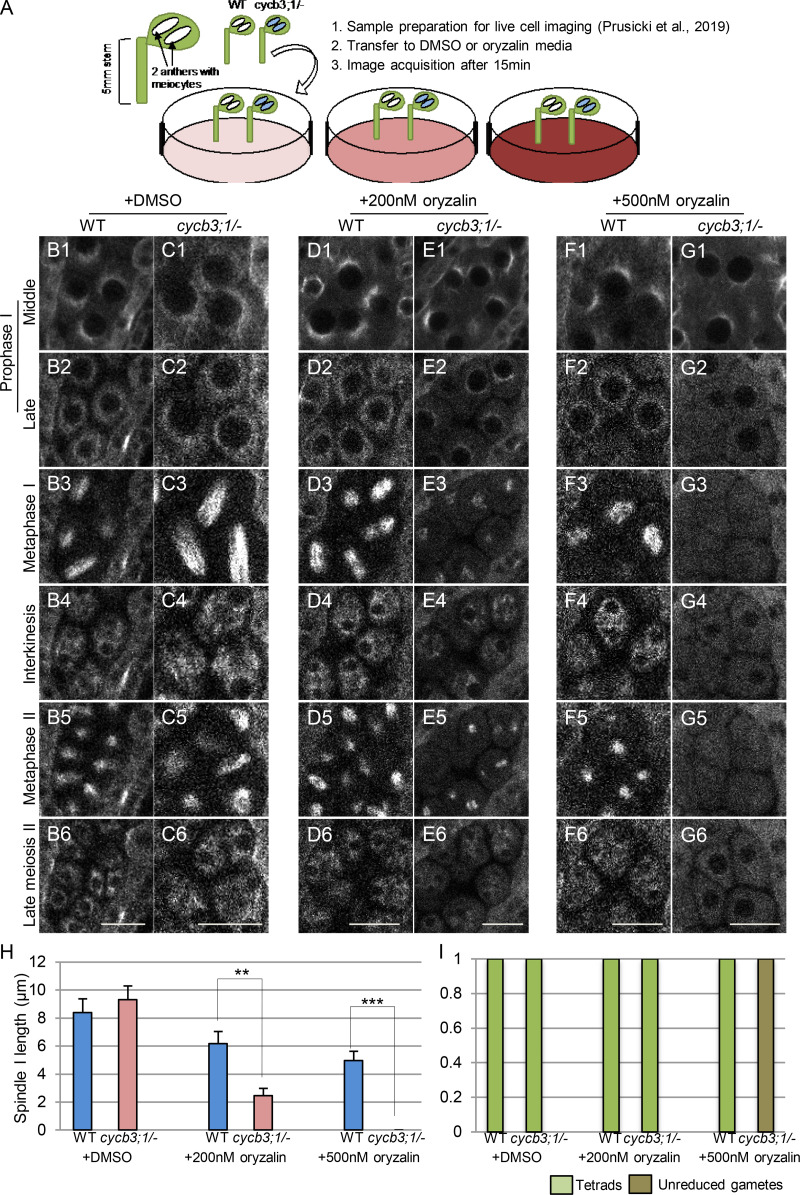
Precise control of cytoskeleton dynamics and its tight coordination with chromosomal events are key to cell division. This is exemplified by formation of the spindle and execution of cytokinesis after nuclear division. Here, we reveal that the central cell cycle regulator CYCLIN DEPENDENT KINASE A;1 (CDKA;1), the Arabidopsis homologue of Cdk1 and Cdk2, partially in conjunction with CYCLIN B3;1 (CYCB3;1), is a key regulator of the microtubule cytoskeleton in meiosis. For full CDKA;1 activity, the function of three redundantly acting CDK-activating kinases (CAKs), CDKD;1, CDKD;2, and CDKD;3, is necessary. Progressive loss of these genes in combination with a weak loss-of-function mutant in CDKA;1 allowed a fine-grained dissection of the requirement of cell-cycle kinase activity for meiosis. Notably, a moderate reduction of CDKA;1 activity converts the simultaneous cytokinesis in Arabidopsis, i.e., one cytokinesis separating all four meiotic products concurrently into two successive cytokineses with cell wall formation after the first and second meiotic division, as found in many monocotyledonous species.


Figures

Figure S1.
Figure S1.
The CDKD;1, CDKD;2, CDKD;3, and CDKA;1 reporter constructs are fully functional. (A) Phenotypes of cdkd;2/− cdkd;3/− double mutants and cdkd;2/− cdkd;3/− double mutants containing a CDKD;2 and CDKD;3 reporter, respectively, in comparison with WT. Photographs were taken 5 wk after sawing. Scale bar, 3 cm. (B) Inflorescences of the cdkd;2/− cdkd;3/− double mutants and the CDKD;2 and CDKD;3 reporter lines (in a cdkd;2/− cdkd;3/− mutant background) in comparison with WT plants of the same age. Photographs were taken 14 wk after sawing. Scale bar, 7 cm. (C) Siliques of WT, the CDKD;2 and CDKD;3 reporters in a cdkd;2/− cdkd;3/− mutant background, and the CDKD;1 reporter in a cdkd;1/− cdkd;3/− mutant background versus cdkd;1/ cdkd;3/+ double mutants, which have a high level of seed abortion, indicated by red asterisks. Scale bar, 1 mm. (D) The main stem and siliques of the CDKD;1 reporter line in a cdkd;1/− cdkd;3/− background versus cdkd;1/− cdkd;3/+ double mutant. Scale bar, 3 cm. (E) Peterson staining of anthers for WT, CDKD;1, CDKD;2 and CDKD;3 reporter lines in the indicated cdkd mutant background. Scale bar, 20 µm. (F and G) Chromosome spread analysis of CDKA;1:mTurquoise2 in cdka;1/− (F) versus cdka;1/− D mutant (G). Scale bar, 10 µm.
Figure S2.
Figure S2.
CDKD;3 and CDKA;1 are expressed throughout meiosis and colocalize in the nucleus. Confocal laser scanning micrographs showing the localization of the functional CDKD;3:mVenus (green) and CDKA;1:mTurquoise2 (magenta) fusion proteins in male anthers of Arabidopsis. (A–F) During prophase I (A–D), interkinesis (E), and tetrad stage (F), both proteins enrich and differentially colocalize in the meiocyte nucleus, as shown in every third row by the colocalized pixel map and scatter plot. The diagonal white line in the scatter plot represents the ratio of the intensities of the two channels (Rcoloc). Scale bar, 10 µm. (G) Confocal laser scanning micrographs of anthers showing the accumulation of the CDKD;1:mVenus fusion protein in green. (H) Accumulation pattern of the CDKD;2:mVenus fusion protein in whole anthers. Scale bar, 20 µm.
Figure 1.
Figure 1.
Analysis of meiotic defects in cdkd mutants. (A) Chromosome spread analysis of male meiocytes in WT versus single cdkd;3 mutants and two different double cdkd;1 cdkd;3 mutant combinations during pachytene, metaphase I, interkinesis, metaphase II, and telophase II. Red arrows indicate univalents in metaphase I, and white arrows designate chromosome bridges in telophase II. (B) Close-up of chromosomes with missing chiasmata in metaphase I of cdkd;1/+ cdkd;3/−. Red circles highlight univalents, and blue circles, bivalents. (C–E) Unbalanced chromosome pools in interkinesis (C) and metaphase II (D), and a chromosome bridge in telophase II (E) in cdkd;1/+ cdkd;3/− double mutants. In the last row, quantification of meiotic defects observed in cdkd;3/− (n = 66), cdkd;1/− cdkd;3/+ (n = 50), and cdkd;1/+ cdkd;3/− (n = 58) versus WT (n = 115). The numbers under every column indicate the meiocytes found per stage. Scale bar, 10 µm.
Figure S3.
Figure S3.
Chromosome spreads of single and double cdkd mutants and CDKD reporter lines used in this study. (A–E) Chromosome spreads with WT-like meiotic progression in cdkd;1/− (A), cdkd;2/− (B), cdkd;1/− cdkd;2/− (C), cdkd;2/− cdkd;3/− (D), and CDKD;1:mVenus in cdkd;1/− cdkd;3/− (E). Scale bar, 10 µm.
Figure 2.
Figure 2.
Analysis of meiotic defects in VF and VF cdkd;3 double mutant combinations. (A) Repartition of meiotic stages within one single flower bud undergoing meiosis from metaphase I to telophase II/tetrad stage in WT (n = 319), VF cdka;1/− (n = 379), VF cdka;1/− cdkd;3/+ (n = 275), and VF cdka;1/− cdkd;3/− (n = 253). (B) Chromosome spreads of male meiocytes in VF cdka;1 and VF cdka;1 cdkd;3 double mutants. Red arrows indicate univalents/fragments in metaphase I, white arrows pinpoint chromosome bridges in anaphase I and/or telophase II, blue arrows highlight micronuclei in interkinesis, and orange arrows point to premature cell wall formation in interkinesis. Scale bar, 10 µm. (C) Quantification of meiotic defects observed in VF cdka;1 cdkd;3 double mutants versus WT given in percentage of meiocytes of one genotype that show the respective feature. The numbers under every column indicate the meiocytes found per stage.
Figure S4.
Figure S4.
Phenotypic characterization of VF cdka;1 cdkd;3 and VF cdka;1 cdkd;1 mutant combinations. (A) Siliques of WT versus VF cdka;1/−, VF cdka;1/− cdkd;3/+, and VF cdka;1/− cdkd;3/−. Red asterisks indicate aborted seeds. Scale bar, 1 mm. (B and C) Number of aborted seeds in at least five siliques (B) and pollen viability using at least eight flower buds (C) for the genotypes shown in A. Level of significance (*, P < 0.05; **, P < 0.01; ***, P < 0.001) determined by one-way ANOVA followed by Tukey’s test. (D) Pollen sizes (in pixels) after Peterson staining of diploid and tetraploid WT pollen versus pollen from VF cdka;1/−, VF cdka;1/− cdkd;3/+, and VF cdka;1/− cdkd;3/− from ≥500 pollen grains for each genotype. (E) Peterson staining revealing the difference in pollen size for the genotypes quantified in D. Scale bar, 20 µm. (F) Repartition of meiotic stages within one flower bud undergoing meiosis from metaphase I to telophase II/tetrad in VF cdka;1/− cdkd;1/+ (n = 272) and VF cdka;1/− cdkd;1/− (n = 285). (G) Chromosome spread analysis of male meiocytes of VF cdka;1/− cdkd;1/+ and VF cdka;1/− cdkd;1/−. Orange arrows highlight the premature exit after meiosis I in 75% of the meiocytes analyzed. Scale bar, 10 µm.
Figure 3.
Figure 3.
Characterization of the VFD cdka;1 mutant. (A–C) Comparison between a WT Arabidopsis plant (A), the cdka;1/− null mutant (B), and the cdka;1/− VFD mutant (C). The cdka;1/− VFD mutants are reduced in growth to a similar extent as the homozygous cdka;1 mutant but develop a root. (D) Upper row: CDK-kinase assays with plant material of WT, VF cdka;1/−, and VFD cdka;1/− using bovine histone H1 as a substrate. Lower row: CDKA;1 protein levels per kinase assay were visualized using an α-PSTAIRE antibody.
Figure 4.
Figure 4.
Microtubule arrays in WT versus VF cdka;1/ cdkd;3 mutants. (A–I) Confocal laser scanning micrographs of meiocytes expressing TagRFP:TUA5 (magenta) and REC8:GFP (green) from mid-prophase I to metaphase I in WT (A–C), VF cdka;1/− cdkd;3/+ (D–F), and VF cdka;1/− cdkd;3/− (G–I). Light-blue arrows indicate the half-moon configuration of microtubules present in WT that is lost in VF cdka;1/− cdkd;3/−. The yellow arrows highlight irregular spindles in metaphase I. (J, B′, E′, and H′) Pixel intensity quantification from three meiocytes at late prophase I in WT (B′ and blue lines), VF cdka;1/− cdkd;3/+ (E′ and green lines), and VF cdka;1/− cdkd;3/− (H′ and orange lines) of a section going through the middle of the meiocyte (white dotted line). (K–Q) After metaphase I, meiotic exit and dyad formation in VF cdka;1/− cdkd;3/− (Q), second meiotic division in WT (K–M) and VF cdka;1/− cdkd;3/+ (N–P). Red arrows indicate the midzone microtubule array. (R–X) Schematic representation (R) of simultaneous cytokinesis in WT, which is characterized by two perpendicular spindles at metaphase II and a tetrahedral tetrad (S and T), versus successive cytokinesis in VF cdka;1/− cdkd;3/+ mutant, in which the predominant spindle configuration is parallel, leading to a planar tetrad (U–X). (Y) Spindle orientation quantification for WT (n = 40) and VF cdka;1/− cdkd;3/+ (n = 36). Scale bar, 10 µm.
Figure 5.
Figure 5.
Analysis of meiotic progression in WT and VF cdkd;3 mutants. (A) Confocal laser scanning micrographs of male meiocytes expressing TagRFP:TUA5 (magenta) and GFP:SYP132 (green) during meiotic progression in WT (time indicated with white numbers: h:min). See also Video 1 A. (B) Meiotic progression in VF cdka;1/− cdkd;3/+ (time indicated with white numbers: h:min) showing the conversion of a simultaneous into a successive cytokinesis in one male meiocyte highlighted with a green circle (from Video 2). TagRFP:TUA5 in magenta and bright field in gray, overlay in the third row, cell wall deposition is marked with red arrows. (C) Meiotic progression in one meiocyte (green circle) of VF cdka;1/− cdkd;3/− mutant expressing TagRFP:TUA5 (in magenta) and the respective overlay with the bright field in the second row, showing microtubule dynamics and cell wall deposition (red arrows) from late prophase I to meiotic exit (from Video 3; time indicated with white numbers: h:min). (D) Comparison of simultaneous cytokinesis in WT versus meiotic exit in VF cdka;1/− cdkd;3/− using GFP:SYP132 (green) as plasma membrane marker (from Video 4). Red asterisks mark the initiation and the outside-in direction of cell wall deposition during cytokinesis; time indicated with white numbers: h:min). (E–H) Comparison of the duration of meiotic stages for single meiocytes between WT (E), VF cdka;1/− (F), VF cdka;1/− cdkd;3/+ (G), and VF cdka;1/− cdkd;3/− (H). Every line represents a single cell undergoing meiosis, and every square, a 10-min interval of a specific meiotic stage: diakinesis (D), metaphase I (M1), interkinesis (I), metaphase II (M2), and telophase II/tetrad (T). In some mutants, exit after interkinesis (E) or a first cytokinesis (FC) is observed. After the second meiotic division, a second cytokinesis (SC) finally leads to the formation of meiotic products. Data aligned by taking a starting point 10 min before the first meiotic spindle is visible and, as final time point, 10 min after the spindle of the second meiotic division disappears. (I) Box plots of metaphase I, interkinesis, and metaphase II duration in WT (n = 38), VF cdka;1/− (n = 40), VF cdka;1/− cdkd;3/+ (n = 34), and VF cdka;1/− cdkd;3/− (n = 37). Red dots represent the mean value. Level of significance (*, P < 0.05; **, P < 0.01; ***, P < 0.001) determined by one-way ANOVA followed by Tukey’s test. (J) Cartoons summarizing microtubule organization during meiotic progression in WT versus VF cdka;1 cdkd;3 mutant combinations. Green arrows represent the direction of microtubule removal in the midzone during late interkinesis. Scale bar in A–D, 10 µm.
Figure 6.
Figure 6.
Formation of premature antiparallel microtubule bundle structures in plants with low CDKA;1 activity. (A–C) Confocal laser scanning micrographs of meiocytes expressing TagRFP:TUA5 (magenta) and GFP:MAP65-3 (green) at late prophase (A), interkinesis (B) and tetrad (C) in WT. (D) Time course of TagRFP:TUA5 and GFP:MAP65-3 from late prophase to telophase II in WT (from Video 5). (E–H) Confocal micrographs of meiocytes expressing TagRFP:TUA5 (magenta) and GFP:MAP65-3 (green) at late prophase (E–G) and interkinesis (H) in VF cdka;1/− cdkd;3/−. (I) Time course of TagRFP:TUA5 and GFP:MAP65-3 from late prophase to exit after meiosis I in VF cdka;1/− cdkd;3/− (from Video 6). White asterisks highlight antiparallel microtubule bundles. Scale bar, 10 µm.
Figure 7.
Figure 7.
CDKA;1 colocalizes with the spindle in metaphase I and metaphase II. (A) Confocal laser scanning micrographs showing the localization of TagRFP:TUA5 (magenta, first column) expressed from the PRORPS5A promoter and mVenus (green, second column) expressed from the PROCDKA;1 promoter in late prophase, shortly before NEB, metaphase I, and metaphase II. Third column represents the merge of the two channels. (C) Signal intensity plot profile of a section (white line) through one meiocyte shown in A (close-up in second column). (B) Confocal laser scanning micrographs showing the localization of Tag:RFP:TUA5 (magenta, first column) expressed from the PRORPS5A promoter and a CDKA:mVenus (green, second column) fusion proteins expressed from the PROCDKA;1 promoter in late prophase, shortly before NEB, and metaphase I and II. Third column represents the merge of the two channels. (D) Signal intensity plot profile of a section (white line) through one meiocyte (close-up in second column). Scale bar, 10 µm.
Figure S5.
Figure S5.
Analysis of VF cdka;1/− cycb3;1/− mutant and functionality of the CYCB3;1:GFP reporter construct. (A) 9-d-old seedlings grown on plates with DMSO and 100, 150, and 200 nM oryzalin (upper panel). Mutants in the spindle assembly checkpoint component MAD1 are used as a positive control for hypersensitivity to oryzalin. Scale bar, 2 cm. Root length on plates with and without oryzalin (lower panel). The mean (± SD) of >20 seedlings per indicated genotype is shown. Level of significance (*, P < 0.05; **, P < 0.01; ***, P < 0.001***) determined by one-way ANOVA followed by Tukey’s test. (B) The main stem and siliques of VF cdka;1/− cycb3;1/− mutant in comparison to WT. Scale bar, 3 cm. (C) Siliques of WT, cycb3;1/−, and VF cdka;1/− cycb3;1/− double mutant, which show seed abortion highlighted by red asterisks. Scale bar, 1 mm. (D) Quantification of seed abortion in at least six siliques for each genotype. The percentage of viable seeds is represented by blue bars, and red bars indicate the percentage of aborted seeds from C. (E) Peterson staining of anthers for WT, cycb3;1/−, and VF cdka;1/− cycb3;1/−. Scale bar, 20 µm. (F) Quantification of pollen viability from at least six flower buds for each genotype. Blue bars indicate the percentage of viable pollen, and red bars give the percentage of aborted pollen from E.
Figure 8.
Figure 8.
Characterization of CYCB3;1 in meiosis. (A) Confocal laser scanning micrographs showing the localization of a functional reporter for CYCB3;1 (CYCB3;1:GFP in green) throughout meiosis. Scale bar, 10 µm. (B) Confocal micrographs of TagRFP:TUA5 (magenta) and CYCB3;1:GFP (green) at late prophase and metaphase I and II (from Video 7). CYCB3;1 colocalizes with the first but not the second spindle. Scale bar, 20 µm. (C) CYCB3;1 forms a complex with CDKA;1. Pull-down assay using Strep-CDKA;1 in the presence or absence of HisMBP-CYCB3;1. The input and pull-down fractions were detected by immunoblotting with anti-Strep (upper panel) and anti-MBD (lower panel) antibodies. (D) Chromosome spread analysis of cycb3;1/− versus VF cdka;1/− cycb3;1/− during metaphase I, anaphase I, telophase I, interkinesis, metaphase II, and telophase II. Red arrows mark lagging chromosomes at anaphase I and telophase I. Scale bar, 10 µm. (E and F) Confocal laser scanning micrographs of TagRFP:TUA5 during metaphase I in cycb3;1/− (E) and VF cdka;1/− cycb3;1/− (F). Microtubule arrays are altered in VF cdka;1/− cycb3;1/− as represented by irregular spindles at metaphase I. Scale bar, 10 µm.
Figure 9.
Figure 9.
Meiocytes of cycb3;1/ mutants are hypersensitive to oryzalin. (A) Scheme of live-cell imaging of male meiocytes treated with oryzalin. (B–G) Time points of meiotic progression in meiocytes expressing TagRFP:TUA5 in WT (B1–B6) and cycb3;1/− (C1–C6) with DMSO (from Video 8); WT (D1–D6) and cycb3;1/− (E1–E6) with 200 nM oryzalin (from Video 9); and WT (F1–F6) and cycb3;1/− (G1–G6) with 500 nM oryzalin (from Video 10). Scale bar, 10 µm. (H) Spindle length at metaphase I of meiocytes from at least three different anthers of WT (n = 28) and cycb3;1/− (n = 23) treated with DMSO; WT (n = 22) and cycb3;1/− (n = 25) treated with 200 nM oryzalin; and WT (n = 23) and cycb3;1/− (n = 20) treated with 500 nM oryzalin. Level of significance (*, P < 0.05; **, P < 0.01; ***, P < 0.001) determined by one-way ANOVA followed by Tukey’s test. (I) Number of meiotic products (tetrads or unreduced gametes) of meiocytes from at least three different anthers of WT (n = 28) and cycb3;1/− (n = 23) treated with DMSO; WT (n = 22) and cycb3;1/− (n = 25) treated with 200 nM oryzalin; and WT (n = 23) and cycb3;1/− (n = 20) treated with 500 nM oryzalin.

Similar articles

Cited by

References

    1. Adhikari D., Zheng W., Shen Y., Gorre N., Ning Y., Halet G., Kaldis P., and Liu K.. 2012. Cdk1, but not Cdk2, is the sole Cdk that is essential and sufficient to drive resumption of meiosis in mouse oocytes. Hum. Mol. Genet. 21:2476–2484. 10.1093/hmg/dds061 - DOI - PubMed
    1. Albert B., Raquin C., Prigent M., Nadot S., Brisset F., Yang M., and Ressayre A.. 2011. Successive microsporogenesis affects pollen aperture pattern in the tam mutant of Arabidopsis thaliana. Ann. Bot. 107:1421–1426. 10.1093/aob/mcr074 - DOI - PMC - PubMed
    1. Azumi Y., Liu D., Zhao D., Li W., Wang G., Hu Y., and Ma H.. 2002. Homolog interaction during meiotic prophase I in Arabidopsis requires the SOLO DANCERS gene encoding a novel cyclin-like protein. EMBO J. 21:3081–3095. 10.1093/emboj/cdf285 - DOI - PMC - PubMed
    1. Binarová P., Doležel J., Draber P., Heberle-Bors E., Strnad M., and Bögre L.. 1998. Treatment of Vicia faba root tip cells with specific inhibitors to cyclin-dependent kinases leads to abnormal spindle formation. Plant J. 16:697–707. 10.1046/j.1365-313x.1998.00340.x - DOI - PubMed
    1. Bulankova P., Akimcheva S., Fellner N., and Riha K.. 2013. Identification of Arabidopsis meiotic cyclins reveals functional diversification among plant cyclin genes. PLoS Genet. 9 e1003508 10.1371/journal.pgen.1003508 - DOI - PMC - PubMed

Publication types

MeSH terms