Observational Study
. 2020 Oct 1;180(10):1336-1344.
doi: 10.1001/jamainternmed.2020.3391.

Estimation of Excess Deaths Associated With the COVID-19 Pandemic in the United States, March to May 2020

Affiliations
Observational Study

Estimation of Excess Deaths Associated With the COVID-19 Pandemic in the United States, March to May 2020

Daniel M Weinberger et al. JAMA Intern Med. .

Abstract

Importance: Efforts to track the severity and public health impact of coronavirus disease 2019 (COVID-19) in the United States have been hampered by state-level differences in diagnostic test availability, differing strategies for prioritization of individuals for testing, and delays between testing and reporting. Evaluating unexplained increases in deaths due to all causes or attributed to nonspecific outcomes, such as pneumonia and influenza, can provide a more complete picture of the burden of COVID-19.

Objective: To estimate the burden of all deaths related to COVID-19 in the United States from March to May 2020.

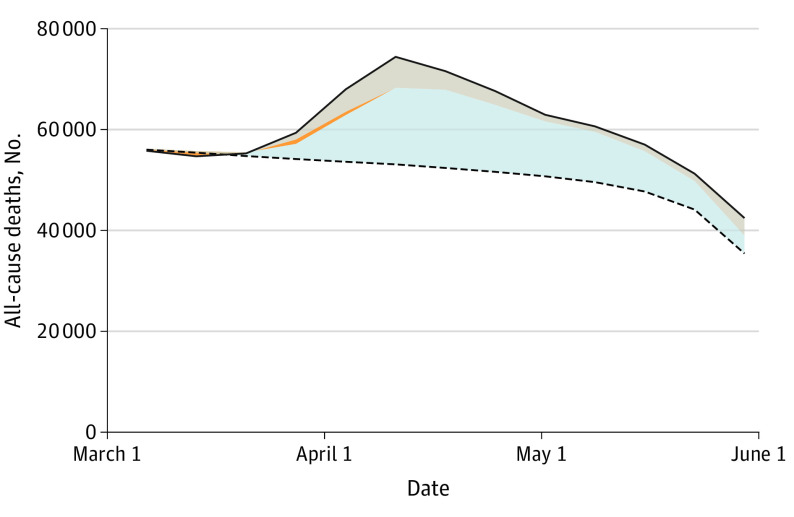
Design, setting, and population: This observational study evaluated the numbers of US deaths from any cause and deaths from pneumonia, influenza, and/or COVID-19 from March 1 through May 30, 2020, using public data of the entire US population from the National Center for Health Statistics (NCHS). These numbers were compared with those from the same period of previous years. All data analyzed were accessed on June 12, 2020.

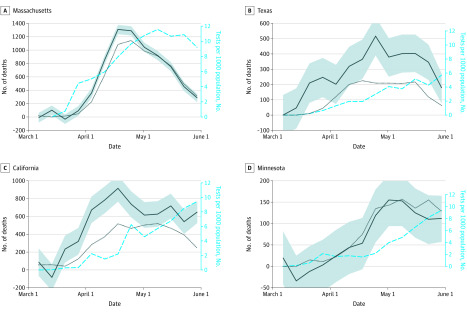
Main outcomes and measures: Increases in weekly deaths due to any cause or deaths due to pneumonia/influenza/COVID-19 above a baseline, which was adjusted for time of year, influenza activity, and reporting delays. These estimates were compared with reported deaths attributed to COVID-19 and with testing data.

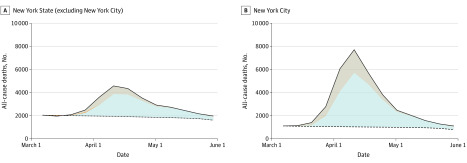
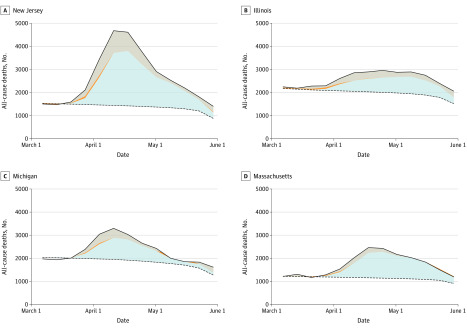
Results: There were approximately 781 000 total deaths in the United States from March 1 to May 30, 2020, representing 122 300 (95% prediction interval, 116 800-127 000) more deaths than would typically be expected at that time of year. There were 95 235 reported deaths officially attributed to COVID-19 from March 1 to May 30, 2020. The number of excess all-cause deaths was 28% higher than the official tally of COVID-19-reported deaths during that period. In several states, these deaths occurred before increases in the availability of COVID-19 diagnostic tests and were not counted in official COVID-19 death records. There was substantial variability between states in the difference between official COVID-19 deaths and the estimated burden of excess deaths.

Conclusions and relevance: Excess deaths provide an estimate of the full COVID-19 burden and indicate that official tallies likely undercount deaths due to the virus. The mortality burden and the completeness of the tallies vary markedly between states.


Conflict of interest statement

Conflict of Interest Disclosures: Dr Weinberger reported receipt of consulting fees from Pfizer, Merck, GlaxoSmithKline, and Affinivax for topics unrelated to this work and being principal investigator on a research grant from Pfizer on an unrelated topic. Dr Pitzer reported having received reimbursement from Merck and Pfizer for travel expenses to scientific input engagements unrelated to the topic of this work and being a member of the World Health Organization Immunization and Vaccine-related Implementation Research Advisory Committee (IVIR-AC). No other disclosures were reported.

Figures

Figure 1.
Figure 1.. Excess Deaths in the United States From March 1 Through May 30, 2020
The observed number of deaths is indicated by the solid line, and the expected number of deaths, adjusting for seasonality, influenza epidemics, and reporting delays, is indicated by the dashed line. The area between these 2 lines represents the total number of excess deaths: blue-gray (bottom), deaths recorded as due to COVID-19; orange (narrow middle section), additional pneumonia and influenza excess deaths not coded as due to COVID-19; and beige (top), deaths that were not attributed to COVID-19, pneumonia, or influenza.
Figure 2.
Figure 2.. Excess Deaths in New York State (Excluding New York City) and in New York City From March 1 Through May 30, 2020
The observed number of deaths is indicated by the solid line, and the expected number of deaths, adjusting for seasonality, influenza epidemics, and reporting delays, is indicated by the dashed line. The area between these 2 lines represents the total number of excess deaths: blue-gray (bottom), deaths recorded as due to COVID-19; orange (narrow middle section), additional pneumonia and influenza excess deaths not coded as due to COVID-19; and beige (top), deaths that were not attributed to COVID-19, pneumonia, or influenza.
Figure 3.
Figure 3.. Excess Deaths in 4 States With Large Numbers of Reported COVID-19 Deaths From March 1 Through May 30, 2020
Observed number of deaths are indicated by solid lines, and the expected number of deaths, adjusting for seasonality, influenza epidemics, and reporting delays, are indicated by the dashed lines. The area between these 2 lines represents the total number of excess deaths: blue-gray (bottom), deaths recorded as due to COVID-19; orange (narrow middle section), additional pneumonia and influenza excess deaths not coded as due to COVID-19; and beige (top), deaths that were not attributed to COVID-19, pneumonia, or influenza.
Figure 4.
Figure 4.. Trends in Excess Mortality Due to All Causes or Reported Deaths Due to COVID-19 From March 1 Through May 30, 2020
Excess deaths due to all causes are indicated by solid black lines; shaded areas are 95% prediction intervals. Reported deaths due to COVID-19 are indicated by dotted black lines. Dashed blue lines indicate the volume of tests performed per 1000 population in that week.

Comment in

  • doi: 10.1001/jama.2020.11761

Similar articles

Cited by

References

    1. WHO director-general’s opening remarks at the media briefing on COVID-19, 11 March 2020. World Health Organization website. Accessed June 19, 2020. https://www.who.int/dg/speeches/detail/who-director-general-s-opening-re...
    1. Li R, Pei S, Chen B, et al. . Substantial undocumented infection facilitates the rapid dissemination of novel coronavirus (SARS-CoV-2). Science. 2020;368(6490):489-493. doi:10.1126/science.abb3221 - DOI - PMC - PubMed
    1. Yang Y, Yang M, Shen C, et al. Evaluating the accuracy of different respiratory specimens in the laboratory diagnosis and monitoring the viral shedding of 2019-nCoV infections. medRxiv Preprint posted February 17, 2020.
    1. Kucirka L, Lauer S, Laeyendecker O, Boon D, Lessler J Variation in false negative rate of RT-PCR based SARS-CoV-2 tests by time since exposure. medRxiv Preprint posted April 10, 2020. - PMC - PubMed
    1. Serfling RE. Methods for current statistical analysis of excess pneumonia-influenza deaths. Public Health Rep. 1963;78(6):494-506. doi:10.2307/4591848 - DOI - PMC - PubMed

Publication types

MeSH terms