Regional changes in tuberculosis disease burden among adolescents in South Africa (2005-2015)
- PMID: 32609738
- PMCID: PMC7329123
- DOI: 10.1371/journal.pone.0235206
Regional changes in tuberculosis disease burden among adolescents in South Africa (2005-2015)
Abstract
Background: Adolescents in the Western Cape Province of South Africa had high force of Mycobacterium tuberculosis (MTB) infection (14% per annum) and high TB incidence (710 per 100,000 person-years) in 2005. We describe subsequent temporal changes in adolescent TB disease notification rates for the decade 2005-2015.
Method: We conducted an analysis of patient-level adolescent (age 10-19 years) TB disease data, obtained from an electronic TB register in the Breede Valley sub-district, Western Cape Province, South Africa, for 2005-2015. Numerators were annual TB notifications (HIV-related and HIV-unrelated); denominators were mid-year population estimates. Period averages of TB rates were obtained using time series modeling. Temporal trends in TB rates were explored using the Mann-Kendall test.
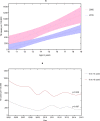
Findings: The average adolescent TB disease notification rate was 477 per 100,000 for all TB patients (all-TB) and 361 per 100,000 for microbiologically-confirmed patients. The adolescent all-TB rate declined by 45% from 662 to 361 per 100,000 and the microbiologically-confirmed TB rate by 38% from 492 to 305 per 100,000 between 2005-2015, driven mainly by rapid decreases for the period 2005-2009. There was a statistically significant negative temporal trend in both all-TB (per 100,000) (declined by 48%; from 662 to 343; p = 0·028) and microbiologically confirmed TB (per 100,000) (declined by 49%; from 492 to 252; p = 0·027) for 2005-2009, which was not observed for the period 2009-2015 (rose 5%; from 343 to 361; p = 0·764 and rose 21%; from 252 to 305; p = 1·000, respectively).
Interpretation: We observed an encouraging fall in adolescent TB disease rates between 2005-2009 with a subsequent plateau during 2010-2015, suggesting that additional interventions are needed to sustain initial advances in TB control.
Conflict of interest statement
The authors have declared that no competing interests exist.
Figures


References
-
- Nattrass N. South Africa's rollout of highly active antiretroviral therapy: a critical assessment, http://citeseerx.ist.psu.edu/viewdoc/download?doi=10.1.1.499.2171&rep=re... (Accessed 2nd July 2018). - PubMed
-
- Department of Health, SA. The South African national tuberculosis control program practical guidelines 2004, http://www.kznhealth.gov.za/chrp/documents/Guidelines/Guidelines%20Natio... (Accessed 2nd July 2018).
-
- WHO. The End TB strategy, http://www.who.int/tb/post2015_TBstrategy.pdf (Accessed 2nd July 2018).
Publication types
MeSH terms
LinkOut - more resources
Full Text Sources
Medical

