. 2020 Sep 7;219(9):e201910207.
doi: 10.1083/jcb.201910207.

Tyramide signal amplification mass spectrometry (TSA-MS) ratio identifies nuclear speckle proteins

Affiliations

Tyramide signal amplification mass spectrometry (TSA-MS) ratio identifies nuclear speckle proteins

Joseph Dopie et al. J Cell Biol. .

Abstract

We present a simple ratio method to infer protein composition within cellular structures using proximity labeling approaches but compensating for the diffusion of free radicals. We used tyramide signal amplification (TSA) and label-free mass spectrometry (MS) to compare proteins in nuclear speckles versus centromeres. Our "TSA-MS ratio" approach successfully identified known nuclear speckle proteins. For example, 96% and 67% of proteins in the top 30 and 100 sorted proteins, respectively, are known nuclear speckle proteins, including proteins that we validated here as enriched in nuclear speckles. We show that MFAP1, among the top 20 in our list, forms droplets under certain circumstances and that MFAP1 expression levels modulate the size, stability, and dynamics of nuclear speckles. Localization of MFAP1 and its binding partner, PRPF38A, in droplet-like nuclear bodies precedes formation of nuclear speckles during telophase. Our results update older proteomic studies of nuclear speckles and should provide a useful reference dataset to guide future experimental dissection of nuclear speckle structure and function.


Figures

Figure 1.
Figure 1.
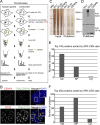
TSA-MS ratio. (A) Nuclear speckles or centromeres TSA-MS workflow. Nuclear speckles or centromeres were labeled using TSA with tyramide coupled to FITC (FITC-tyramide). FITC-labeled proteins were affinity purified and identified using tandem MS. The abundance of each protein in nuclear speckles or centromeres was estimated using LFQ, and the nuclear speckle versus centromere LFQ ratio for each protein was determined. (B) U2OS cell showing centromeres or nuclear speckles after combined immunofluorescence and TSA labeling, as indicated, and DNA (blue, DAPI) staining. Boxed areas are insets shown magnified. Scale bars: main panel, 5 µm; inset, 2 µm. (C) Silver-stained gels after TSA labeling (Input) and affinity pull-down of FITC-labeled proteins (Pulldown) from nuclear speckles or centromeres. Primary antibodies, including no primary antibody (No1), for TSA labeling are indicated at top of gel. (D) Western blot comparing SON and HP1α levels in the nuclear speckle and centromere fractions after pull-down of FITC-labeled proteins, as in C. (E and F) Numbers of the top 100 (E) and top 250 proteins (F), sorted by their nuclear speckle versus centromere (SPK-CEN) ratios, located in nuclear speckles (NS), nucleoplasm (NP), or cytosol (Cyt). See also Table S1.
Figure S1.
Figure S1.
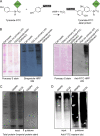
TSA labeling of proteins. (A) Chemical structure of tyramide-FITC and the labeling of proteins. (B) Western blot (WB) after TSA labeling with either tyramide-biotin or tyramide-FITC. Cell lysate without TSA reaction and a TSA reaction without primary antibody were included as controls. (C) Gel picture showing total protein staining of 0.5% of the input lysate after TSA reaction compared with 50% of the total proteins pulled down. (D) Western blot comparing FITC-labeled proteins as in C.
Figure S2.
Figure S2.
Data analysis, functional annotation, and validation of potential nuclear speckle proteins. (A) Scatter plot of the nuclear speckle versus centromere ratio (SPK-CEN ratio) of proteins. (B) Bar chart showing the GO annotated biological processes of the top 250 proteins as sorted by the SPK-CEN-Ratio. (C) Pie chart showing the GO annotated biological processes of the top 100 proteins as sorted by the SPK-CEN ratio. (D) Immunofluorescence of U2OS cells costained with anti-MFAP1 or anti-ZNF207 (green) and SC35 (red) after PFA fixation. (E) Anti-SC35 immunostaining (red) of U2OS cells expressing GFP-ZNF207 (green) and fixed with PFA shows loss of GFP-ZNF207 fluorescence after fixation. Scale bars: 10 µm.
Figure 2.
Figure 2.
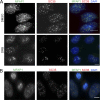
Microscopy validation of proteins with a high SPK-CEN ratio. (A) Nuclear speckle localization (SC35, red) of MFAP1 or ZNF207 (green) in U2OS after immunostaining of methanol-fixed cells (but not after formaldehyde fixation; see Fig. S2 D). DNA (DAPI), blue. (B and C) Nuclear speckle (SC35 immunostaining, red) localization of GFP-MFAP1 and GFP-PRPF38A (GFP-PR38A) after formaldehyde fixation at lower transgene expression levels (upper panel). At higher expression levels (lower panel), GFP-MFAP1 and GFP-PR38A increasingly form droplet-like bodies outside but frequently adjacent to nuclear speckles. (C) Arrowhead points to nucleus with lower GFP-PR38A expression and only nuclear speckle staining; arrow points to nucleus with high GFP-PR38A expression. Insets are magnifications of boxed areas. (D) Colocalization of tagRFP-MFAP1 (red) and GFP-PRPF38A (green) in nuclear speckles (SON immunostaining, magenta) and bodies outside of speckles in cells fixed with formaldehyde. (E) GFP-ZNF207 (green) localizes in nuclear speckles (Cherry-SON, red) in live cells (but not after formaldehyde fixation; see Fig. S2 E). Scale bars: main panel, 10 µm; inset, 2 µm.
Figure S3.
Figure S3.
MFAP1 KD specifically increases nuclear speckle size. (A) Western blots showing RNAi depletion of the indicated proteins (SRRM2, ZNF207, or PRPF38A) in U2OS cells. (B and C) Western blot showing the depletion of MFAP1 in Tig3 (B) or CHO (C) cells. Tubulin was detected as loading control. (D) Representative anti-SON immunofluorescence images of U2OS cells following siRNA treatment as indicated. (E) Representative anti-SON and anti-SC35 coimmunostaining of U2OS cells transfected with control siRNA (siCTRL) or siRNA against SRRM2 (siSRRM2). (F and G) Anti-SON immunofluorescence images of Tig3 cells (F) or CHO cells (G) after transfection with control siRNA (siCTRL) or siRNA against MFAP1 (siMFAP1). DNA (blue) was stained with DAPI. Scale bars: 10 µm.
Figure 3.
Figure 3.
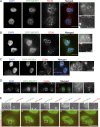
MFAP1 KD increases nuclear speckle size and changes nuclear distribution of nuclear speckle proteins after transcriptional inhibition. (A) Western blot showing (top) KD of endogenous MFAP1 protein after siRNA treatment against MFAP1 (siMFAP1) versus control siRNA (siCTRL) in U2OS cells. Tubulin (bottom) is the loading control. (B) SON immunostaining (green) in U2OS cells transfected with siCTRL or siMFAP1. DNA (DAPI) is shown in blue. Boxed areas are magnified on the right. Box plots show nuclear speckle sizes after siMFAP1 versus siCTRL (n = 80 from three independent experiments t test; ***, P < 0.0001). (C) Schematic depicting increased nuclear speckle size with MFAP1 KD followed by rounding of nuclear speckles after transcriptional inhibition but with redistribution to nucleolar periphery. (D and E) SON (green) and nucleophosmin (Nuc; red) immunostaining with DNA (DAPI, blue) counterstaining of U2OS cells transfected with siCTRL (top) or siMFAP1 (bottom) 48 h before DRB treatment for 2 h (D) or α-amanitin (α-ama) overnight treatment (E). Boxed areas in D are magnified on the right. (F) Video stills (Video 1) showing nuclear speckles after addition of DRB to inhibit transcription in MFAP1 KD (siMFAP1) U2OS cells (top of each panel, time in minutes). Arrows (top) indicate nuclear speckle accumulating around nucleolar periphery. Bottom arrows show a larger nuclear speckle merging with nucleolar periphery. Nuclear speckles were visualized with GFP-ZNF207. Scale bars: main panel, 10 µm; inset, 5 µm.
Figure 4.
Figure 4.
MFAP1 and PRPF38A segregate out of nuclear speckles and into droplet-like bodies adjacent to nuclear speckles after RNA pol II transcription inhibition. (A) Schematic depicting MFAP1/PRPF38A (green) before and after treatment with the RNA pol II transcription inhibitor DRB. (B and C) Maximum-intensity projections of optical sections of U2OS cells expressing GFP-MFAP1 (B) or GFP-PRPF38A (C, green; GFP-PR38A) treated with either DMSO (top panels) or DRB (bottom panels) for 2 h. Nuclear speckles (red, SON immunostaining) and DNA (blue, DAPI staining) are shown. Insets are magnifications of boxed areas. (D) SON immunostaining (magenta) of U2OS cells coexpressing GFP-PRPF38A (GFP-PR38A) and tagRFP-MFAP1 (RFP-MFAP1) treated with either DMSO or DRB. Boxed areas show magnified views (right panels). (E and F) Recovery of GFP-MFAP1 (E, green; Video 3) or GFP-PRPF38A (F, green; Video 4) back into nuclear speckles after release from DRB inhibition. Live cell imaging of U2OS cells coexpressing mCherry-SON after 2-h DRB treatment followed by rinsing with fresh growth media (t = 0). Times (1–45 min) are shown in the top left corner. Boxed areas are magnified (top panels) in grayscale. Scale bars: main panel, 10 µm; inset, 2 µm.
Figure S4.
Figure S4.
Nuclear speckle localization of MFAP1. (A) Immunofluorescence images of U2OS cells after SC35 and MFAP1 coimmunostaining following treatment with either DMSO or DRB for 2 h. Cells were fixed with 100% methanol. (B) Representative immunofluorescence image of a mitotic U2OS cell after SC35 and MFAP1 coimmunostaining following PFA fixation. DNA (blue) was stained with DAPI. Scale bars: 10 µm.
Figure 5.
Figure 5.
MFAP1 and PRPF38A nuclear foci appear after mitosis, before nuclear speckle reassembly. (A and B) Maximum-intensity projections of U2OS telophase daughter cells expressing GFP-MFAP1 (green) and immunostained with either anti-SC35 (A) or anti-SON (B) antibodies (red) to mark nuclear speckles. (C) Maximum-intensity projections of U2OS telophase daughter cells expressing GFP-PRPF38A (GFP-PR38A, green) and immunostained with anti-SON antibody (red). DNA (DAPI) is shown in blue (A–C). (D) Optical section showing U2OS telophase daughter cells expressing GFP-MFAP1 (green) and coimmunostained with antibodies for coilin (red) and SON (blue). Boxed areas are magnified (right panels). (E) Live-cell imaging (Video 5) of telophase U2OS cells coexpressing mCherry-SON (red) and GFP-MFAP1 (green) showing nuclear entry and formation of MFAP1 foci while SON is still present in cytoplasmic foci. Time (in minutes) after start of mitosis is shown in the top left corners. Boxed areas are magnified (top panels) in grayscale. Scale bars: main panels, 10 µm; insets, 2 µm.

References

    1. Agafonov D.E., Deckert J., Wolf E., Odenwälder P., Bessonov S., Will C.L., Urlaub H., and Lührmann R.. 2011. Semiquantitative proteomic analysis of the human spliceosome via a novel two-dimensional gel electrophoresis method. Mol. Cell. Biol. 31:2667–2682. 10.1128/MCB.05266-11 - DOI - PMC - PubMed
    1. Altmeyer M., Neelsen K.J., Teloni F., Pozdnyakova I., Pellegrino S., Grøfte M., Rask M.D., Streicher W., Jungmichel S., Nielsen M.L., et al. . 2015. Liquid demixing of intrinsically disordered proteins is seeded by poly(ADP-ribose). Nat. Commun. 6:8088 10.1038/ncomms9088 - DOI - PMC - PubMed
    1. Andersen D.S., and Tapon N.. 2008. Drosophila MFAP1 is required for pre-mRNA processing and G2/M progression. J. Biol. Chem. 283:31256–31267. 10.1074/jbc.M803512200 - DOI - PMC - PubMed
    1. Baldin V., Militello M., Thomas Y., Doucet C., Fic W., Boireau S., Jariel-Encontre I., Piechaczyk M., Bertrand E., Tazi J., et al. . 2008. A novel role for PA28γ-proteasome in nuclear speckle organization and SR protein trafficking. Mol. Biol. Cell. 19:1706–1716. 10.1091/mbc.e07-07-0637 - DOI - PMC - PubMed
    1. Bar D.Z., Atkatsh K., Tavarez U., Erdos M.R., Gruenbaum Y., and Collins F.S.. 2018. Biotinylation by antibody recognition-a method for proximity labeling. Nat. Methods. 15:127–133. 10.1038/nmeth.4533 - DOI - PMC - PubMed

Publication types