. 2020 Sep 3;27(3):441-458.e10.
doi: 10.1016/j.stem.2020.06.005. Epub 2020 Jun 30.

Histone Acetyltransferase MOF Blocks Acquisition of Quiescence in Ground-State ESCs through Activating Fatty Acid Oxidation

Affiliations

Histone Acetyltransferase MOF Blocks Acquisition of Quiescence in Ground-State ESCs through Activating Fatty Acid Oxidation

Le Tran Phuc Khoa et al. Cell Stem Cell. .

Abstract

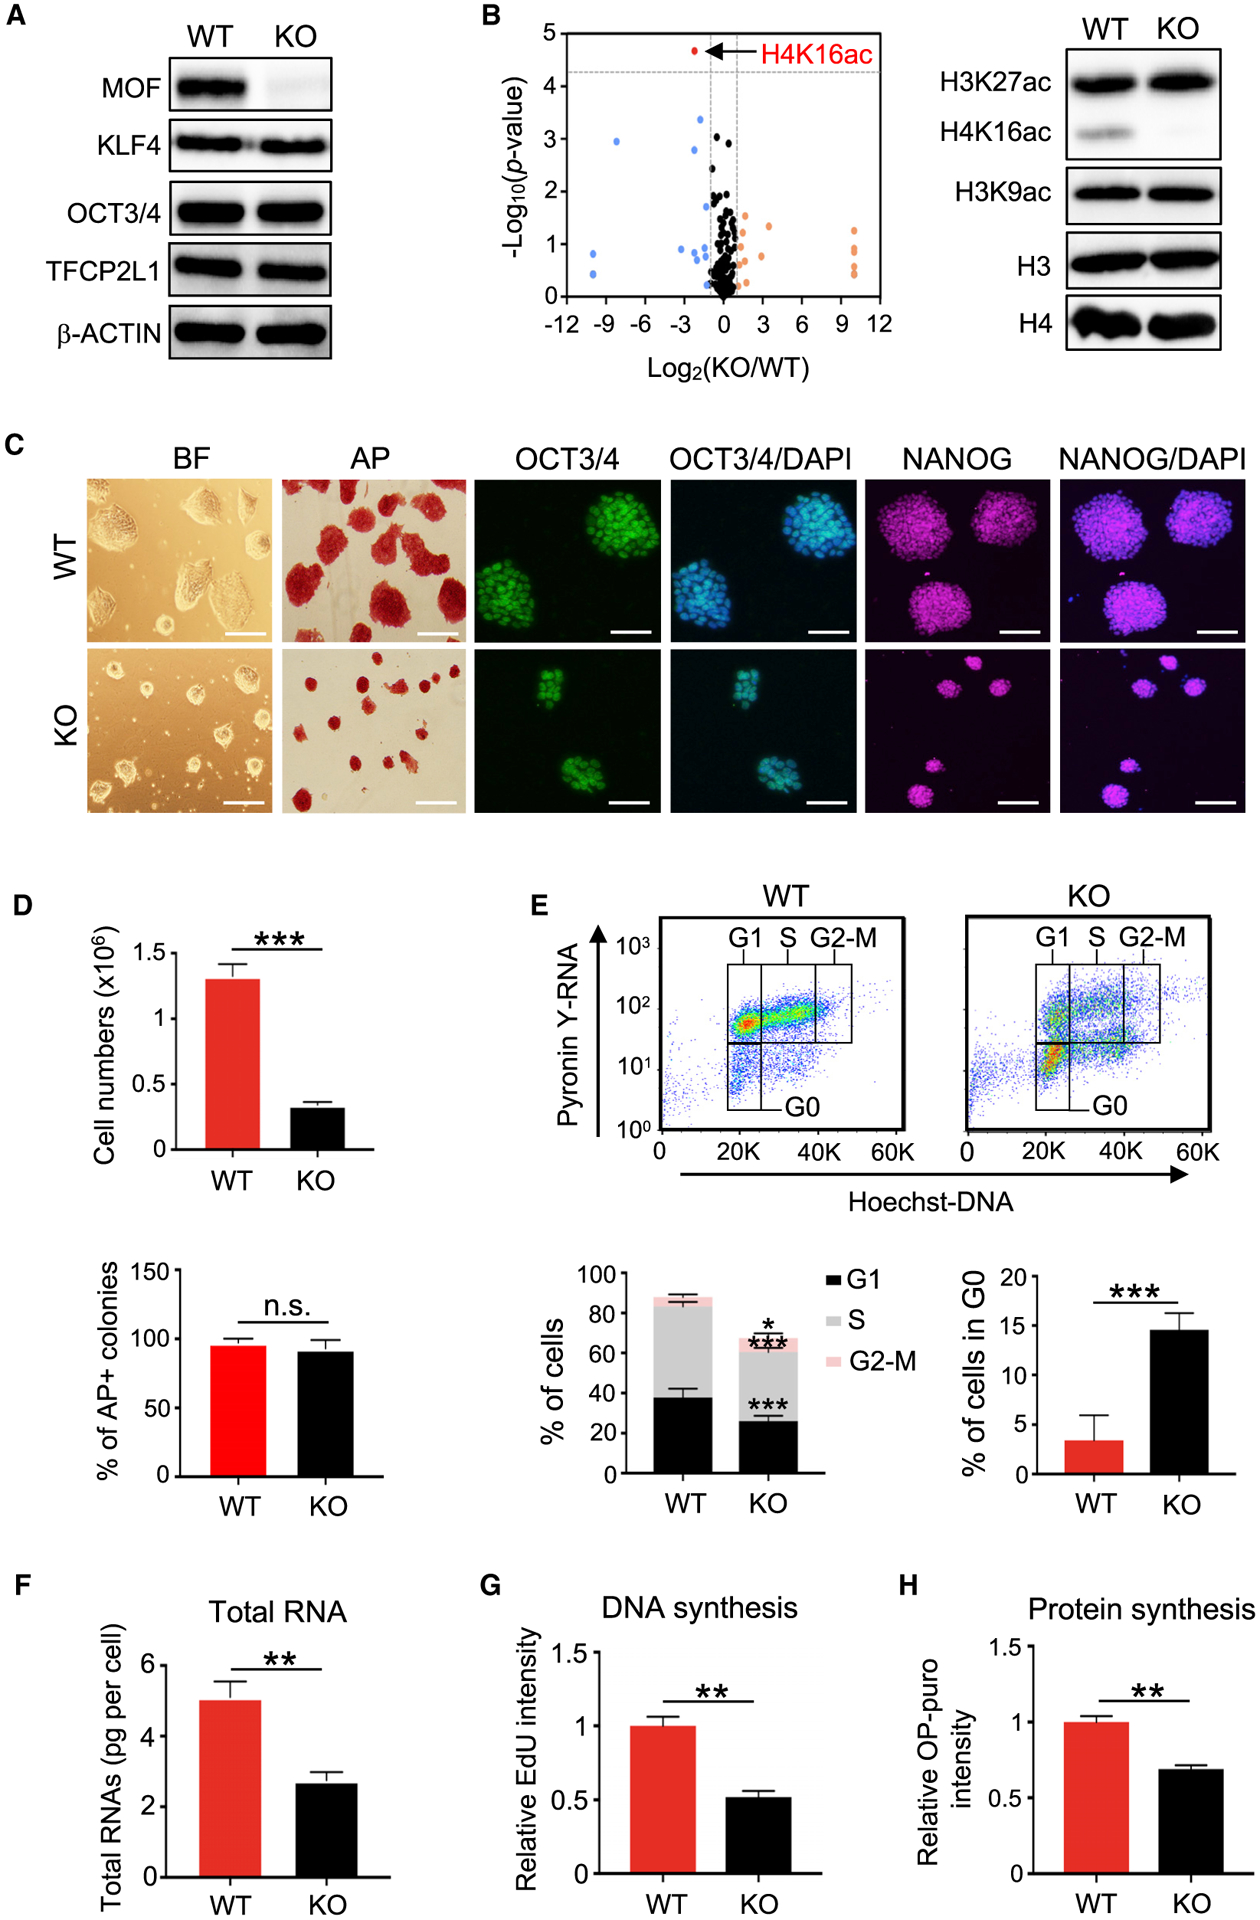
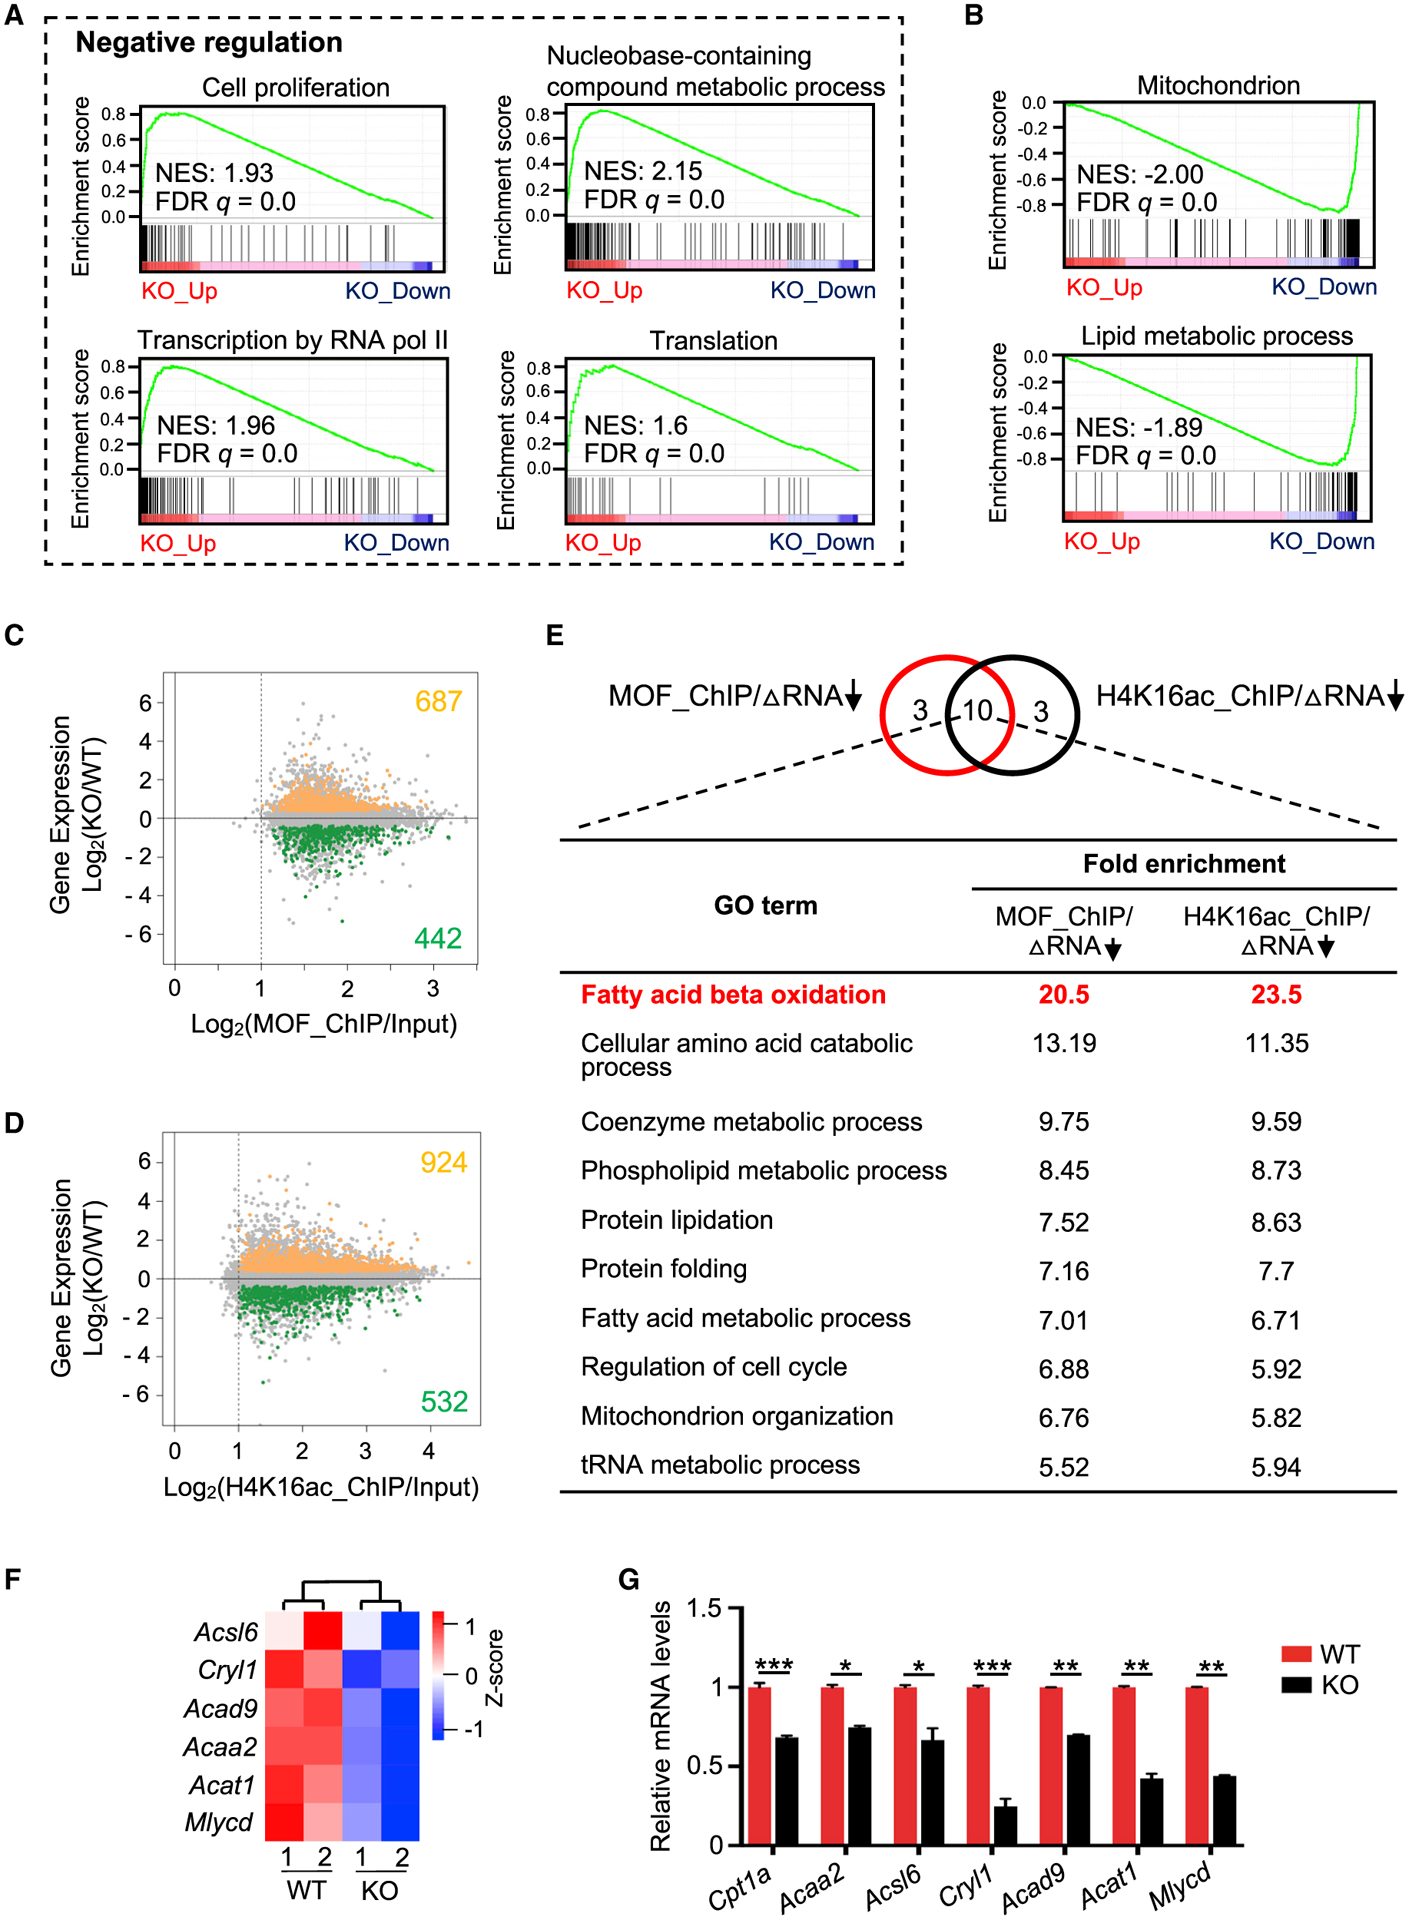
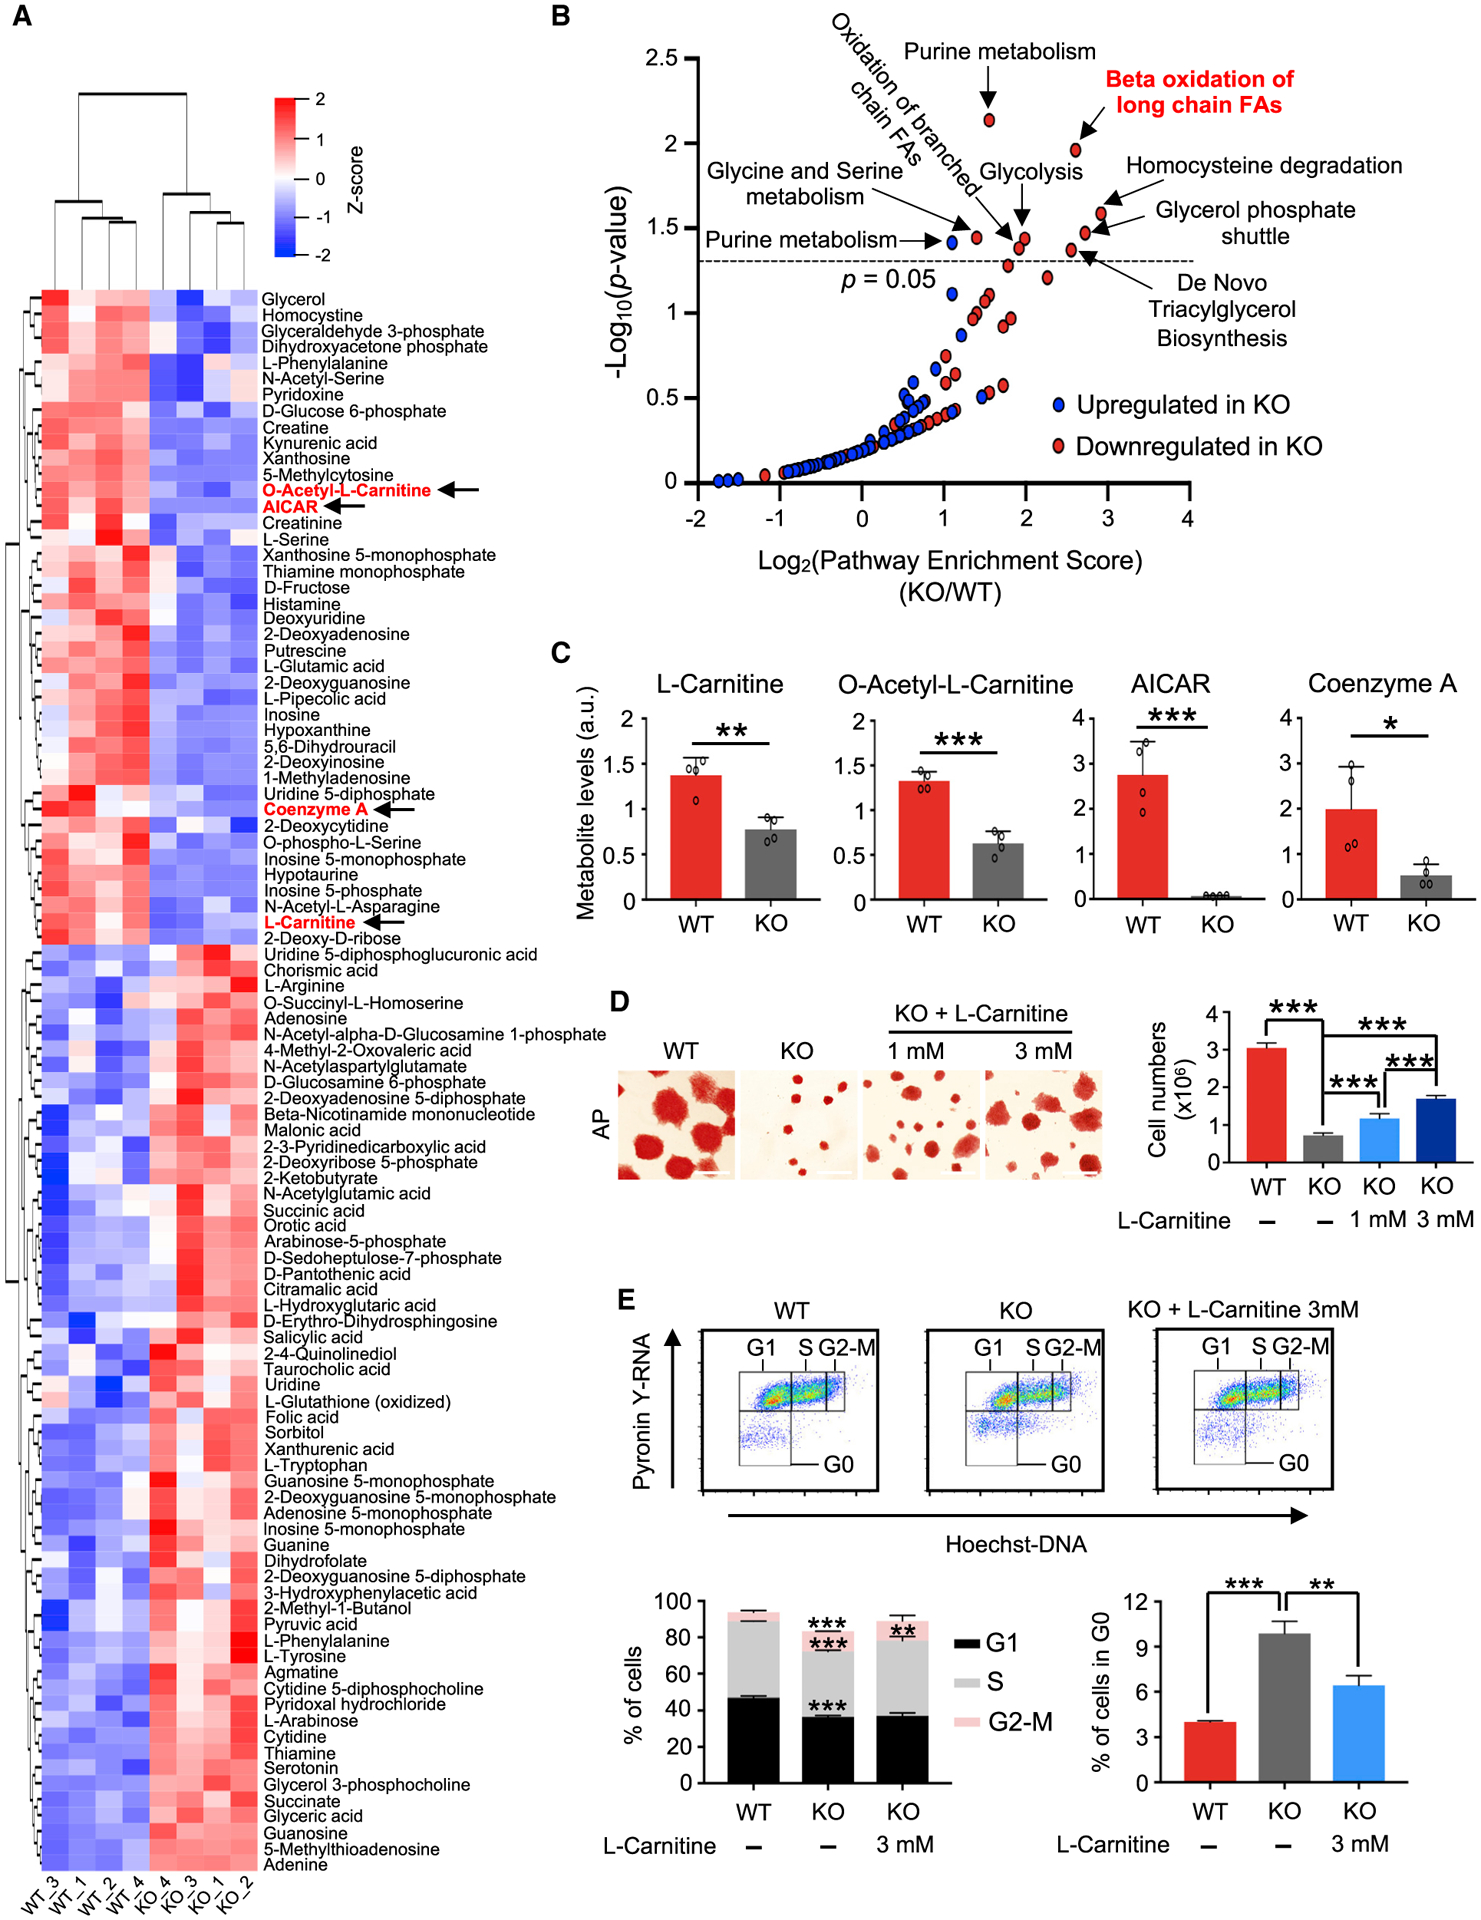
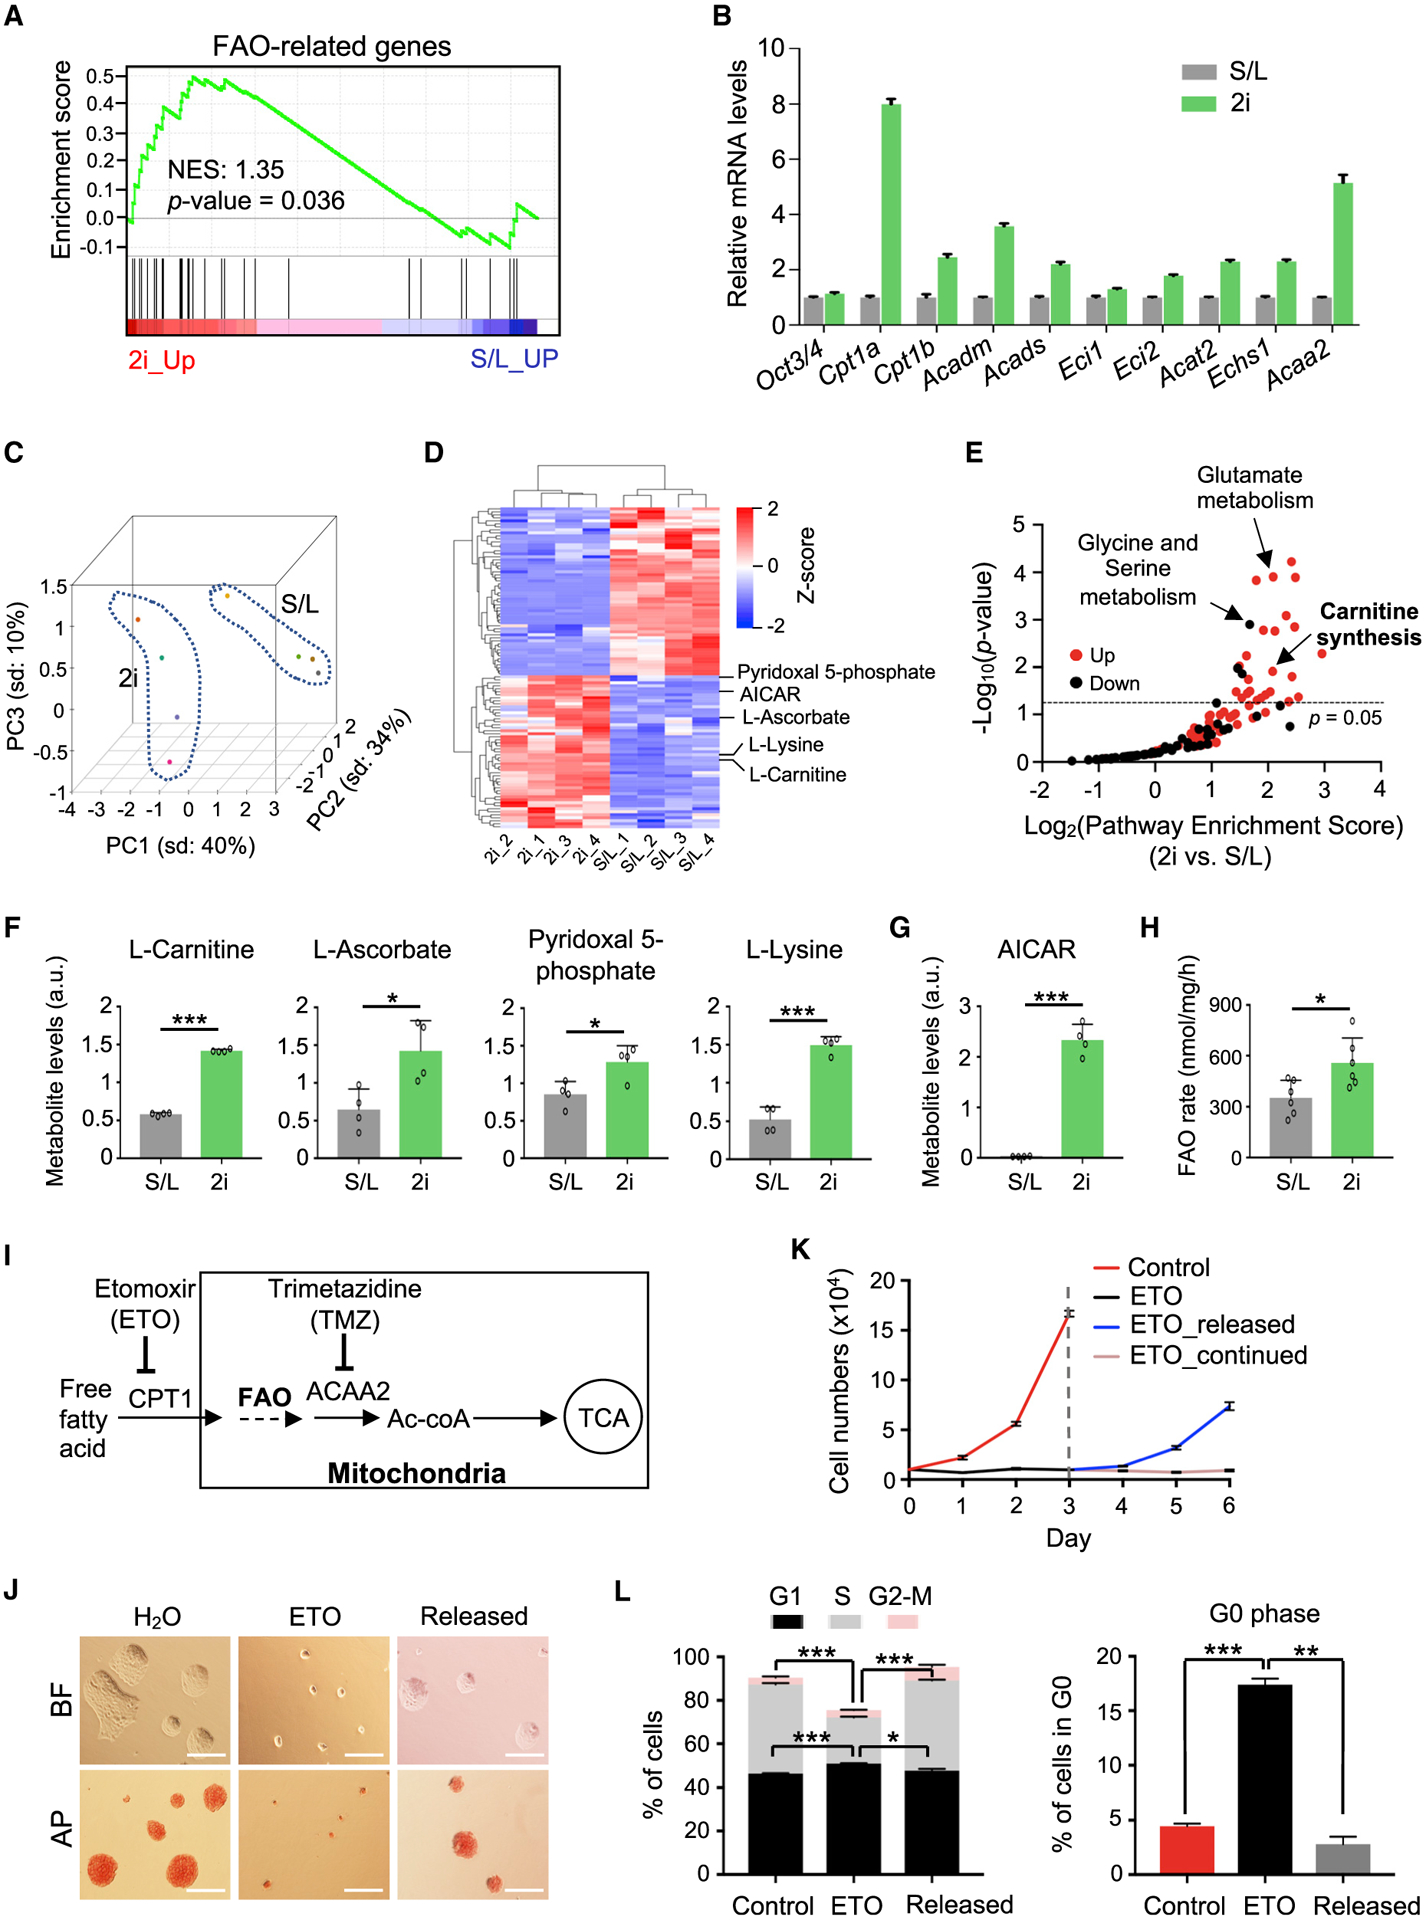
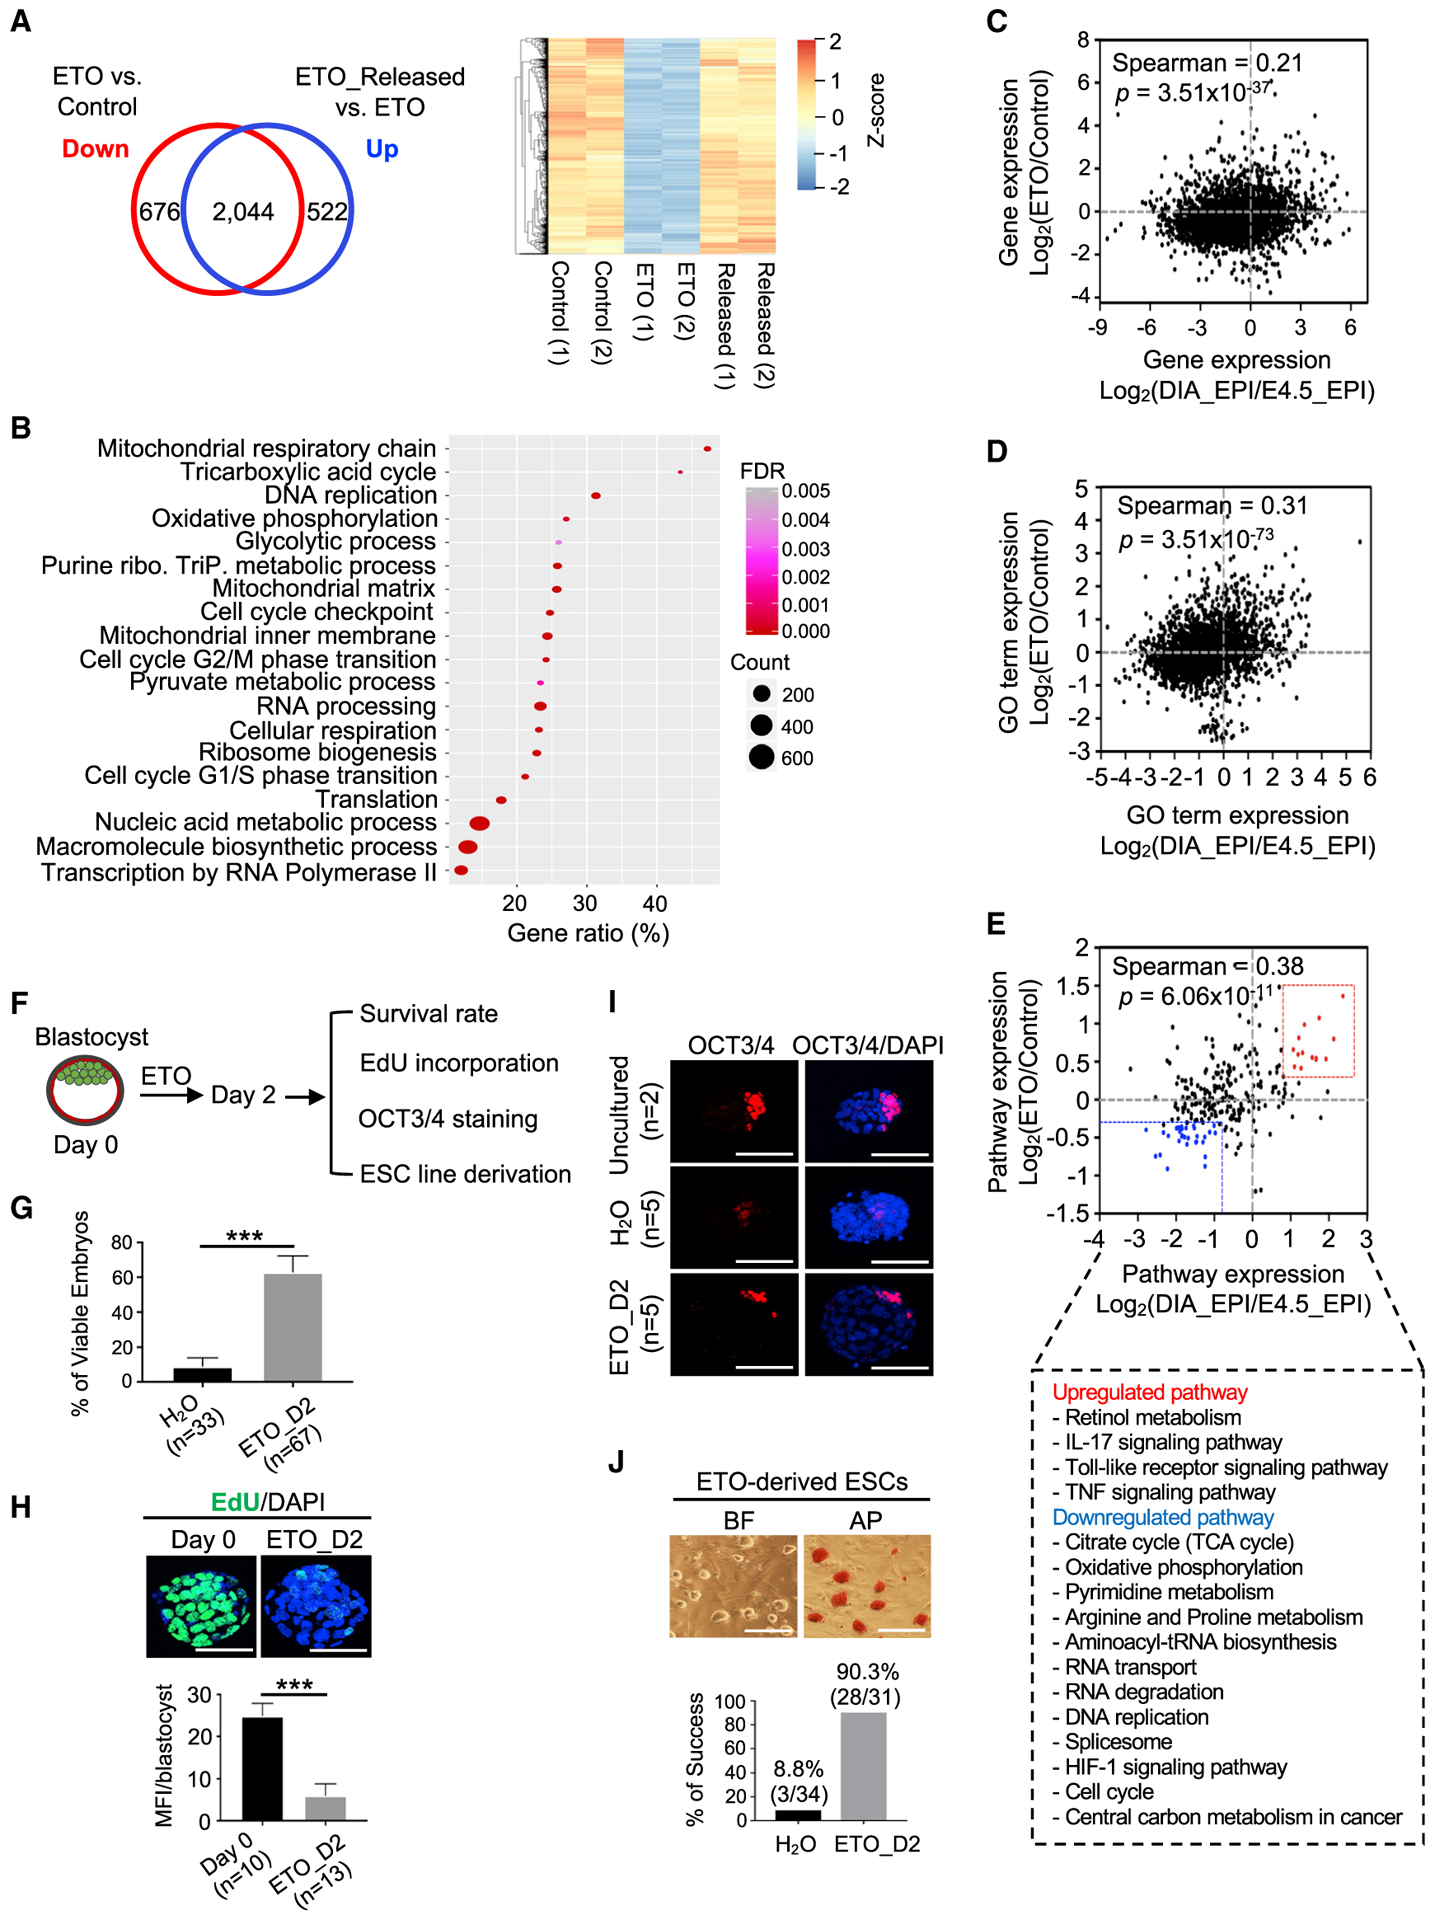
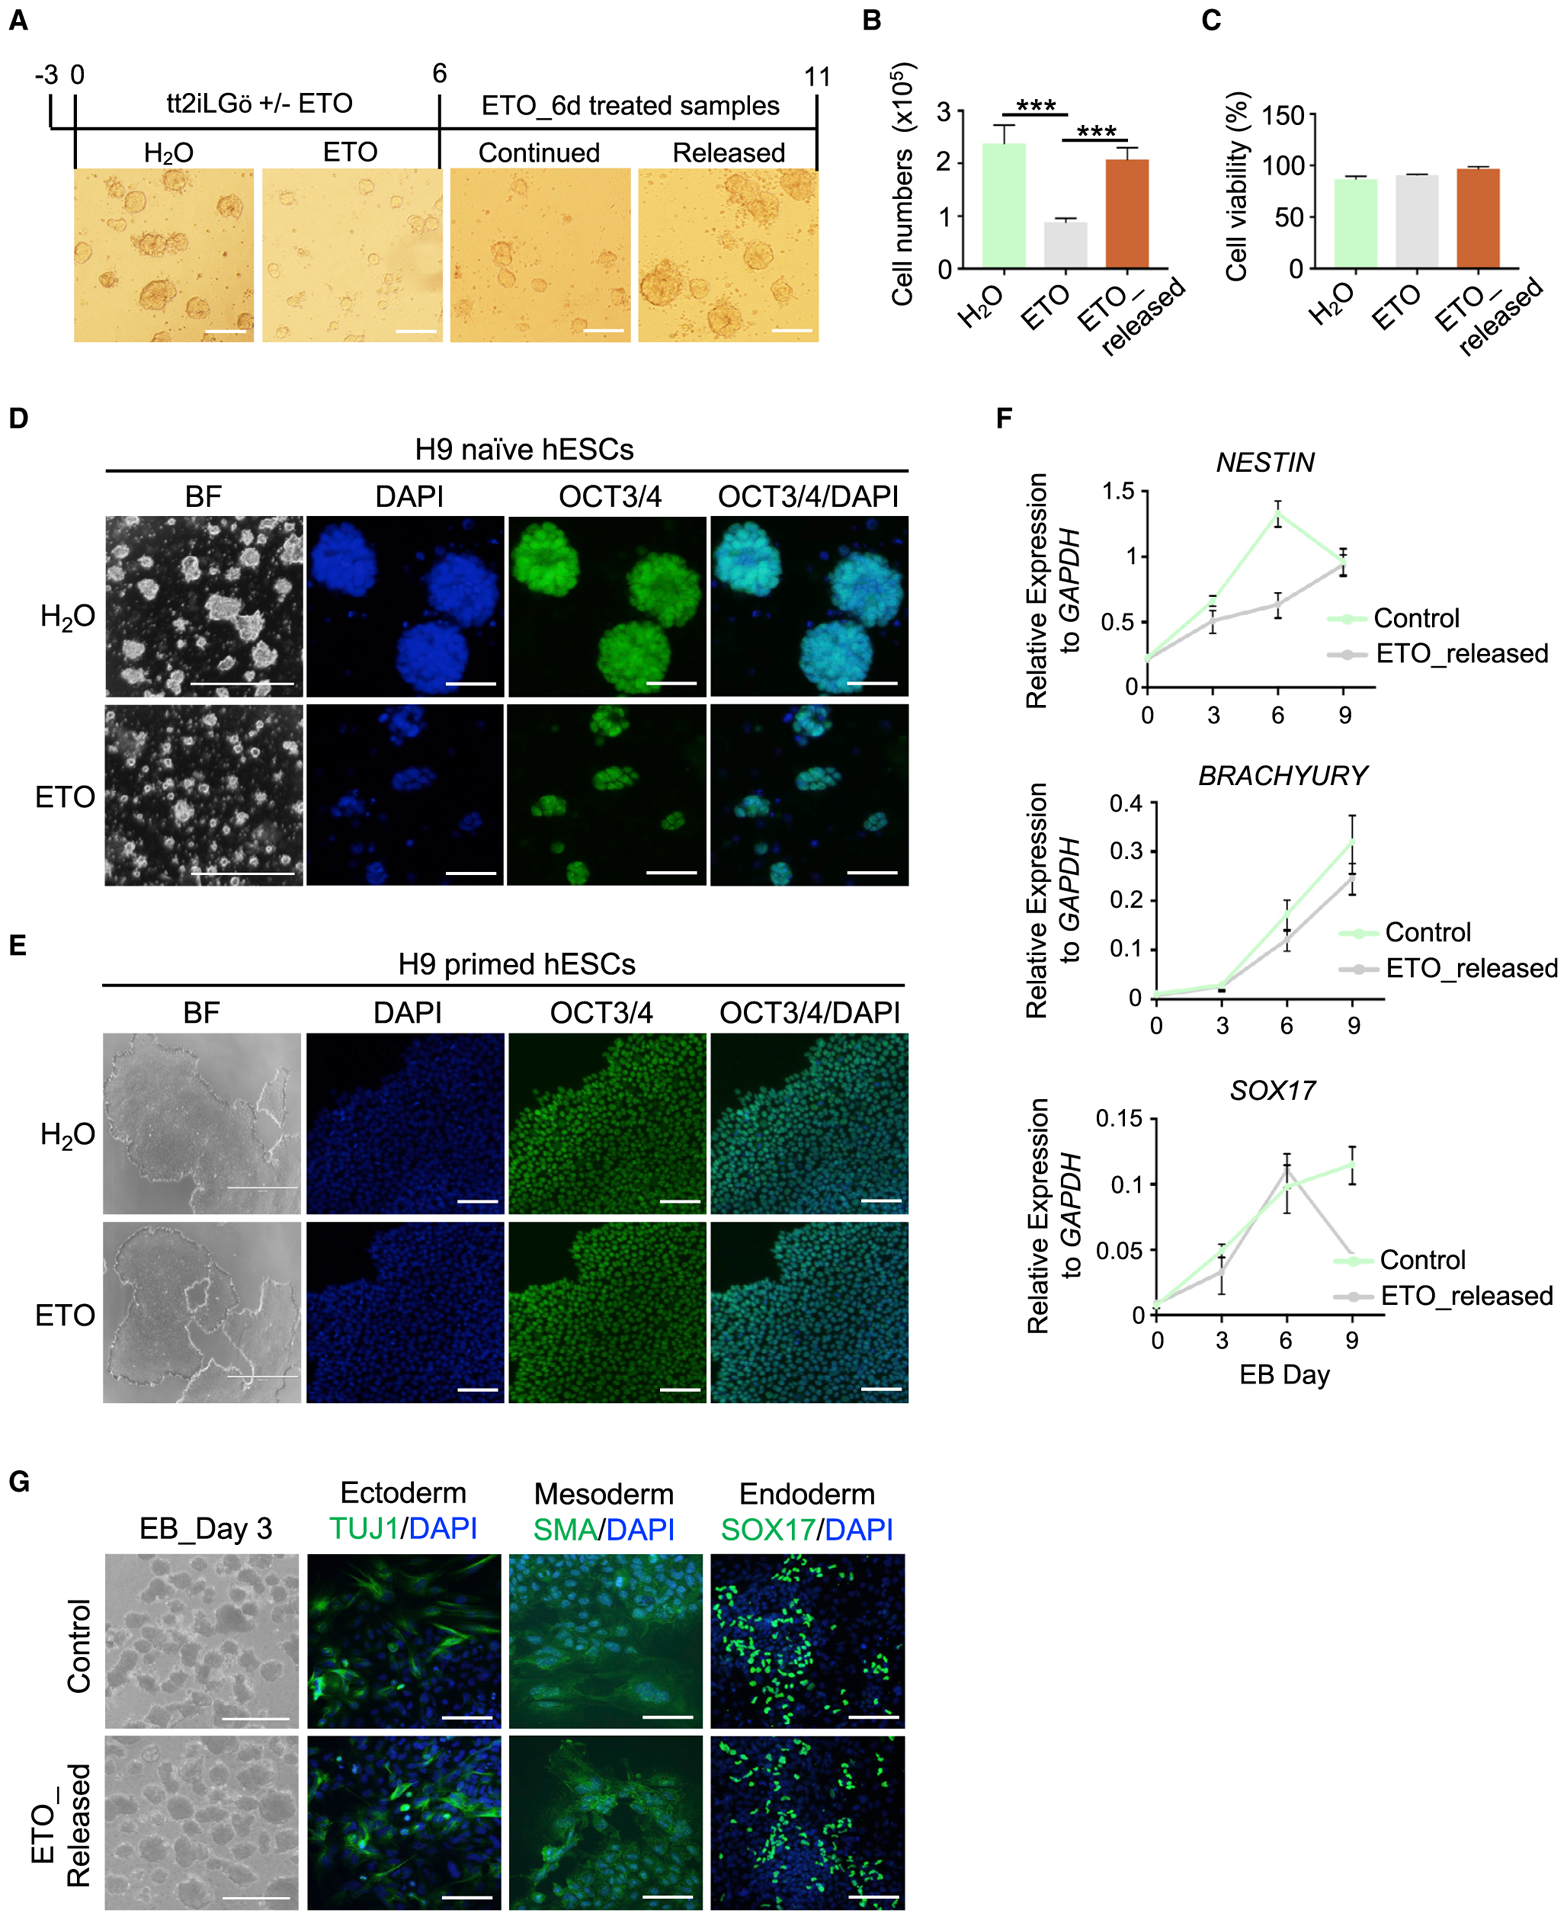
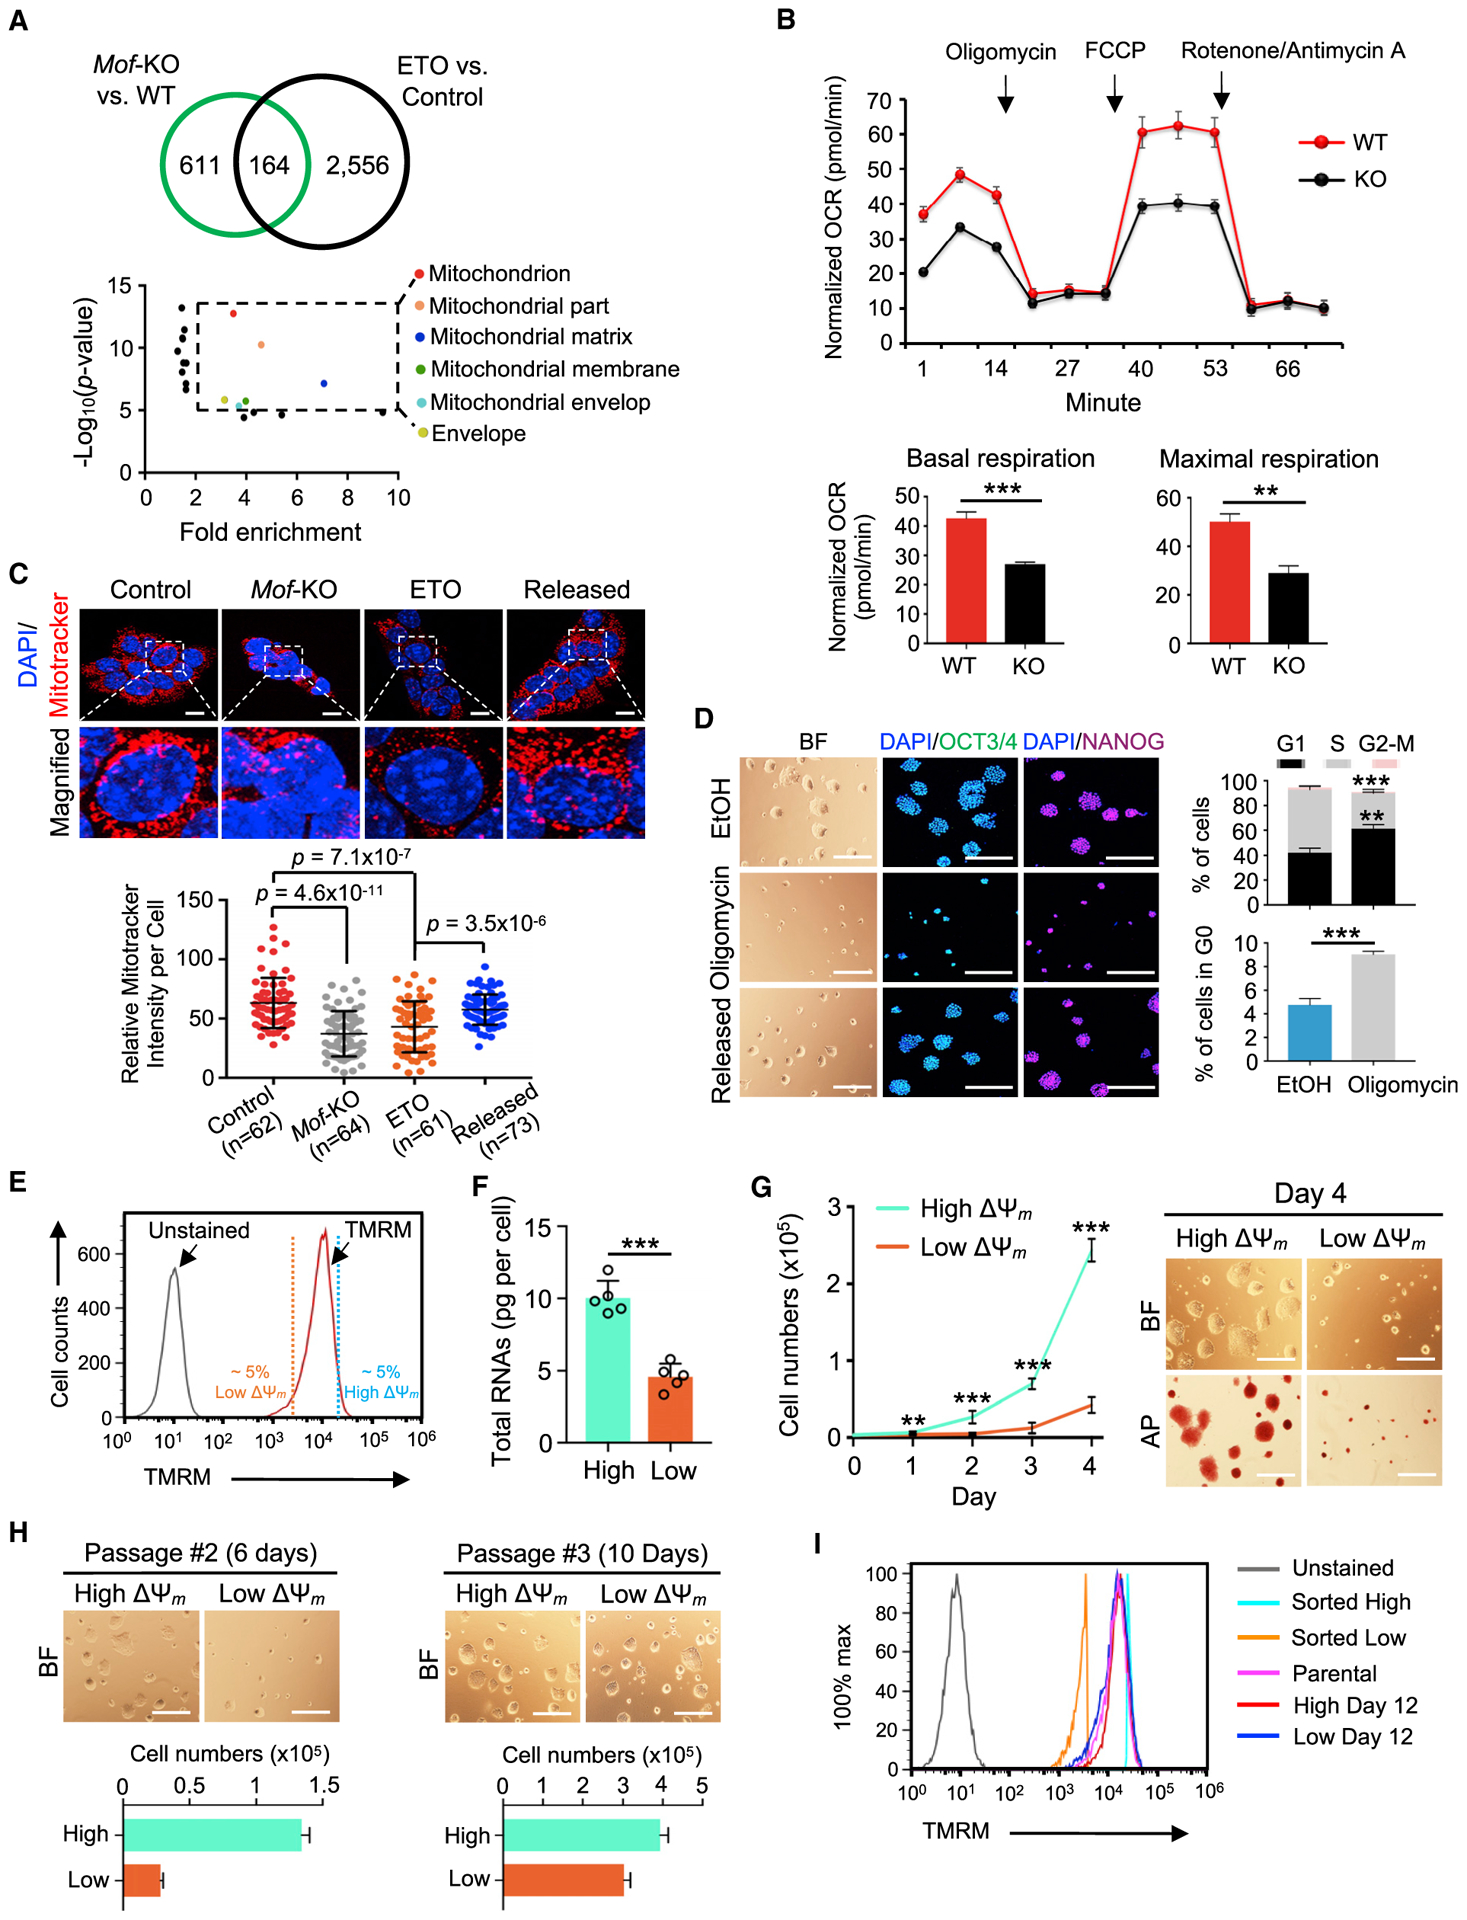
Self-renewing embryonic stem cells (ESCs) respond to environmental cues by exiting pluripotency or entering a quiescent state. The molecular basis underlying this fate choice remains unclear. Here, we show that histone acetyltransferase MOF plays a critical role in this process through directly activating fatty acid oxidation (FAO) in the ground-state ESCs. We further show that the ground-state ESCs particularly rely on elevated FAO for oxidative phosphorylation (OXPHOS) and energy production. Mof deletion or FAO inhibition induces bona fide quiescent ground-state ESCs with an intact core pluripotency network and transcriptome signatures akin to the diapaused epiblasts in vivo. Mechanistically, MOF/FAO inhibition acts through reducing mitochondrial respiration (i.e., OXPHOS), which in turn triggers reversible pluripotent quiescence specifically in the ground-state ESCs. The inhibition of FAO/OXPHOS also induces quiescence in naive human ESCs. Our study suggests a general function of the MOF/FAO/OXPHOS axis in regulating cell fate determination in stem cells.

Keywords: FAO; MOF; cell fate decision; embryo development; epigenetics; quiescence; self-renewal; stem cell metabolism.


Conflict of interest statement

Declaration of Interests The authors declare no competing interests

Figures

Figure 1.
Figure 1.. Deletion of Mof Induces a Pluripotent Quiescence in Ground-State ESCs
(A) Western blot analysis in wild-type (WT) and Mof null 2i ESCs. β-Actin was included as a loading control. (B) Left, volcano plot of mass spectrometry for 231 histone PTMs and unmodified peptides ranked by log2 fold change (KO/WT) (x axis) and the (−) log10 p value (y axis). Right, western blot validation of selected histone PTMs. (C) Representative images of bright-field (BF), alkaline phosphatase (AP) staining, or immunofluorescence (IF) of OCT3/4 and NANOG for WT and Mof null 2i ESCs. Nuclei were co-stained with DAPI. Scale bar, 100 μm. (D) Qualifications of cell numbers (top) and AP-positive colonies (bottom) from (C). Cells were plated at the same numbers and scored after 4 days. Data are shown as means ± SEMs from six biological replicates. (E) Cell-cycle analysis. FACS plots (top) and quantifications (bottom) of six biological replicates are shown as means ± SEMs. (F) Total RNA amounts per cell for WT and Mof null 2i ESCs. Data are presented as means ± SEMs from three independent experiments. (G) Measurement of DNA synthesis. Quantifications of three biological replicates are shown as means ± SEMs. (H) Measurement of new protein synthesis. Data are presented as means ± SEMs from three biological replicates. For (D)-(H), *p < 0.05, **p < 0.01, ***p < 0.001; n.s., not significant. See also Figure S1 and Table S1.
Figure 2.
Figure 2.. MOF Directly Activates the FAO Pathway in Ground-State ESCs
(A and B) GSEA plots for upregulated (A) and downregulated (B) genes in Mof null 2i ESCs. NES, normalized enrichment score. (C and D) Intersection of RNA-seq (y axis) with ChIP-seq datasets (x axis) for MOF (C) and H4K16ac (D). See also Method Details. (E) Top, Venn diagram for top 13 overrepresented GO terms for MOF or H4K16ac direct targets that were downregulated upon Mof deletion. Ten common metabolic pathways are shown at bottom. (F) Heatmap (Z score) for the expression levels of FAO-related genes in WT and Mof null 2i ESCs. Heatmap key is shown at right. (G) qRT-PCR validation for FAO-related genes. Relative expression from two biological replicates was normalized against the expression levels in WT ESCs, which was arbitrarily set as 1, and presented as means ± SEMs. *p < 0.05, **p < 0.01, ***p < 0.001. See also Figure S2 and Tables S2 and S3.
Figure 3.
Figure 3.. Mof Deletion Significantly Alters the Metabolic State in Ground-State ESCs
(A) Heatmap for metabolites that were significantly changed in Mof null 2i ESCs (p < 0.05). Z score values range from −2 to 2. FAO-related metabolites were highlighted in red and noted with arrows. (B) Pathway analysis for metabolites that were changed in Mof null 2i ESCs. p < 0.05 serves as the cutoff for significantly enriched pathways. FAs, fatty acids. (C) Levels of selected FAO metabolites. Data are shown as means ± SEMs, n = 4 biological replicates. a.u., arbitrary unit. (D) l-Carnitine supplementation rescues proliferation defects in Mof null 2i ESCs. Left, AP staining of WT; KO and KO cells cultured with l-carnitine at a final concentration of 1 or 3 mM. Scale bar, 100 μm. Right, cell proliferation is shown as means ± SEMs, n = 4 biological replicates. (E) Cell-cycle analysis. FACS plots (top) and quantifications (bottom) of three biological replicates are shown as mean ± SEM. For (C)-(E), *p < 0.05, **p < 0.01, ***p < 0.001. See also Figure S2 and Table S4.
Figure 4.
Figure 4.. Inhibition of FAO Induces a Reversible Pluripotent Quiescence in Ground-State ESCs
(A) GSEA for FAO genes in S/L versus 2i ESCs. RNA-seq data are from Marks et al. (2012). (B) qRT-PCR validation for representative FAO genes. Relative expression from 3 technical replicates was normalized against the expression levels in S/L ESCs, which was arbitrarily set as 1. Data are presented as means ± SEMs. (C) PCA plot for metabolites in S/L and 2i ESCs. Dashed lines indicate a clear separation of metabolome profiles in S/L and 2i ESCs. Colored dots indicate biological replicates. (D) Heatmap (Z score) for significantly upregulated and downregulated metabolites in S/L and 2i ESCs. Metabolites associated with carnitine synthesis are highlighted at right. (E) Pathway enrichment analysis for significantly up- and downregulated metabolites in 2i ESCs as shown in (D). p < 0.05 serves as the cutoff for significantly enriched pathways. (F and G) Levels of metabolites associated with carnitine synthesis (F) and FAO (G). Data are presented as means ± SEMs, n = 4 biological replicates. (H) Rate of FAO using [3H]-labeled palmitate. Data from two independent experiments are shown as means ± SEMs. (I) Schematic overview of ETO and TMZ targets in the FAO pathway. (J) Representative images of BF and AP staining for Oct4-GiP 2i ESCs with or without ETO treatment and after ETO release. Scale bar, 100 μm. (K) Growth curves of 2i ESCs under indicated conditions. Data are presented as means ± SEMs of quadruplicate wells from a representative experiment. (L) Quantifications of cell-cycle analysis. Data from two independent experiments are shown as means ± SEMs. For (F)-(H) and (L), *p < 0.05, **p < 0.01, ***p < 0.001. See also Figures S3 and S4 and Table S4.
Figure 5.
Figure 5.. Inhibition of FAO Promotes a Blastocyst Pausing Ex Vivo
(A) Left, Venn diagram comparing ETO-downregulated genes and upregulated genes upon ETO release (FDR < 0.05). Right, heatmap (Z score) for 2,044 overlapping genes. (B) GO term analysis for 2,044 genes identified in (A). (C-E) Scatterplots for the correlation of gene expression (C), the GO term (D), and pathway expression (E) between the ETO-induced quiescent state (y axis) and diapaused epiblast (x axis). Selected pathways are shown at bottom (E). (F) Experimental scheme for testing ETO in stimulating a reversible blastocyst pausing ex vivo. (G) Survival rate of blastocysts cultured in the presence of H2O or ETO. Data are presented as means ± SEMs. n, number of blastocysts. ***p < 0.001. D2, day 2. (H) Top, confocal images of EdU incorporation (green). Nuclei were co-stained with DAPI. Scale bar, 20 μm. Bottom, quantifications of EdU incorporation. Data are presented as means ± SEMs. n, number of blastocysts; MFI, mean fluorescence intensity. ***p < 0.001. (I) Confocal images of OCT3/4 IF for E3.5 blastocysts, H2O control, and ETO-treated blastocysts. Nuclei were co-stained with DAPI. Scale bar, 20 μm. n, number of blastocysts. (J) Derivation of ESC lines from H2O control and ETO-treated blastocysts. Top, BF and AP staining from 1 representative ESC line derived from an ETO-treated blastocyst. Scale bar, 50 μm. Bottom, quantifications for the efficiency of ESC derivation. Percentage of success was calculated by the number of successfully derived ESC lines from total blastocysts. See also Figure S5 and Table S5.
Figure 6.
Figure 6.. Inhibition of FAO Induces Reversible Pluripotent Quiescence in Naive Human ESCs
(A) BF images of naive hESCs after ETO treatment. Treatment time is shown at top. Scale bar, 100 μm. (B) Qualifications of cell numbers at day 6 of ETO treatment and 5 days after ETO release. Data are presented as mean ± SEMs, n = 4 biological replicates. ***p < 0.001. (C) Percentage of cell viability. Data are shown as means ± SEMs, n = 4 biological replicates. (D and E) Representative images of BF and IF of OCT3/4 for naive (D) and primed (E) hESCs cultured with or without ETO. Nuclei were co-stained with DAPI. Scale bar, 2,000 μm for BF and 50 μm for IF in (D); 1,000 μm for BF and 100 μm for IF in (E). (F) qRT-PCR analysis for representative genes of 3-germ layer differentiation from control and ETO-released naive hESCs. Data are presented as means ± SEMs, n = 3 biological replicates. EB, embryoid body. (G) EB differentiation in control and ETO-released naive hESCs. Representative images of BF for EB and IF for 3-germ layer markers in EB outgrowth. Scale bar, 1,000 μm for BF and 50 μm for IF. See also Figure S6.
Figure 7.
Figure 7.. Mof Deletion and FAOi Converge on Reduced Mitochondrial Respiration
(A) Top, Venn diagram showing 164 genes commonly downregulated in Mof KO and ETO-treated 2i ESCs. Bottom, GO terms for 164 genes. Dashed box denotes GO terms with significant enrichment (fold enrichment > 2). (B) Top, oxygen consumption rate (OCR) for WT and Mof-KO 2i ESCs. Arrows indicate MitoStress conditions. Bottom, quantifications of basal and maximal OCR. Data are presented as means ± SEMs, n = 4 biological replicates. (C) Top, MitoTracker staining (red) at indicated conditions. Nuclei were co-stained with DAPI. Scale bar, 10 μm. Representative confocal images from three independent experiments. Bottom, quantifications of MitoTracker intensity in each cell by ImageJ. (D) Left, BF and IF confocal images of OCT3/4 and NANOG for EtOH control, Oligomycin-treated and released 2i ESCs. Nuclei were co-stained with DAPI. Scale bar, 100 μm for BF and 50 μm for IF. Right, quantifications of cell-cycle analysis. Data are presented as means ± SEMs, n = 3 biological replicates. (E) FACS plots showing mitochondrial labeling with TMRM (ΔΨm). (F) Total RNA amounts per cell for high and low ΔΨm 2i ESCs. Data are shown as means ± SEMs from five independent experiments. (G) Left, growth curves of high and low ΔΨm 2i ESCs. Data are presented as means ± SEMs, n = 6 biological replicates. Right, representative images of BF and AP staining for high and low ΔΨm cells at day 4. Scale bar, 100 μm. (H) Representative images of BF (top) and qualifications of cell numbers (bottom) at passages #2 (left) and #3 (right) of high and low ΔΨm cells. Data are shown as means ± SEMs, n = 3 technical replicates. Scale bar, 100 μm. (I) FACS plots showing TMRM profiles for parental, sorted high, and low ΔΨm 2i ESCs at days 0 and 12. For (B), (D), (F), and (G), **p < 0.01, ***p < 0.001. p values are calculated by the unpaired two-tailed Student’s t-test. Data are presented as mean ± SEMs. n, number of cells. See also Figure S7 and Table S6.

Similar articles

Cited by

References

    1. Amemiya HM, Kundaje A, and Boyle AP (2019). The ENCODE Blacklist: Identification of Problematic Regions of the Genome. Sci. Rep 9, 9354. - PMC - PubMed
    1. Atlasi Y, Megchelenbrink W, Peng T, Habibi E, Joshi O, Wang SY, Wang C, Logie C, Poser I, Marks H, and Stunnenberg HG (2019). Epigenetic modulation of a hardwired 3D chromatin landscape in two naive states of pluripotency. Nat. Cell Biol 21, 568–578. - PubMed
    1. Barbehenn EK, Wales RG, and Lowry OH (1978). Measurement of metabolites in single preimplantation embryos; a new means to study metabolic control in early embryos. J. Embryol. Exp. Morphol 43, 29–46. - PubMed
    1. Bindea G, Mlecnik B, Hackl H, Charoentong P, Tosolini M, Kirilovsky A, Fridman WH, Pagès F, Trajanoski Z, and Galon J (2009). ClueGO: a Cytoscape plug-in to decipher functionally grouped gene ontology and pathway annotation networks. Bioinformatics 25, 1091–1093. - PMC - PubMed
    1. Boroviak T, Loos R, Bertone P, Smith A, and Nichols J (2014). The ability of inner-cell-mass cells to self-renew as embryonic stem cells is acquired following epiblast specification. Nat. Cell Biol 16, 516–528. - PMC - PubMed

Publication types