. 2020 Sep 17;27(9):1207-1219.e9.
doi: 10.1016/j.chembiol.2020.06.007. Epub 2020 Jun 30.

Parallel Glyco-SPOT Synthesis of Glycopeptide Libraries

Affiliations

Parallel Glyco-SPOT Synthesis of Glycopeptide Libraries

Akul Y Mehta et al. Cell Chem Biol. .

Abstract

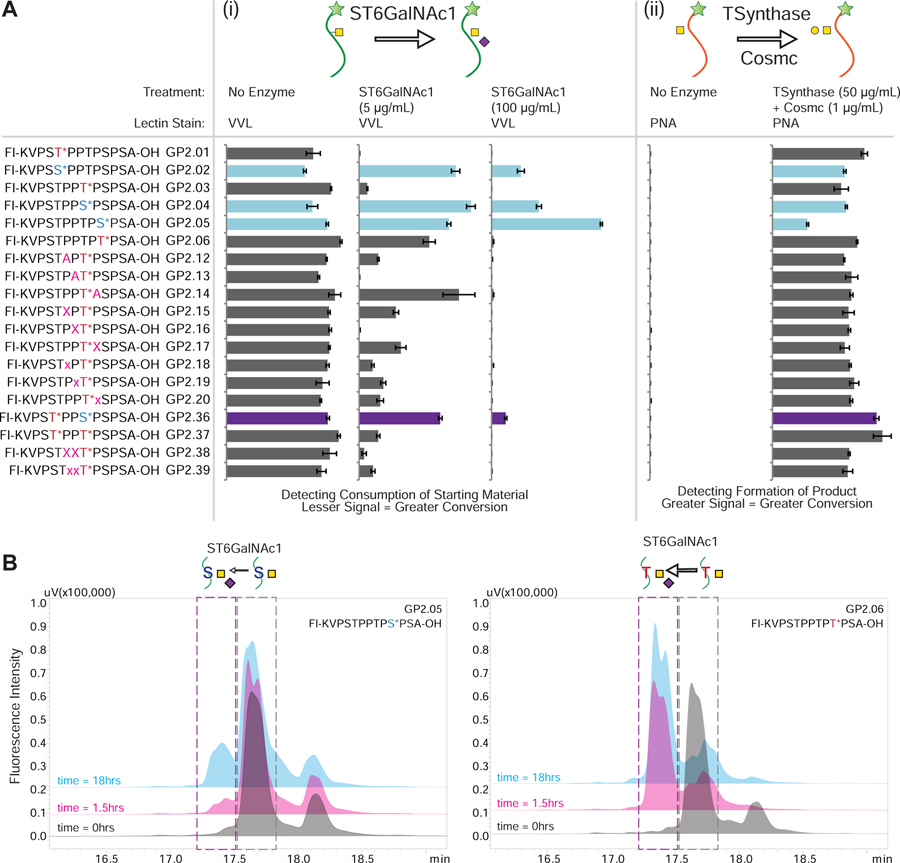
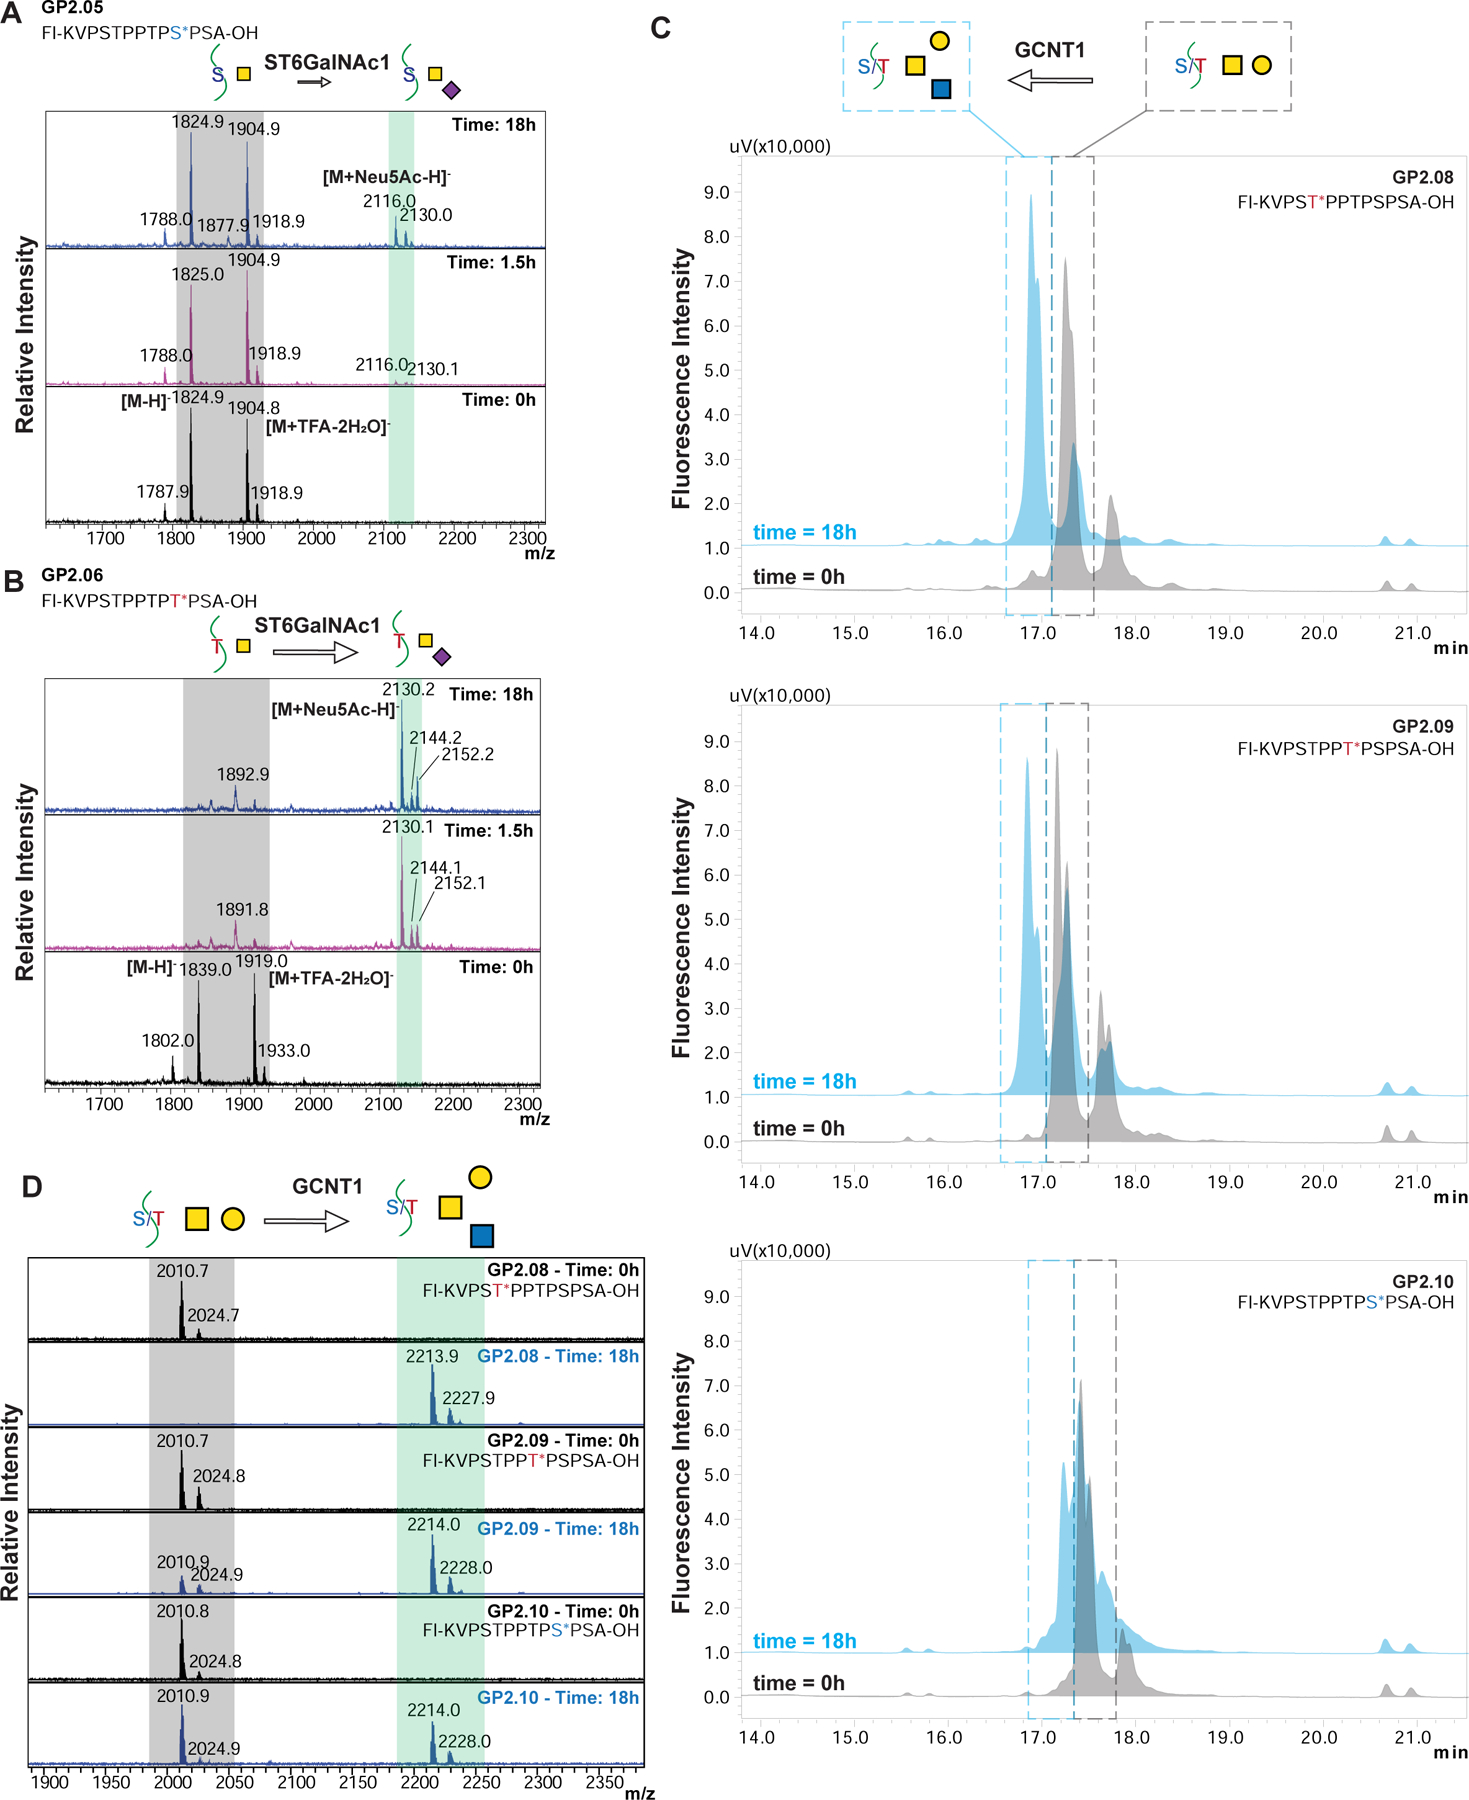
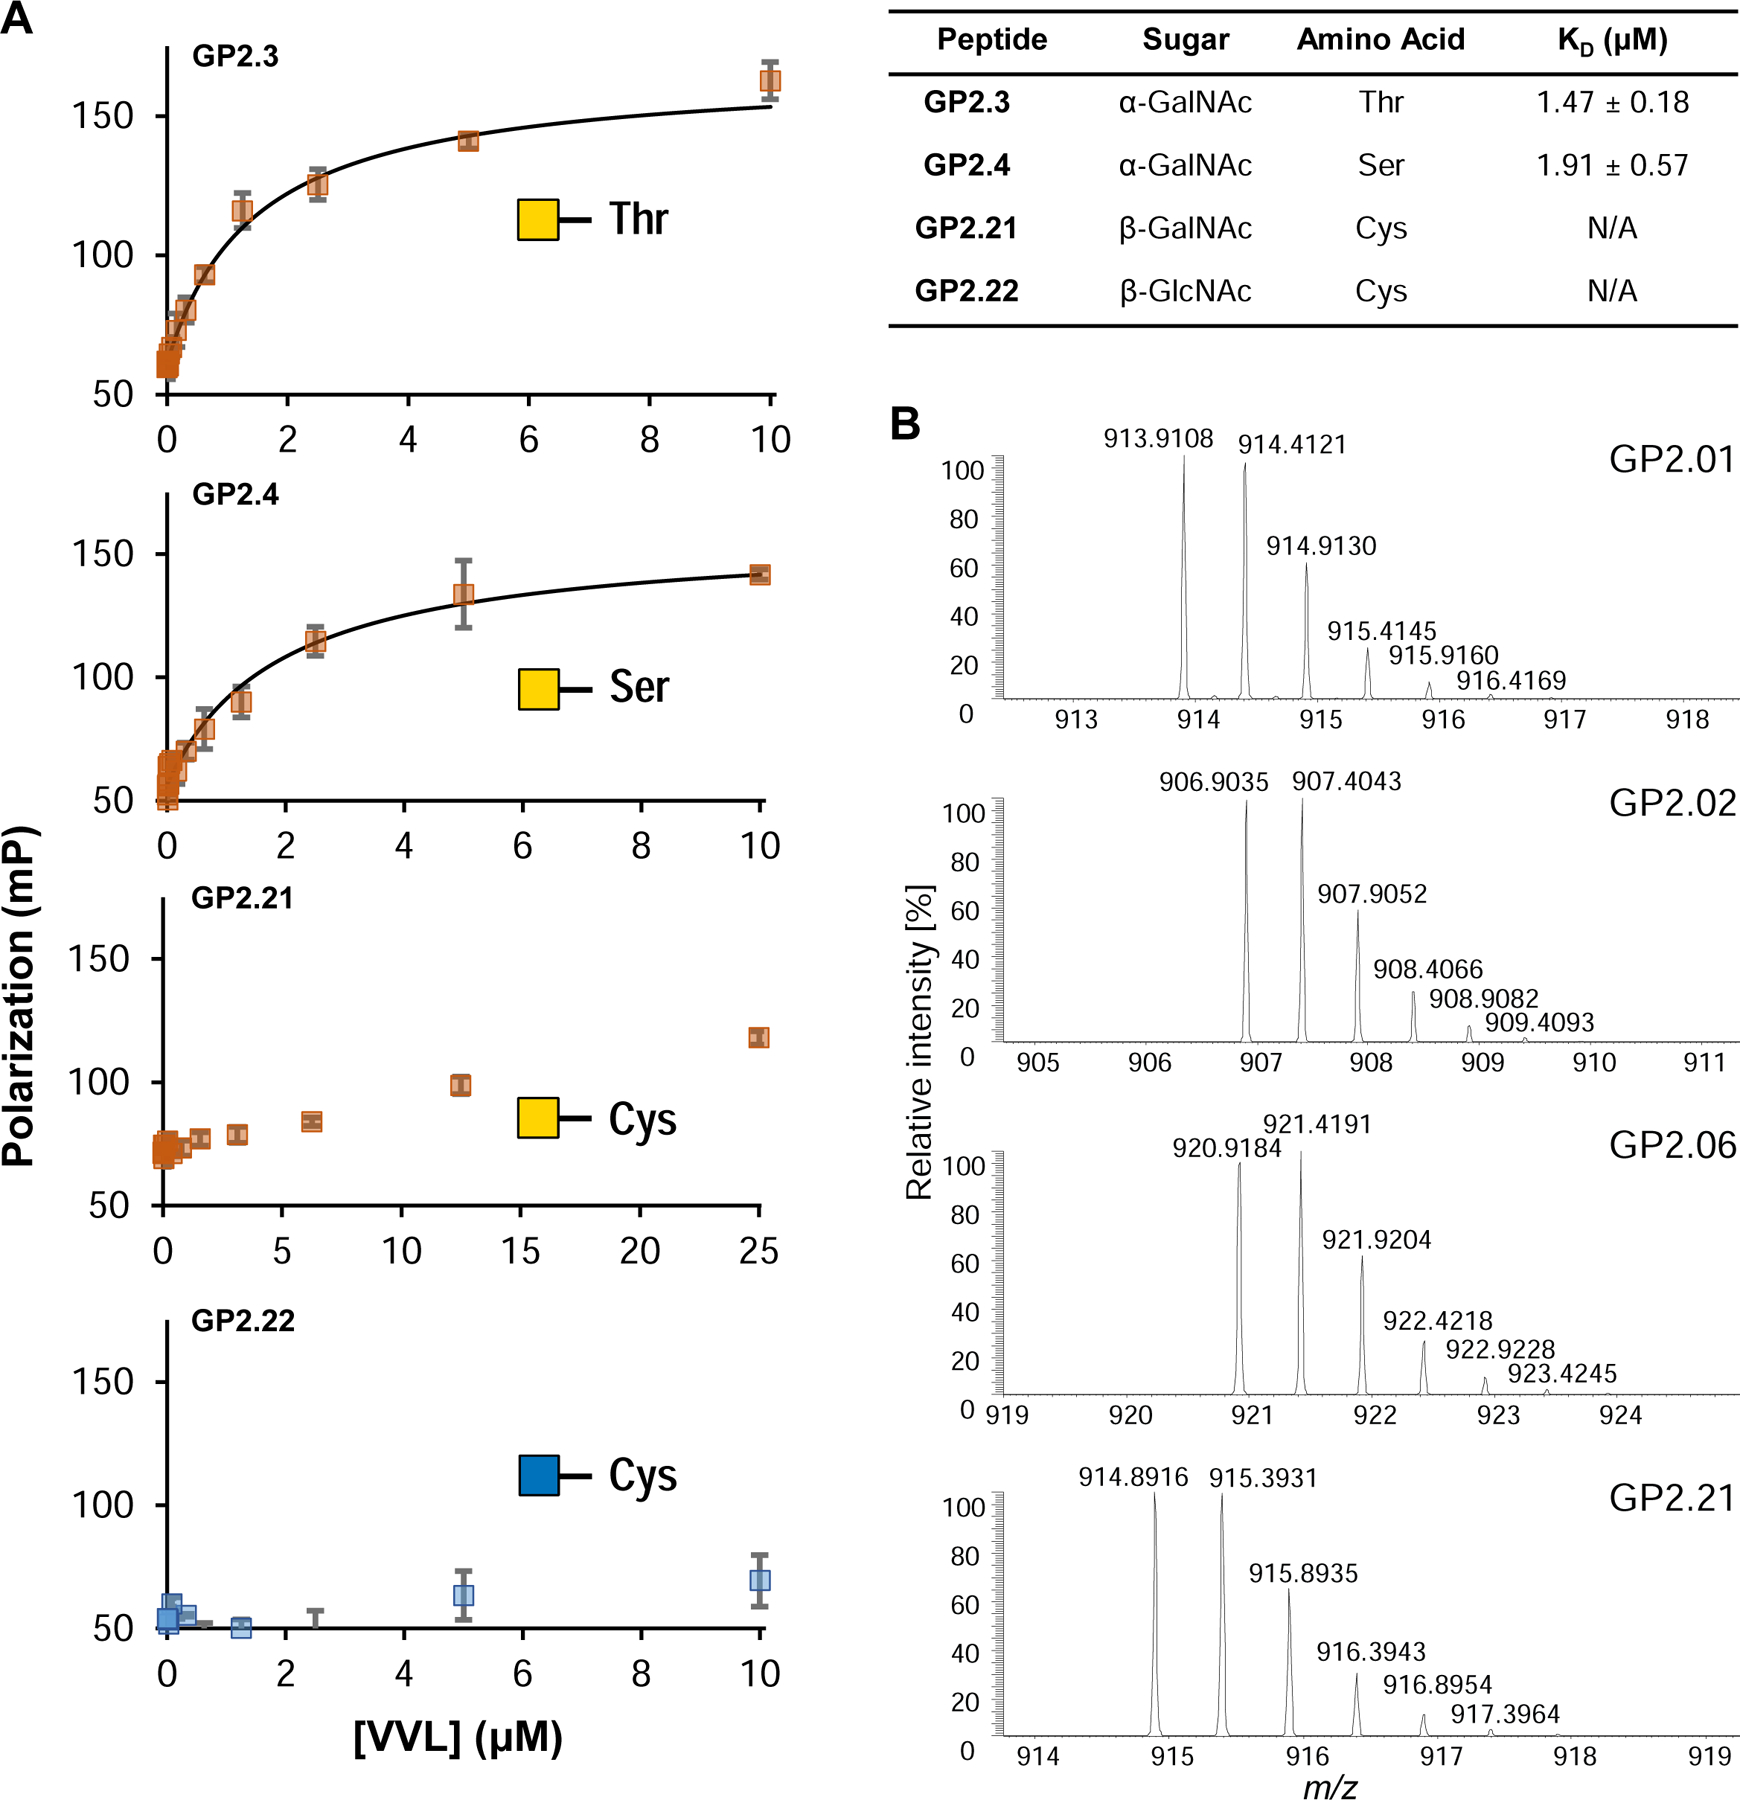
Glycan recognition is typically studied using free glycans, but glycopeptide presentations represent more physiological conditions for glycoproteins. To facilitate studies of glycopeptide recognition, we developed Glyco-SPOT synthesis, which enables the parallel production of diverse glycopeptide libraries at microgram scales. The method uses a closed system for prolonged reactions required for coupling Fmoc-protected glycoamino acids, including O-, N-, and S-linked glycosides, and release conditions to prevent side reactions. To optimize reaction conditions and sample reaction progress, we devised a biopsy testing method. We demonstrate the efficient utilization of such microscale glycopeptide libraries to determine the specificity of glycan-recognizing antibodies (e.g., CTD110.6) using microarrays, enzyme specificity on-array and in-solution (e.g., ST6GalNAc1, GCNT1, and T-synthase), and binding kinetics using fluorescence polarization. We demonstrated that the glycosylation on these peptides can be expanded using glycosyltransferases both in-solution and on-array. This technology will promote the discovery of biological functions of peptide modifications by glycans.

Keywords: CTD110.6; GCNT1; S-GlcNAcylation; ST6GalNAc1; TSynthase; glycan; glycopeptide; glycopeptide library; glycosyltransferase; mass spectrometry; microarray.


Conflict of interest statement

Declaration of Interests The authors declare no conflicts of interest.

Figures

Figure 1.
Figure 1.
(A) Cost of Fmoc-protected glycoamino acids (FPGAs) is >1500 fold higher than their non-glycosylated counterparts on a dollar-per-gram basis. This makes glycopeptide synthesis at milligram scale expensive. (B) FPGAs available commercially account for <1% of the total chemical space of glycoamino acids. The data of total chemical space of glycoamino acids was collected from GlyTouCan database (https://glytoucan.org/). This accounts for 14,239 N-linked and O-linked glycan structures which have been reported in GlyTouCan database. The numbers for commercially available FPGAs was obtained by counting the available structures from vendors like Sigma Aldrich, Sussex Research, GlyTech, CarboSyn. This accounts for 128 FPGA structures. These vendors may have overlapping structures, which could bring this number down even more. (C) Flow chart of the Glyco-SPOT synthesis process. Blue: highlighted modifications to the method in order to incorporate FPGAs into the synthesis to produce glycopeptides.
Figure 2.
Figure 2.
(A) An overview of Glyco-SPOT synthesis strategy and its applications. Briefly, the spot synthesis is carried out on a piece of cellulose filter paper in an enclosed container under a flow of nitrogen using the setup shown above. During the several synthesis cycles, biopsy testing of the spots can be carried out as shown the on the left panel to check the efficacy and completeness of the reaction (See also Figure S1). After all the cycles are complete, the glycopeptide side chains are deprotected, the glycopeptides are released, purified and characterized using analytical techniques such as HPLC and MALDI-MS. For comparison of Glyco-SPOT synthesis strategy to traditional peptide library synthesis strategies see also Table S5. These glycopeptides can then be utilized for a number of applications: (a) The glycopeptides synthesized can further be treated with glycosyltransferase enzymes to either expand the structures in the library, or to explore the enzymatic specificity. (b) To print glycopeptide microarrays that can be utilized to probe glycan binding protein interactions. (c) Such glycopeptide microarrays can also be treated with enzymes, and be probed with lectins to probe the specificity of enzymes or to use such modified microarrays to probe binding of other proteins. (d) Using appropriate tags one can also utilize the glycopeptides to measure binding affinity. (e) The glycopeptides synthesized using this technique have been characterized using LC-MS and can potentially be used as standards in future experiments. (B) Example set of glycopeptides synthesized. The prototypical sequences of a series are shown, along with * indicating variations of amino acid sequences made for the peptides or translucent glycan symbols showing the different glycoforms synthesized. formula image 
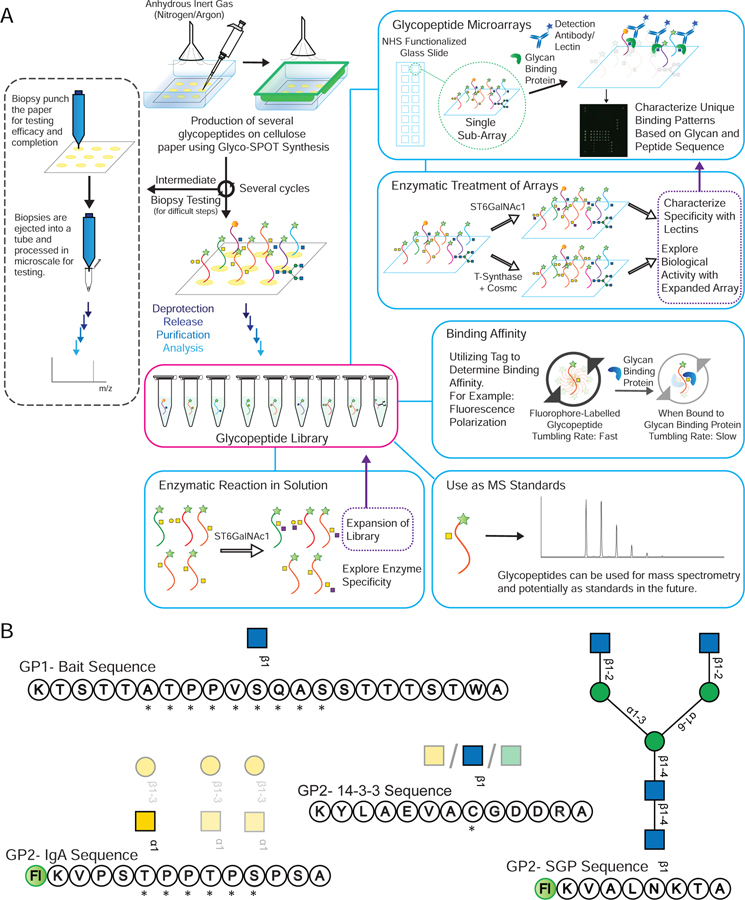
indicates 5(6)-carboxyfluorescein on the N-terminus. For complete list of sequences see also Tables S1 and S2.
Figure 3.
Figure 3.
(A) Proposed mechanism of ester hydrolysis when utilizing sodium bicarbonate in methanol water. (B) Sample MALDI-MS spectra zoomed in to show the methyl ester with a difference of m/z +14 Da for GP2.11.
Figure 4.
Figure 4.
Binding of CTD110.6 antibody on (A) GP1 array at 10 μg/ml, and (B) and (C) GP2 array at 10 μg/ml and 1 μg/ml, respectively. The type of sugar on each peptide on the array is highlighted with color and symbol as shown in the legend. The antibody shows binding to most GlcNAc containing glycopeptides, but dislikes O-GlcNAc containing glycopeptides which have adjacent acidic residues in some sequences. The antibody is unable to differentiate between O-GlcNAc and S-GlcNAc, and in some cases may bind better to S-GlcNAc containing sequences than O-GlcNAc. See also Figures S2 and S3A (lectin binding on microarray), Figure S3B and S3C (hapten competition on GP1 array), Figure S4 (non-specific binding on GP2 array and hapten studies), Figure S5 (testing other antibodies on GP2 array). Error bars represent +/− 1 standard deviation.
Figure 5.
Figure 5.
(A) On-array glycosylation using glycosyltransferase enzymes. The sequences of all the relevant IgA1 glycopeptides containing GalNAcα1- glycosylation are shown on the left where the * indicating the sites of glycosylation and the GP IDs are provided next to the sequence. The figure demonstrates how the binding pattern of lectins change when the array is treated with different glycosyltransferases either (i) ST6GalNAc1: The readout is using the binding of VVL lectin to the GalNAc on the peptides. As the reaction proceeds further, the binding of VVL lectin decreases as the product of the reaction is Neu5Acα2–6GalNAcα1- glycosylation, which is not recognized by the lectin. It was observed that the serine containing glycopeptides (highlighted in light blue or purple for the mixed glycosylation) are more resistant to sialylation by the enzyme. (ii) T-synthase: The readout is using PNA lectin which detects formation of the T-antigen (Galβ1–3GalNAcα1-S/T). Since PNA binds to the product of the reaction we see an increase in the glycosylation for all GalNAc containing peptides. As can be seen, T-synthase is not as selective about glycosylation. The data was normalized to the tallest peak in the dataset to highlight the differences clearly. Error bars represent +/− 1 standard deviation. Full array data is provided in Figure S6. (B) In-solution glycosylation using glycosyltransferase ST6GalNAc1. GP2.05 and GP2.06 were treated with ST6GalNAc1 in solution and the reaction was monitored over time using HPLC and MALDI-MS. As can be seen from the HPLC profiles, GP2.05 which contains GalNAcα1-Ser is resistant to conversion and shows little conversion (<25%) after 18 hours. In comparison GP2.05 contains GalNAcα1-Thr is converted (>80%) within 1.5 hours.
Figure 6.
Figure 6.
(A, B) MALDI-MS of GP2.05 (A) and GP2.06 (B) when reacted with ST6GalNAc1 at time 0, 1.5 and 18h. The peaks observed in the starting material are highlighted in grey, while the product mass is highlighted in blue. The spectra are acquired in negative mode and the starting material shows two major peaks for [M-H]- and [M+TFA-2H2O]- for both GP2.05 and GP2.06 as annotated in the Time: 0hr spectra. As time increases, GP2.05 shows a very small peak for +Neu5Ac peak at 18h suggesting a very sluggish reaction. In comparison, GP2.06 shows a strong signal for the +Neu5Ac peak at 1.5h indicative of a fast reaction with the threonine containing GP2.06. (C) HPLC chromatograms of GCNT1 reaction at time 0h (gray) and 18h (blue) for GP2.08, GP2.09 and GP2.10. The peak in the grey dashed box is the starting material core-1 structure, while the peak in the blue dashed box is the product peak for the core-2 structure. Peaks were confirmed by MALDI-MS. Order of reactivity appears to be GP2.8 > GP2.9 > GP2.10. (D) MALDI-MS of GCNT1 reactions at time 0h and 18h for GP2.08, GP2.09 and GP2.10. The peaks observed in the starting material are highlighted in grey, while the product mass is highlighted in blue. GP2.08 shows practically complete conversion to Core-2 structure in 18h, while GP2.9 and GP2.10 show partial conversion at 18h, with significant starting material peak still remaining. Order of reactivity seems to be GP2.8 > GP2.9 > GP2.10.
Figure 7.
Figure 7.
(A) Fluorescence polarization binding isotherms for 4 glycopeptides against VVL lectin. The lectin shows low micromolar affinity for GalNAcα -Ser/-Thr (GP2.3, GP2.4), while the GalNAcβ- Cys (GP2.21) shows an increase in polarization but is unable to reach saturation under these conditions and therefore the KD is not available. GlcNAcβ-Cys (GP2.22) shows no increase in the polarization at all. KD error represented as +/− SEM. (B) Example mass spectra obtained on Orbitrap LC-MS for 4 glycopeptides from the GP-2 library. The peaks show the parent [M+2H]2+ peak along with the isotope peaks. The spectra of all glycopeptides tested can be found in Supplementary Data S1. See also Figure S7.

References

    1. Apweiler R, Hermjakob H, and Sharon N (1999). On the frequency of protein glycosylation, as deduced from analysis of the SWISS-PROT database. Biochim Biophys Acta 1473, 4–8. - PubMed
    1. Aryal RP, Ju T, and Cummings RD (2010). The endoplasmic reticulum chaperone Cosmc directly promotes in vitro folding of T-synthase. J Biol Chem 285, 2456–2462. - PMC - PubMed
    1. Blixt O, Clo E, Nudelman AS, Sorensen KK, Clausen T, Wandall HH, Livingston PO, Clausen H, and Jensen KJ (2010). A high-throughput O-glycopeptide discovery platform for seromic profiling. J Proteome Res 9, 5250–5261. - PMC - PubMed
    1. Bora U (2011). An Eco-friendly and Mild Process for Deacetylation Reactions in Water. Asian J Chem 23, 941–942.
    1. Bubb WA (2003). NMR spectroscopy in the study of carbohydrates: Characterizing the structural complexity. Concepts in Magnetic Resonance Part A 19A, 1–19.

Publication types

MeSH terms

LinkOut - more resources