. 2020 Aug 18;53(2):335-352.e8.
doi: 10.1016/j.immuni.2020.06.002. Epub 2020 Jun 30.

Transcriptional and Functional Analysis of CD1c+ Human Dendritic Cells Identifies a CD163+ Subset Priming CD8+CD103+ T Cells

Affiliations

Transcriptional and Functional Analysis of CD1c+ Human Dendritic Cells Identifies a CD163+ Subset Priming CD8+CD103+ T Cells

Pierre Bourdely et al. Immunity. .

Abstract

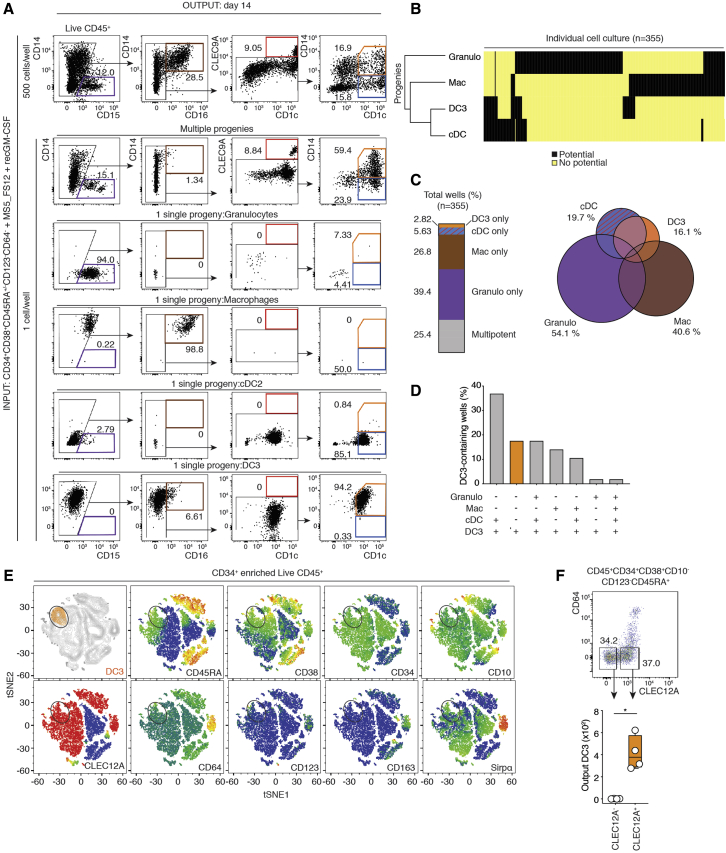
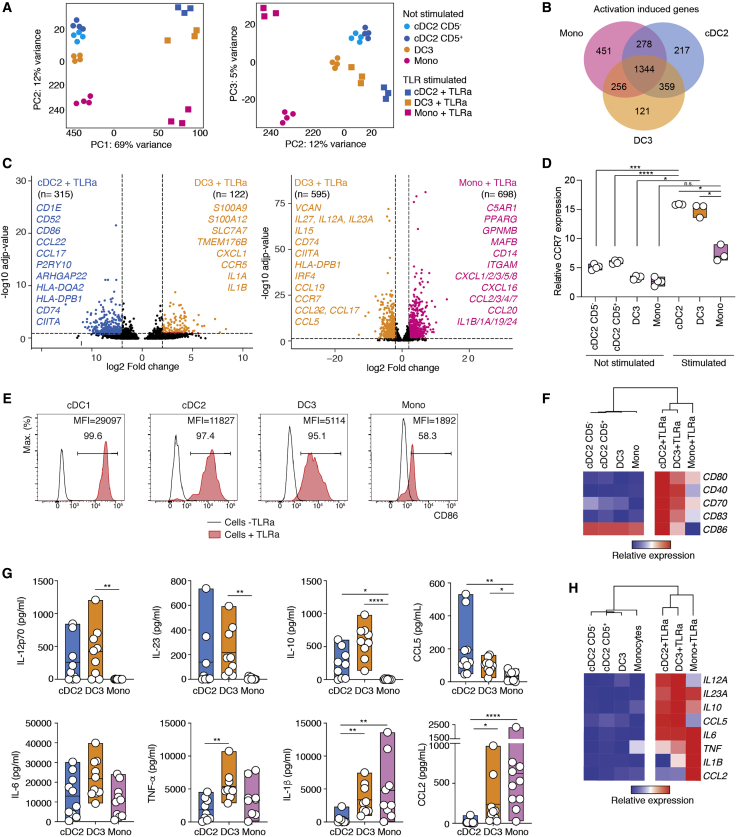
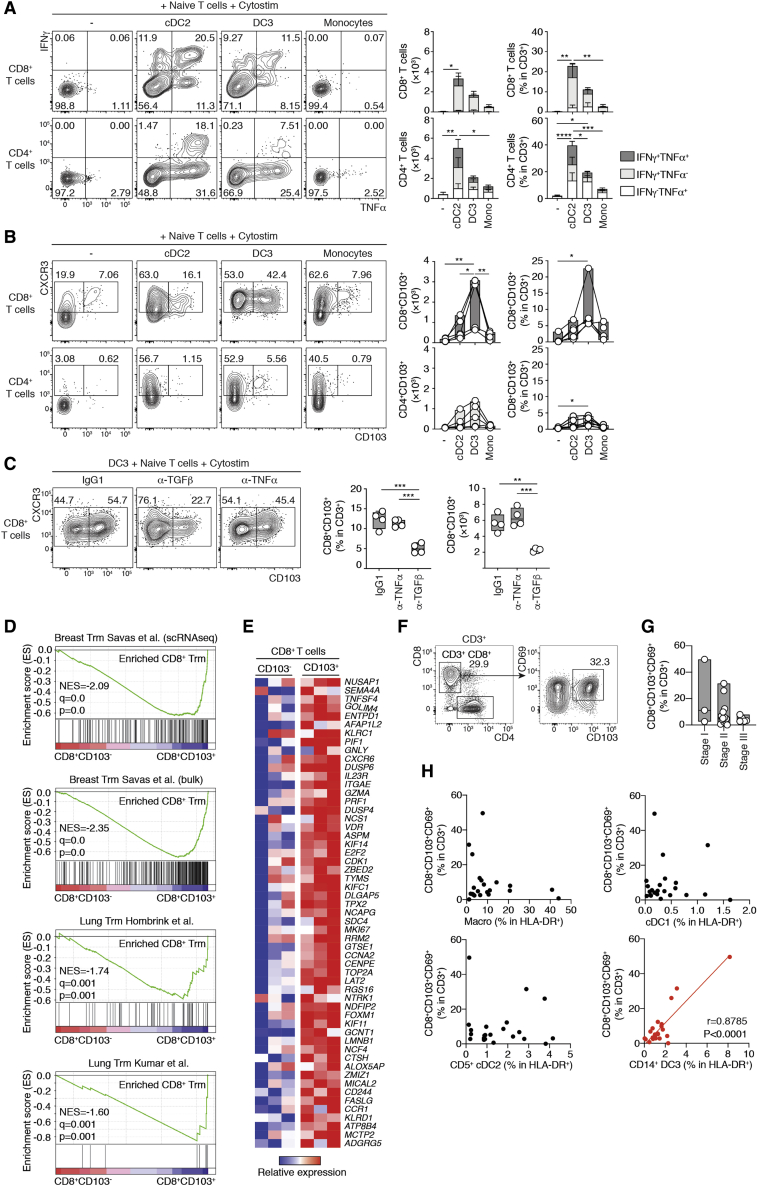
Dendritic cells (DCs) are antigen-presenting cells controlling T cell activation. In humans, the diversity, ontogeny, and functional capabilities of DC subsets are not fully understood. Here, we identified circulating CD88-CD1c+CD163+ DCs (called DC3s) as immediate precursors of inflammatory CD88-CD14+CD1c+CD163+FcεRI+ DCs. DC3s develop via a specific pathway activated by GM-CSF, independent of cDC-restricted (CDP) and monocyte-restricted (cMoP) progenitors. Like classical DCs but unlike monocytes, DC3s drove activation of naive T cells. In vitro, DC3s displayed a distinctive ability to prime CD8+ T cells expressing a tissue homing signature and the epithelial homing alpha-E integrin (CD103) through transforming growth factor β (TGF-β) signaling. In vivo, DC3s infiltrated luminal breast cancer primary tumors, and DC3 infiltration correlated positively with CD8+CD103+CD69+ tissue-resident memory T cells. Together, these findings define DC3s as a lineage of inflammatory DCs endowed with a strong potential to regulate tumor immunity.

Keywords: DC progenitors; DC3s; T(RM); cDC2s; conventional DCs; inflammatory DCs; monocytes; mononuclear phagocytes.


Conflict of interest statement

Declaration of Interests The authors declare no competing interests.

Figures

None
Graphical abstract
Figure 1
Figure 1
DC3s Are a Discrete Subset of CD88CD1c+CD163+ Cells in Human Peripheral Blood (A) Gating strategy used to define mononuclear phagocytes expressing CD14 and/or CD1c. Cells expressing CD14 and/or CD1c were sorted by flow cytometry from 3 healthy donors and pooled before scRNA-seq analysis. To improve the resolution of CD1c+ subsets, the cellular input was enriched in CD1high cells (Figure S1A). Single cells were isolated using a droplet-based approach and sequenced. Dimensionality reduction of scRNA-seq data was performed using dimensionality reduction (t-distributed stochastic neighbor embedding [tSNE]). Clusters A, B, C, and D were identified using the shared nearest neighbor (SNN) clustering algorithm. Each dot represents an individual cell (n = 1,622). (B) Hierarchal clustering of groups A, B, C, and D based on average gene expression (14,933 genes). (C) Absolute number of differentially expressed genes (DEGs) for pairwise comparisons between groups A, B, and D. (D) Heatmaps displaying relative expression of up to 20 DEGs defining each cluster. (E) Violin plots illustrating expression probability distributions across clusters of representative DEGs (226 total DEGs). Feature plots display the average expression of groups of genes (identified in violin plots) in each cell of the tSNE plot defined in (A). (F) Expression distribution across clusters A, B, C, and D of gene signatures identified by Villani et al. (2017) and Yin et al. (2017). (∗∗p < 0.01, ∗∗∗∗p < 0.0001, one-way ANOVA test) (G) Identification of 4 subsets within CD14lo to hi CD1clo to hi cells by unsupervised clustering of flow cytometry data using the FlowSOM algorithm. tSNE and unsupervised clustering were performed using the following markers: CD88, CD1c, FcεRI, CD14, CD163, BTLA, CD123, and CD5. tSNE plots (right) display the relative expression of each marker among the subsets. Dot plots (below) show the expression of specific markers in clusters 1, 2, and 3 when combined in 2-dimensional analysis. (H) Improved gating strategy for identification of cDC2s, DC3s, and CD14+ monocytes in circulating PBMCs and histograms showing expression of S100A8/9, FcεRI, CD5, CD14, CD116, and CD206. (I) Principal-component analysis (PCA) for bulk-sequenced mononuclear phagocyte populations as defined in (H). (J) Cluster dendrogram of the different cell types using the 2,000 most variable genes. (K) Heatmaps comparing the relative expression of markers discriminating clusters in scRNA-seq analysis (A, B, C, and D, left) and in bulk RNA-seq analysis on sorted subsets based on the gating strategy defined in (H) (right). See also Figure S1 and Table S1.
Figure 2
Figure 2
DC3s Infiltrate Human Breast Tumors (A) Representative gating strategy used to define macrophages, CD5+ cDC2s, and CD14+ DC3s and histograms showing the expression of CD163, FcεRI, BTLA, and CD11c in human breast cancer primary tumors. (B) Violin plot quantifying cDC1, CD5+cDC2, CD14+ DC3, and CD14+CD88+ macrophage subsets identified in (A) in human breast cancer primary tumors (n = 25; p < 0.05, ∗∗p < 0.01, ∗∗∗p < 0.001, ∗∗∗∗p < 0.0001, one-way ANOVA test). (C) Pearson correlations of the frequencies of macrophages, cDC1s, CD5+cDC2s, and CD14+ DC3s within HLA-DR+ cells in human breast cancer primary tumors (red, significantly correlated p < 0.05; black, not correlated). (D) HC showing the relative expression of markers used for subset identification in Figure 1 in CD1c+, CD1c+CD14+, and CD14+ cells from invaded lymph nodes draining human breast cancer primary tumors. (E) GSEA of pairwise comparisons of CD1c+CD14+ cells with CD1c+ or CD14+ from invaded lymph nodes draining human breast cancer primary tumors. Gene signatures of blood DC3s compared with cDC2s (DC3 > cDC2) or CD14+ monocytes (DC3 > Mono) and, vice versa, of blood cDC2s (cDC2 > DC3) or CD14+ monocytes (Mono > DC3) compared with DC3s were used (Villani et al., 2017). See also Figure S2 and Table S2.
Figure 3
Figure 3
DC3s Give Rise to CD14+CD1c+ DCs at Inflammatory Sites (A) Experimental model. NSG mice were injected intravenously (i.v.) with B16_CTRL, B16_huFLT3L, or B16_huGM on day 0. On days 7 and 8, 108 human PBMCs were injected i.v. Metastatic lungs were collected on day 9. (B) Pseudocolor images of B16_huGM (green) metastatic lung on day 9 post-injection, stained for human CD45 (red). Nuclei were stained with Hoechst (blue). Scale bar, 100 μm. (C) Gating strategy for cDC2 and DC3 identification in B16_huGM and B16_huFLT3L metastatic mouse lung and histograms showing the expression of CD163, CD206, and Clec10A. The bar graph summarizes the frequency of cDC2s and DC3s among total HLA-DR+ cells in metastatic B16_CTRL, B16_huFLT3L, or B16_huGM mouse lungs (n = 3 independent mice; ∗∗p < 0.01, ∗∗∗p < 0.001, ∗∗∗∗p < 0.0001, one-way ANOVA test). (D) Flow cytometry analysis of flow cytometry-sorted cDC2s, DC3s, and CD14+ monocytes after 2 days of culture with MS5 stromal cells expressing human GM-CSF (MS5_GM). Bar graphs show the frequency of output cells among total huCD45+ cells (n = 4–5 healthy donors). (E) Histograms showing CD14 expression on cDC2s, DC3s, and CD14+ monocytes before and after 2 days of coculture with MS5_GM and bar graphs summarizing the frequency of CD14 expression within each cell type (n = 5 healthy donors, ∗∗p < 0.01, Mann-Whitney two-tailed t test). See also Figures S3 and S4 and Table S1.
Figure 4
Figure 4
DC3s Differentiate from Hematopoietic Progenitors upon GM-CSF Exposure Independent of Mono-Committed Progenitors (cMoPs) or cDC-Committed Progenitors (CDPs) (A) Flow cytometry analysis of cord blood-derived CD34+ HSPCs cultured on stromal cells expressing human FLT3L, SCF, and CXCL12 (MS5_FS12) with or without human recombinant GM-CSF (MS5_FS12+recGM-CSF) for 14 days. (B) Flow cytometry plots of BTLA and CD163 expression within CD1c+CD14 and CD1c+CD14+ cells identified in (A). Bar graphs summarize the absolute numbers of differentiated CD1c+CD14 cDC2s and CD1c+CD14+ DC3s (a line represents the median; n = 6 independent cord blood donors, p < 0.05, Wilcoxon test). (C) Bar graphs summarizing the absolute numbers of CD1c+CD14CD163 cDC2s and CD1c+CD14+CD163+ DC3s differentiated from cord blood-derived CD34+ HSPCs cocultured for 14 days with stromal cells expressing human FLT3L (MS5_FL), GM-CSF (MS5_GM), or neither (MS5_CTRL) (a line represents the median; n = 5–7 independent cord blood donors, p < 0.05, ∗∗p < 0.01, ∗∗∗p < 0.001, Wilcoxon test). (D) HC based on 19,791 protein-coding genes of in-vitro-generated subsets differentiated from CD34+ HSPCs cultured with MS5_FS12 supplemented with human recombinant GM-CSF (MS5_FS12+recGM-CSF). Each dot represents an average of three donors. (E) Volcano plots showing the DEGs between in-vitro-generated DC3s cells (orange) compared with cDC2s (blue and turquoise, left plot) or macrophages (gray and brown, right plot). Genes with Log2(fold change, FC) > ±2 and a false discovery rate (FDR)-adjusted p value of less than 0.05 were considered significant. (F) GSEA of pairwise comparisons of DC3s with cDC2s or macrophages generated in vitro. Gene signatures (gene set) defining genes upregulated in blood DC3s compared with cDC2s (DC3 > cDC2) or blood DC3s compared with CD14+ monocytes (DC3 > CD14 Mono) were used (Villani et al., 2017) (NES, normalized enrichment score). (G) BubbleMap summarizing the enrichment of defined gene sets in pairwise comparisons of in-vitro-differentiated DC3s versus in vitro cDC2s or in vitro macrophages. Gene signatures (gene sets) of blood DC3s compared with cDC2s (DC3 > cDC2) or CD14+ monocytes (DC3 > Mono) and, vice versa, of blood cDC2s (cDC2 > DC3) or CD14+ monocytes (Mono > DC3) compared with DC3s were used (Villani et al., 2017). (H) Flow cytometry analysis of cord blood-derived CDPs, cMoPs, and GMDPs cultured for 7 days with MS5_FS12 or MS5_GM. Bar graphs summarize the absolute number of differentiated cells from each progenitor (a line represents the median, n = 4–7 independent cord blood donors). See also Figure S5 and Table S1.
Figure 5
Figure 5
Single-Cell Analysis of DC3 Commitment (A) Flow cytometry analysis of bulk (500 cells) or single CD34+CD38+CD123CD64 progenitor cells cocultured for 14 days with MS5_FS12 supplemented with recombinant human GM-CSF (MS5_FS12+recGM-CSF). Flow cytometry plots resulting from single CD34+CD38+CD123CD64 progenitor cells with different potentials are shown as representative examples (n = 355 cells from 2 independent experiments). (B) HC of lineage potential from single CD34+CD38+CD123CD64 progenitor cells (n = 355). (C) Bar graph and Venn diagram summarizing the frequency of the potential of mono-, bi-, tri-, or multipotent individual CD34+CD38+CD123CD64 cells within the total wells analyzed (n = 355). (D) Bar graphs summarizing the frequency of mono-, bi-, tri-, or multipotent individual CD34+CD38+CD123CD64 cells among DC3-generating progenitors only. An orange bar represents the frequency of DC3-restricted progenitors. (E) Cell surface phenotype of DC3-restricted progenitors before differentiation cultures inferred by index flow cytometry sorting. tSNE plots display an overlay of total CD45+ cells (gray) and DC3-restricted progenitor cells (orange) (top left). Shown is relative expression of the markers CD45RA, CD38, CD34, CD10, Clec12A, CD64, CD123, CD163, and SIRPα. (F) Validation experiment for identification of Clec12A as a marker for DC3-committed progenitors. Shown is flow cytometry analysis of bulk-sorted CD34+CD38+CD45RA+CD123CD64Clec12A and Clec12A+ cells. 500 cells were cocultured with MS5_GM for 7 days. The bar graph summarizes the number of differentiated DC3s from each bulk population (n = 4 healthy donors, p < 0.05, Mann-Whitney two-tailed t test). See also Figure S5.
Figure 6
Figure 6
DC3s Respond to TLR Stimulation We performed bulk RNA-seq analysis of BTLA+CD5+ and BTLA+CD5 cDC2s, DC3s, and monocytes sorted as shown in Figure 1H and stimulated overnight (16 h, 3 donors) or not (4 donors) with a TLR agonist cocktail (25 μg/mL poly(I:C), 1 μg/mL R848, and 10 ng/mL LPS). For activation of cDC2s, BTLA+CD5+ and BTLA+CD5 were pooled. (A) PCA analysis for all genes. (B) Venn diagram summarizing the number of activation-induced DEGs upregulated in stimulated compared with unstimulated cells within each cell population. (C) Volcano plots showing DEGs between TLR agonist-stimulated DC3s compared with TLR agonist-stimulated cDC2s or TLR agonist-stimulated monocytes. Genes with Log2(FC) > ±2 and a FDR-adjusted p value of less than 0.05 were considered significant. (D) Bar graph summarizing relative CCR7 gene expression within TLR-agonist stimulated or unstimulated mononuclear phagocyte populations (n = 3–4; a line represents the median; p < 0.05, ∗∗p < 0.01, ∗∗∗p < 0.001, ∗∗∗∗p < 0.0001, one-way ANOVA test). (E) Histograms showing the frequency and median of fluorescence intensity (MFI) of CD86 on TLR agonist-stimulated or unstimulated mononuclear phagocyte populations. (F) Heatmap showing the relative gene expression of selected costimulatory molecules on TLR agonist-stimulated or unstimulated mononuclear phagocyte populations. (G) Quantification of cytokines and chemokines secreted by cDC2s, DC3s, and CD14+ monocytes in response to overnight stimulation with a cocktail of TLR agonists (n = 9 healthy donors; a line represents the median; p < 0.05, ∗∗p < 0,01, ∗∗∗∗p < 0,0001, one-way ANOVA test). (H) Heatmap showing the relative gene expression of cytokines and chemokines analyzed in (G) within TLR-agonist stimulated or unstimulated mononuclear phagocyte populations. See also Figure S6 and Table S1.
Figure 7
Figure 7
DC3s Prime Naive T Cells and Drive Acquisition of the CD103+ TRM Phenotype (A and B) Representative flow cytometry plots and quantification of CD4+ and CD8+ naive T cells cultured for 5 days with flow cytometry-sorted blood cDC2s, DC3s, or CD14+ monocytes after overnight activation with TLR agonists (25 μg/mL poly(I:C), 1 μg/mL R848, and 10 ng/mL LPS) in the presence of a synthetic superantigen (Cytostim). Absolute numbers and frequencies of cytokine-producing and other activated T cells (A) and CD103+ T cells (B) are shown (n = 5 healthy donors in 5 independent experiments; a line represents the median; p < 0.05, ∗∗p < 0.01, ∗∗∗p < 0.001, ∗∗∗∗p < 0.0001, one-way ANOVA test). (C) Representative flow cytometry plots and quantification showing CD103 expression on CD8+ naive T cells cocultured with blood DC3s sorted by fluorescence-activated cell sorting (FACS) in the presence of 10 μg/mL of neutralizing antibodies against TNF-α or TGF-β or an isotype CTRL (n = 4 healthy donors in 3 independent experiments; a line represents the median; p < 0.05, ∗∗p < 0.01, ∗∗∗p < 0.001, ∗∗∗∗p < 0.0001, one-way paired ANOVA test). (D and E) Bulk RNA-seq analysis of CD8+CD103 T cells (n = 3) and CD8+CD103+ T cells (n = 3) sorted by flow cytometry after 5 days in vitro coculture of naive blood CD8+ T cells with blood DC3s activated overnight by TLR agonists. (D) GSEA of pairwise comparisons of CD8+CD103+ T cells with CD8+CD103 T cells. Gene signatures (gene set) defining genes upregulated in breast or lung CD103+CD69+CD8+ TRM cells were used (Hombrink et al., 2016; Kumar et al., 2017; Savas et al., 2018). (E) Heatmap displaying 56 representative genes significantly upregulated in CD8+CD103+ cells compared with CD8+CD103 induced by blood DC3s in vitro (of 205 DEGs). Selected genes are shared with at least one of the previously reported gene signatures defining human TRM cells (Hombrink et al., 2016; Kumar et al., 2017; Savas et al., 2018). (F–H) Correlative analysis of TRM cell content in luminal breast cancer primary tumors. (F) Representative flow cytometry plots showing the gating strategy for CD103+CD69+CD8+ T cells in 21 human luminal breast cancer primary tumors. (G) Quantification of CD103+CD69+CD8+ T cells in different stages of human breast tumors (stage I, n = 3; stage II, n = 13; stage III, n = 5). (H) Pearson correlation of the frequencies of the macrophages and cDC1, CD1c+ CD14, and CD1c+ CD14 cells and the frequencies of CD103+CD69+CD8+ T cells in human breast cancer primary tumors (red, significantly correlated p < 0.05; black, not correlated). See also Figure S7 and Tables S1 and S2.

Comment in

References

    1. Acosta-Rodriguez E.V., Napolitani G., Lanzavecchia A., Sallusto F. Interleukins 1beta and 6 but not transforming growth factor-beta are essential for the differentiation of interleukin 17-producing human T helper cells. Nat. Immunol. 2007;8:942–949. - PubMed
    1. Anselmi G., Vaivode K., Dutertre C.A., Bourdely P., Missolo-Koussou Y., Newell E., Hickman O., Wood K., Saxena A., Helft J. Engineered niches support the development of human dendritic cells in humanized mice. Nat. Commun. 2020;11:2054. - PMC - PubMed
    1. Bachem A., Güttler S., Hartung E., Ebstein F., Schaefer M., Tannert A., Salama A., Movassaghi K., Opitz C., Mages H.W. Superior antigen cross-presentation and XCR1 expression define human CD11c+CD141+ cells as homologues of mouse CD8+ dendritic cells. J. Exp. Med. 2010;207:1273–1281. - PMC - PubMed
    1. Bakdash G., Buschow S.I., Gorris M.A., Halilovic A., Hato S.V., Sköld A.E., Schreibelt G., Sittig S.P., Torensma R., Duiveman-de Boer T. Expansion of a BDCA1+CD14+ Myeloid Cell Population in Melanoma Patients May Attenuate the Efficacy of Dendritic Cell Vaccines. Cancer Res. 2016;76:4332–4346. - PubMed
    1. Banchereau J., Steinman R.M. Dendritic cells and the control of immunity. Nature. 1998;392:245–252. - PubMed

Publication types

MeSH terms