. 2020 Nov 3;32(5):878-888.e6.
doi: 10.1016/j.cmet.2020.06.005. Epub 2020 Jun 30.

A Universal Gut-Microbiome-Derived Signature Predicts Cirrhosis

Affiliations

A Universal Gut-Microbiome-Derived Signature Predicts Cirrhosis

Tae Gyu Oh et al. Cell Metab. .

Erratum in

  • A Universal Gut-Microbiome-Derived Signature Predicts Cirrhosis.
    Oh TG, Kim SM, Caussy C, Fu T, Guo J, Bassirian S, Singh S, Madamba EV, Bettencourt R, Richards L, Yu RT, Atkins AR, Huan T, Brenner DA, Sirlin CB, Downes M, Evans RM, Loomba R. Oh TG, et al. Cell Metab. 2020 Nov 3;32(5):901. doi: 10.1016/j.cmet.2020.10.015. Cell Metab. 2020. PMID: 33147487 Free PMC article. No abstract available.

Abstract

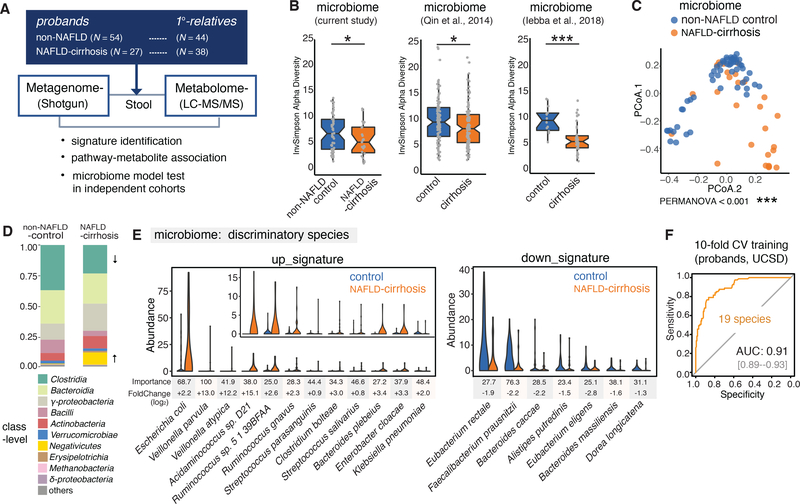
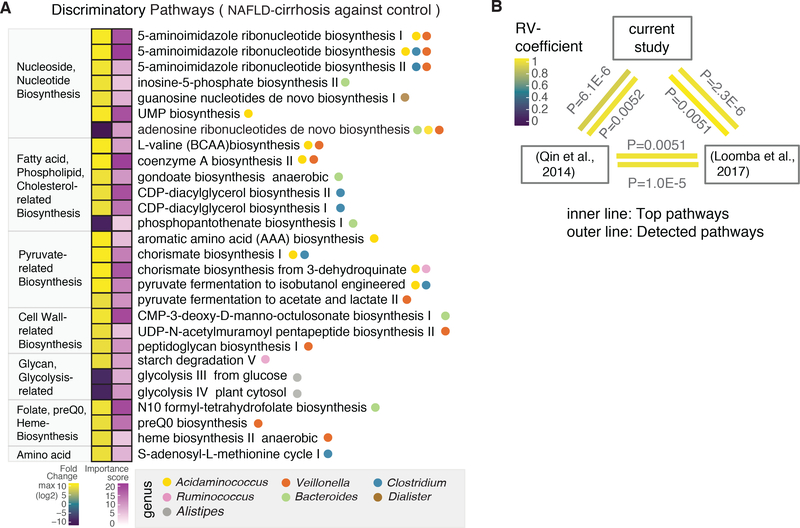
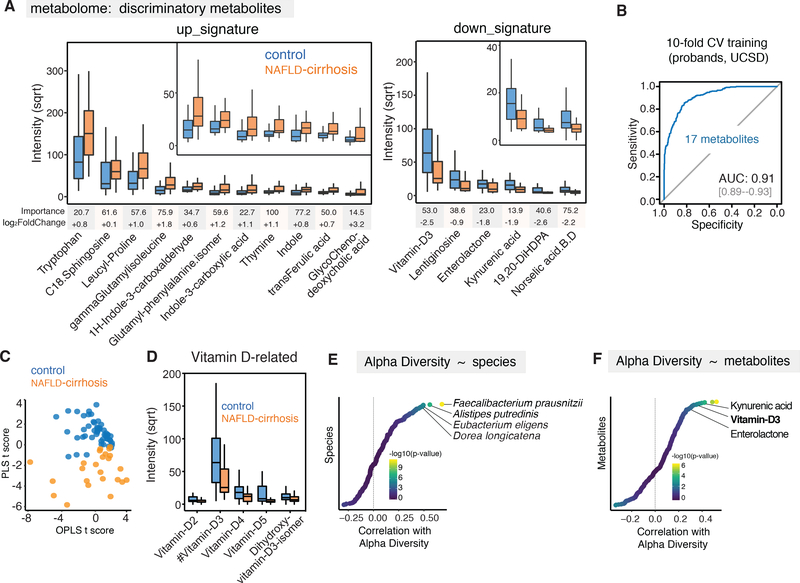
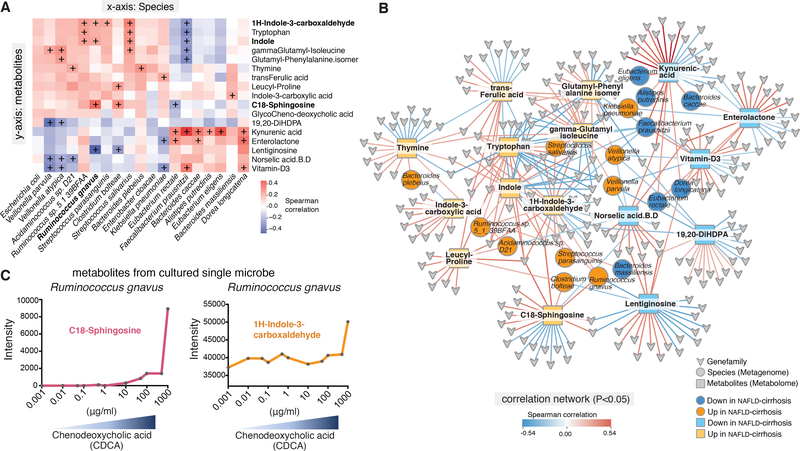
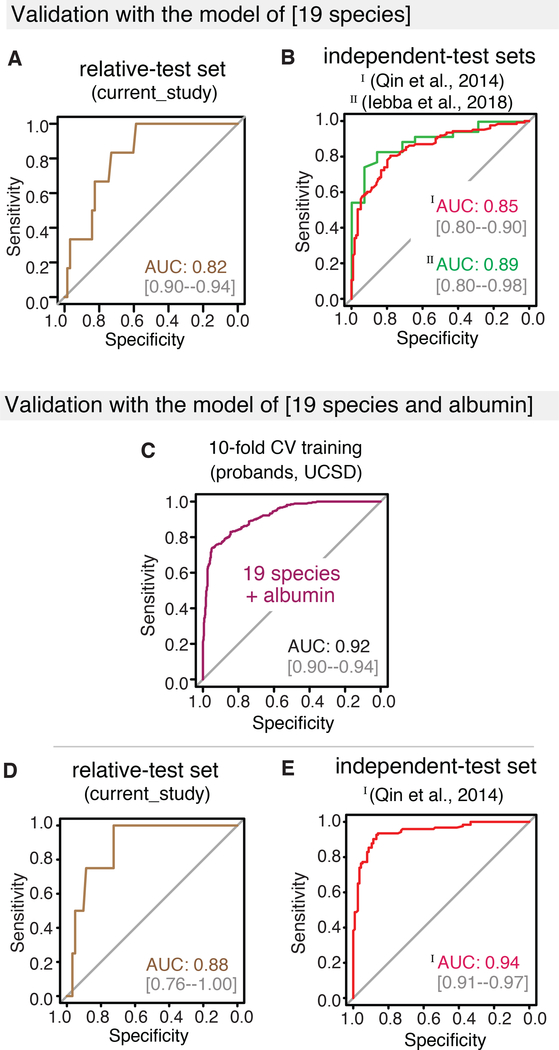
Dysregulation of the gut microbiome has been implicated in the progression of non-alcoholic fatty liver disease (NAFLD) to advanced fibrosis and cirrhosis. To determine the diagnostic capacity of this association, we compared stool microbiomes across 163 well-characterized participants encompassing non-NAFLD controls, NAFLD-cirrhosis patients, and their first-degree relatives. Interrogation of shotgun metagenomic and untargeted metabolomic profiles by using the random forest machine learning algorithm and differential abundance analysis identified discrete metagenomic and metabolomic signatures that were similarly effective in detecting cirrhosis (diagnostic accuracy 0.91, area under curve [AUC]). Combining the metagenomic signature with age and serum albumin levels accurately distinguished cirrhosis in etiologically and genetically distinct cohorts from geographically separated regions. Additional inclusion of serum aspartate aminotransferase levels, which are increased in cirrhosis patients, enabled discrimination of cirrhosis from earlier stages of fibrosis. These findings demonstrate that a core set of gut microbiome species might offer universal utility as a non-invasive diagnostic test for cirrhosis.

Keywords: NAFLD; NASH; biomarker; cirrhosis; fatty liver; liver fibrosis; metabolomics; metagenomics; microbiome; microbiota; non-alcoholic fatty liver disease; non-alcoholic steatohepatitis.


Conflict of interest statement

Declaration of Interests The authors declare no competing interests.

Figures

Figure 1.
Figure 1.. Major alterations in the gut microbiome profiles of the NAFLD-cirrhosis group compared to the non-NAFLD control group
(A) Study overview depicting the study cohort, sample collection, and stool metagenomic and metabolomic analyses. (B) Inverse Simpson α-diversity scores highlighted significant decreases in the richness of gut microbiota from the NAFLD-cirrhosis group (N = 27) compared to the non-NAFLD control group (N = 54; P < 0.05). Significant α-diversity differences were also observed between non-NAFLD control group and NAFLD-cirrhosis patients in cohorts from China and Italy (P < 0.05 and P < 0.001, respectively). Gray dots represent values for individual participants. Boxes represent the interquartile range (IQR) between the first and third quartiles. Median values are represented by horizontal lines within the boxes. Notches represent 95% confidence intervals for the medians. Whiskers indicate the range from minimum (first quartile – 1.5*IQR) to maximum (third quartiles + 1.5*IQR). The estimate_richness function of phyloseq was utilized for this analysis. *P < 0.05, ***P < 0.001. T-test was used to determine significance. (C) Principal coordinate analysis demonstrating significant separation between stool samples from NAFLD-cirrhosis and non-NAFLD control groups, using weighted-UniFrac distances. Blue dots represent individual non-NAFLD control participants. Orange dots represent individual NAFLD-cirrhosis patients. PERMANOVA was performed to determine significance (P < 0.001). (D) Stacked bar plots depicting class-level differences in gut microbiome composition between the NAFLD-cirrhosis and non-NAFLD control groups. The “Other” subcategory included viruses, fungi and rare species (< 1%). (E) Relative abundances of top discriminatory microbial species for the prediction of NAFLD-cirrhosis. Violin plots depict the relative abundances of the top 19 discriminatory species identified by Random Forest (RF) machine learning in the NAFLD-cirrhosis and non-NAFLD control groups. Species were chosen from the highest scores of Mean Decrease in Gini using RF feature selection. Importance scores in the RF classification model and fold-change levels in log2 scale are noted below the plot for each species. (F) Receiver operating characteristic (ROC) curve of the RF model using 19 discriminatory species in the UCSD proband cohort including 27 NAFLD-cirrhosis and 54 non-NAFLD control stool samples. Random Forest (RF) method was used with train function of R’s caret package. For training set, 10-fold cross-validation (CV) was applied with trainControl function. To compute and visualize AUC from ROC outcome, the pROC package was utilized.
Figure 2.
Figure 2.. Microbial functional pathways altered in cirrhosis.
(A) Microbial pathways associated with NAFLD-cirrhosis and non-NAFLD control groups were identified using the HUMAnN2 tool, which includes an analysis of microbial gene-families. Discriminatory pathways were selected using feature selection by Random Forest (RF) and differential abundance analyses through the computation of mean decrease in Gini and fold-change. Left column denotes fold-change, based on log2 scale. In the fold-change color scale, yellow represents microbial pathways that were increased in the NAFLD-cirrhosis group compared to the non-NAFLD control group. Purple represents pathways that were decreased in the NAFLD-cirrhosis group compared to the non-NAFLD control group. Right column denotes importance of the pathway in the RF model, based on Mean Decrease in Gini score. In the associated color scale, pathway importance is represented by a gradient going from light purple to dark purple. Circles denote specific genera that significantly associate with discriminatory functional pathways. (B) A multivariate RV-coefficient analysis was performed with HUMAnN2 pathway outcomes from three different datasets including the current study, Chinese cohort and our previous study. The statistic tool, the FactorMineR package, was utilized to calculate RV-coefficient scores among cohorts. The color of the inner line represents the significant of top discriminatory pathways shown in Figure 2A. Outer line represents the significance of pattern alteration from all detected pathways.
Figure 3.
Figure 3.. Identification of discriminatory metabolites for cirrhosis
(A) 17 discriminatory metabolites were identified in NAFLD-cirrhosis group versus non-NAFLD control group. Metabolites were chosen from the highest scores of Mean Decrease in Gini using Random Forest (RF) feature selection. Importance scores in the RF classification model and fold-change levels in square root (sqrt) scale are presented below the plot for each metabolite. Boxes represent the interquartile range (IQR) between the first and third quartiles. Median values are represented by horizontal lines within the boxes. Notches represent 95% confidence intervals for the medians. Whiskers indicate the range from minimum (first quartile - 1.5*IQR) to maximum (third quartiles + 1.5*IQR). (B) ROC curve of the RF model using 17 discriminatory metabolites in the UCSD proband cohort. RF method was used with train function of R’s caret package. For training set, 10-fold cross-validation (CV) was applied with trainControl function. (C) Discriminative power of significant metabolites using a multivariate model, Orthogonal PLS (OPLS). R’s ropls package was utilized to compute Partial Least Squares (PLS) and OPLS scores. The scatter plot was generated with the ggplot2. (D) Decreased abundance of vitamin D derivatives in NAFLD-cirrhosis group relative to non-NAFLD control group. Decreased intensity of vitamin D2–5 and dihydroxy-vitamin D3 isomer in square root scale were shown using the boxplots. (E) Correlation analysis between relative abundance of species and α-diversity using Spearman’s test. Statistic outcome was shown with gradient colors in -log10(P-value) scale. Correlation r scores were presented in x-axis. (F) Correlation analysis between metabolites and α-diversity using Spearman’s test. Statistic outcome was shown with gradient colors in -log10(P-value) scale. Correlation r scores were presented in x-axis.
Figure 4.
Figure 4.. Interaction network of metagenomic and metabolomic features for cirrhosis
(A) Key discriminatory microbial species show significant associations with specific stool metabolites. The heatmap depicts correlative relationships between 19 discriminatory microbial species and 17 metabolites identified in the NAFLD-cirrhosis and non-NAFLD control groups. Color scale represents Spearman correlation coefficients. Red denotes strong positive correlations. Blue denotes strong negative correlations. Correlation r scores were visualized with gradient colors using the ggplot2 package of R. + denotes p < 0.05. (B) Network map depicting relationships between species, metabolites, and microbial gene-families that are significantly associated with either the up- or down-signature in the NAFLD-cirrhosis group (P < 0.05). Color scale represents the Spearman correlation coefficient. Red denotes positive associations between components of the network; blue denotes negative associations. Species nodes are represented as circles. Orange denotes species that are significantly associated with the up-signature in the NAFLD-cirrhosis group. Dark blue denotes species that are significantly associated with the down-signature in the NAFLD-cirrhosis group. Metabolite nodes are represented as squares. Yellow denotes metabolites that are significantly associated with the up-signature in the NAFLD-cirrhosis group. Light blue denotes metabolites that are significantly associated with the down-signature in the NAFLD-cirrhosis group. Microbial gene-family nodes are represented as arrowheads. Interactions were visualized using Cytoscape. (C) Anaerobic culturing of Ruminococcus gnavus with increased chenodeoxycholic acid (CDCA) demonstrates increased production of discriminatory metabolites (e.g., C18-Sphingosine and 1H-Indole-3-carboxaldehyde).
Figure 5.
Figure 5.. Validation of the machine learning RF model from stool metagenome for cirrhosis
(A) Validation of the RF model using 19 discriminatory species and age in the UCSD relatives cohort for NAFLD-cirrhosis. ROC curve shows the diagnostic accuracy of the RF model in identifying cirrhosis in the UCSD relatives cohort. The 19-discriminatory species and age identified NAFLD-cirrhosis with a robust accuracy of AUC 0.88. RF modeling was implemented using the train function in R’s caret package. To compute and visualize AUC from ROC outcome, the pROC package was utilized. (B) External validation of the RF model in geographically independent cohorts of patients with cirrhosis. ROC curves show the diagnostic accuracy of the RF model in identifying cirrhosis in cohorts from China (123 cirrhosis patients and 114 controls; total N=237) and Italy (35 cirrhosis and 14 controls; total N = 49). The 19-discriminatory species and age identified cirrhosis of multiple etiologies with robust accuracy. For Chinese cohort (red line) the AUC was 0.86. Validation in Italian dataset was performed with 19 species, due to limitation of demographic data. For the Italian cohort (green line), the AUC was 0.89. (C-D) Validation of the RF model using 19 discriminatory species, age and serum albumin in the UCSD relative and Chinese cohorts. ROC curves show the diagnostic accuracy of a 22-feature RF model combining 19-microbial species, age, and serum albumin scores in identifying cirrhosis in geographically independent cohorts--the UCSD relative and Chinese cohorts. The addition of serum albumin levels to the 19 discriminatory species improved the model’s diagnostic accuracy in the (C) UCSD relative cohort (AUC 0.91) and (D) Chinese cohort (AUC 0.95). (E-F) Accuracy of microbiome-based signature to differentiate cirrhosis from fibrosis in a previously-described mixed fibrosis cohort. ROC curves show the diagnostic accuracy of an RF model combining 19-microbial species and age in identifying cirrhosis in a cohort of NAFLD patients with mixed fibrosis stages (stage 0 [NAFL, N = 36]; stages 1–3 [mid fibrosis, N = 41]; stage 4 [cirrhosis, N = 9]). (G-H) Effect of including serum liver damage marker AST on the accuracy of discriminating cirrhosis from fibrosis in the mixed cohort described in (E-F). (I-J) Relative abundances of signature microbial species with disease progression. Data from the current NAFLD-cirrhosis study (27 cirrhosis) was combined with the mixed fibrosis cohort described in (E-F) and analyzed using Kruskal-Wallis ANOVA test, fast zero-inflated negative binomial mixed model (FZINBMM) and DESeq2. * p < 0.05, ** p < 0.01, *** p < 0.001.

Comment in

References

    1. Acharya C, and Bajaj JS (2019). Altered Microbiome in Patients With Cirrhosis and Complications. Clinical gastroenterology and hepatology : the official clinical practice journal of the American Gastroenterological Association 17, 307–321. - PMC - PubMed
    1. Caussy C, Alquiraish MH, Nguyen P, Hernandez C, Cepin S, Fortney LE, Ajmera V, Bettencourt R, Collier S, Hooker J, et al. (2018a). Optimal threshold of controlled attenuation parameter with MRI-PDFF as the gold standard for the detection of hepatic steatosis. Hepatology (Baltimore, Md) 67, 1348–1359. - PMC - PubMed
    1. Caussy C, Bhargava M, Villesen IF, Gudmann NS, Leeming DJ, Karsdal MA, Faulkner C, Bao D, Liu A, Lo MT, et al. (2019a). Collagen formation assessed by PRO-C3 is an heritable trait and is associated with liver fibrosis assessed by MRE. Hepatology (Baltimore, Md). - PMC - PubMed
    1. Caussy C, Hsu C, Lo MT, Liu A, Bettencourt R, Ajmera VH, Bassirian S, Hooker J, Sy E, Richards L, et al. (2018b). Link between gut-microbiome derived metabolite and shared gene-effects with hepatic steatosis and fibrosis in NAFLD. Hepatology (Baltimore, Md). - PMC - PubMed
    1. Caussy C, Soni M, Cui J, Bettencourt R, Schork N, Chen CH, Ikhwan MA, Bassirian S, Cepin S, Gonzalez MP, et al. (2017). Nonalcoholic fatty liver disease with cirrhosis increases familial risk for advanced fibrosis. J Clin Invest 127, 2697–2704. - PMC - PubMed

Publication types

Substances