. 2020 Aug 4;32(2):188-202.e5.
doi: 10.1016/j.cmet.2020.06.016. Epub 2020 Jun 24.

Omics-Driven Systems Interrogation of Metabolic Dysregulation in COVID-19 Pathogenesis

Affiliations

Omics-Driven Systems Interrogation of Metabolic Dysregulation in COVID-19 Pathogenesis

Jin-Wen Song et al. Cell Metab. .

Abstract

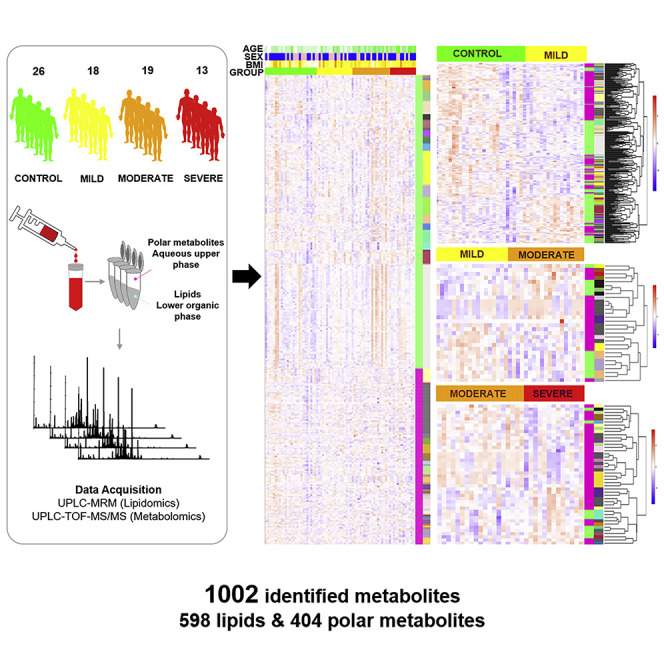
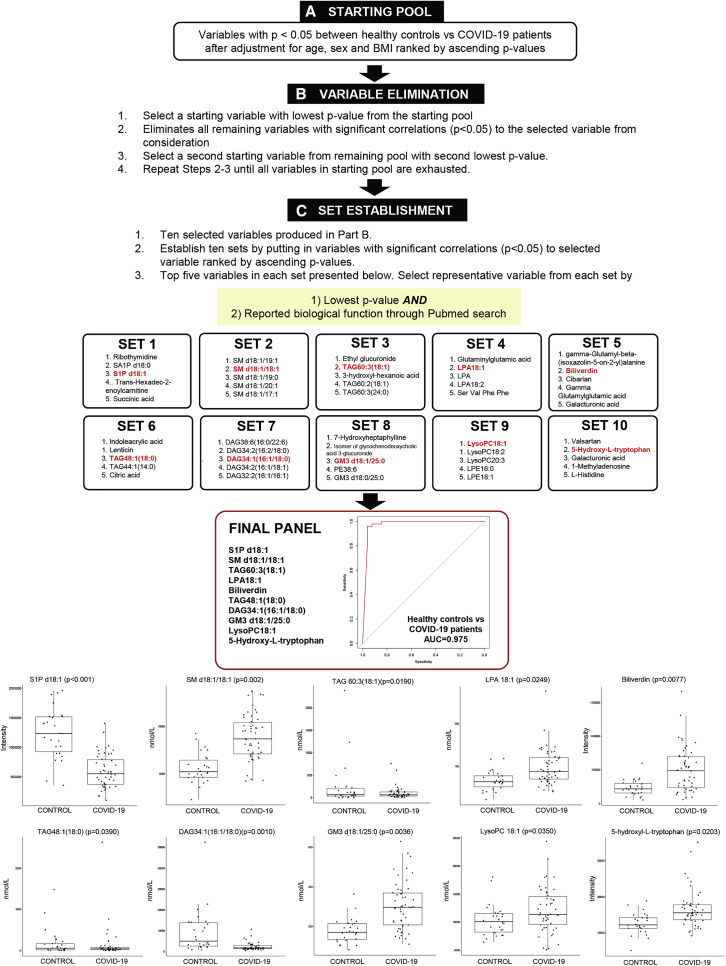
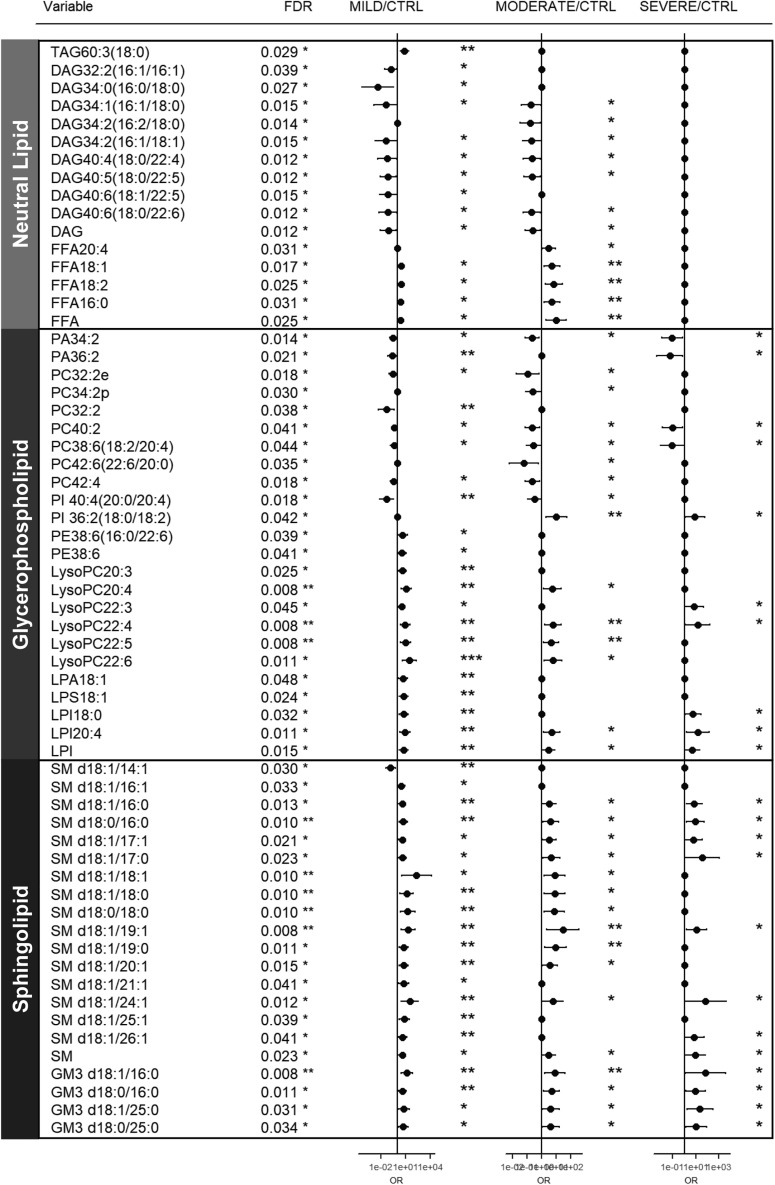
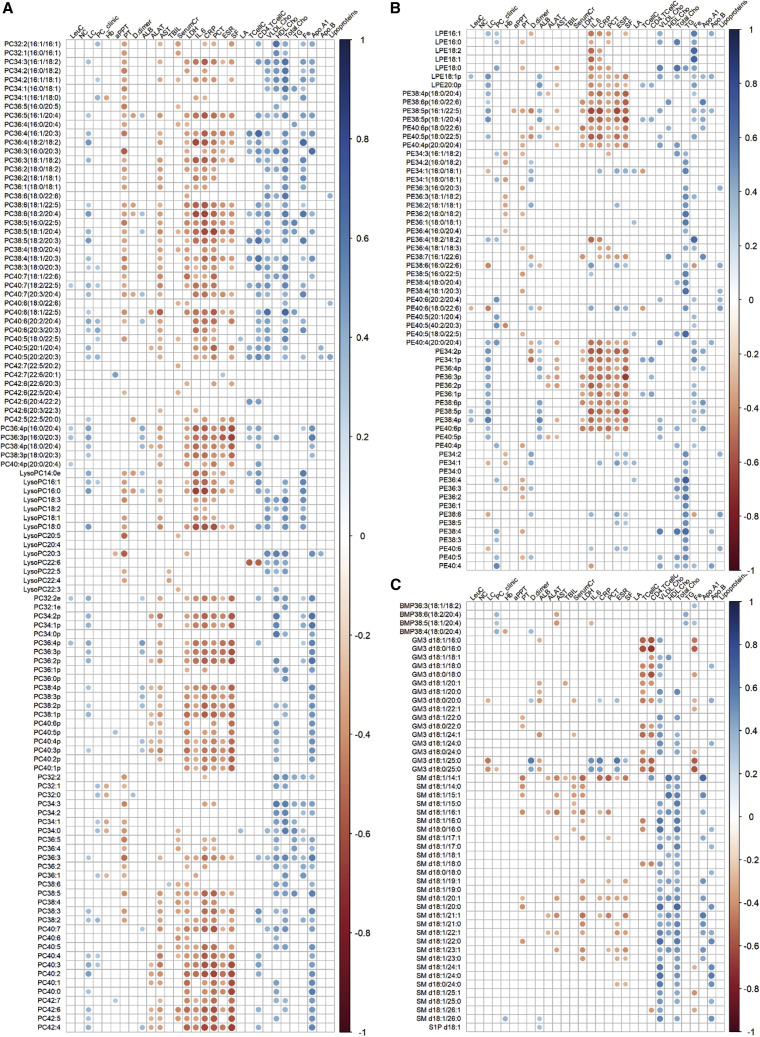
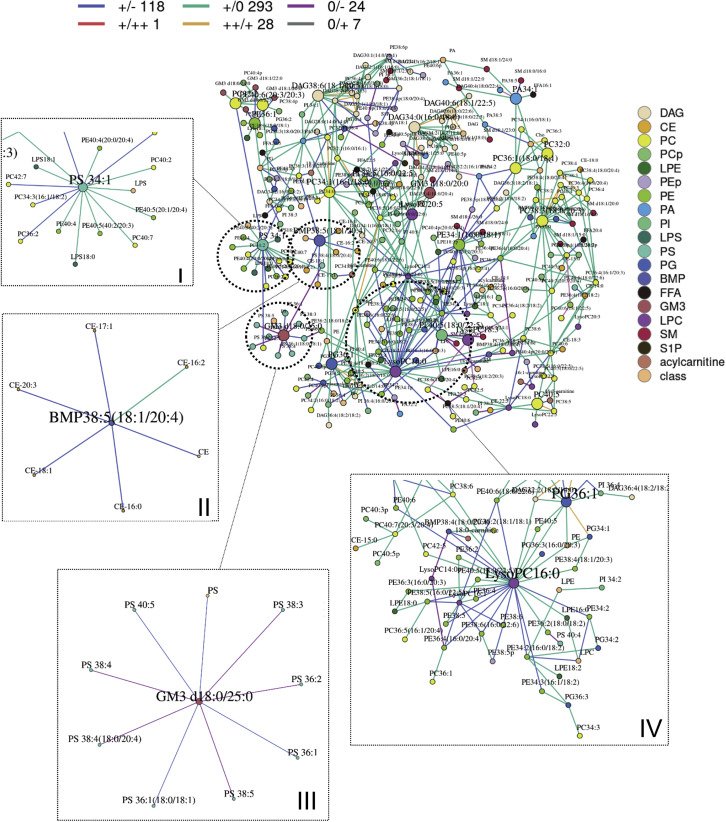
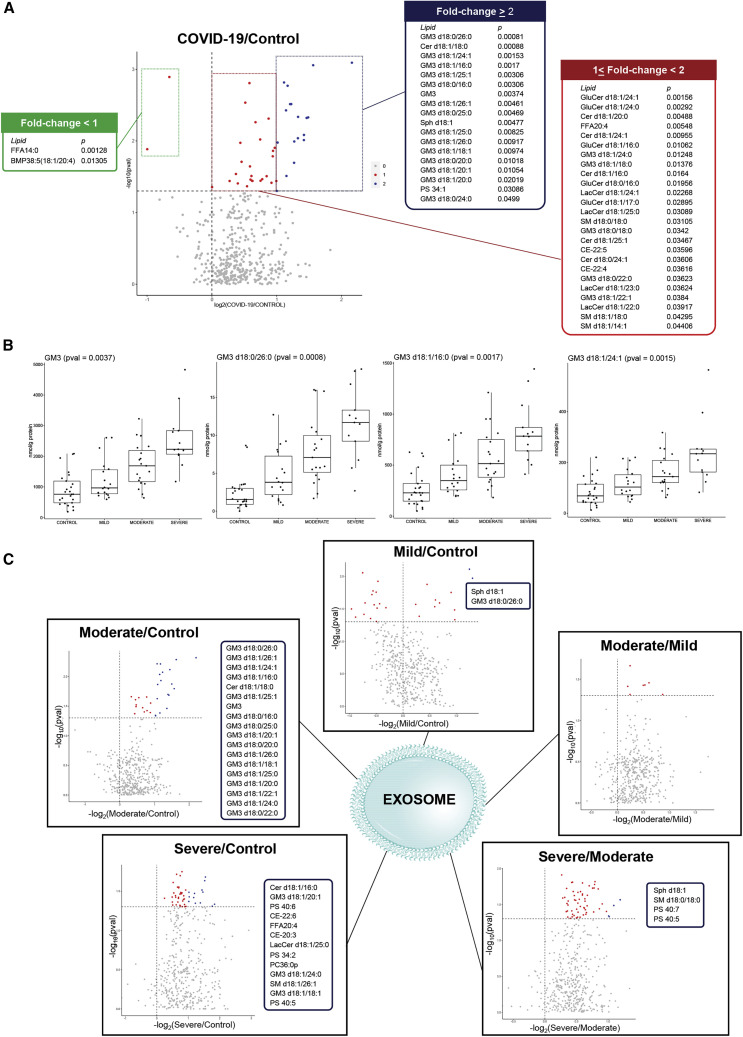
The coronavirus disease 2019 (COVID-19) pandemic presents an unprecedented threat to global public health. Herein, we utilized a combination of targeted and untargeted tandem mass spectrometry to analyze the plasma lipidome and metabolome in mild, moderate, and severe COVID-19 patients and healthy controls. A panel of 10 plasma metabolites effectively distinguished COVID-19 patients from healthy controls (AUC = 0.975). Plasma lipidome of COVID-19 resembled that of monosialodihexosyl ganglioside (GM3)-enriched exosomes, with enhanced levels of sphingomyelins (SMs) and GM3s, and reduced diacylglycerols (DAGs). Systems evaluation of metabolic dysregulation in COVID-19 was performed using multiscale embedded differential correlation network analyses. Using exosomes isolated from the same cohort, we demonstrated that exosomes of COVID-19 patients with elevating disease severity were increasingly enriched in GM3s. Our work suggests that GM3-enriched exosomes may partake in pathological processes related to COVID-19 pathogenesis and presents the largest repository on the plasma lipidome and metabolome distinct to COVID-19.

Keywords: COVID-19; biomarker; bis(monoacylglyero)phosphates; exosomes; lipidomics; metabolomics; monosialodihexosyl gangliosides; phosphatidylserines.


Conflict of interest statement

Declaration of Interests S.M.L., G.H.C., and B.L. are employees of LipidALL Technologies.

Figures

None
Graphical abstract
Figure 1
Figure 1
Plasma Panel for Differentiating COVID-19 Patients from Heathy Controls Overview of selection scheme for plasma metabolite panel to differentiate COVID-19 (n = 50) patients from healthy controls (n = 26). (A) From a total of 1,002 variables measured (598 lipids and 404 polar metabolites), variables with p < 0.05 between healthy controls and COVID-19 patients after adjustment for age, sex, and BMI were sieved out to form a starting pool comprising 322 variables. (B) A starting variable with the lowest p value was selected, and variables with significant correlations (p < 0.05) to the starting variable selected were removed from consideration. From remaining variables in the starting pool, the next starting variable with the second lowest p value was identified, and the process was repeated in an iterative fashion until all variables in the starting pool were exhausted. This process generated a list of ten variables. (C) Variables with significant correlations (p < 0.05) to each of the selected variables were added together to form ten established sets. To select a representative variable from each established set, the variable with the smallest p value and with reported biological function from a Pubmed search was chosen. A final panel of ten plasma metabolites, including S1P d18:1, SM d18:1/18:1, TAG60:3(18:1), LPA 18:1, biliverdin, TAG 48:1(18:0), DAG34:1(16:1/18:0), GM3 d18:1/25:0, lysoPC18:1, and 5-hydroxy-L-tryptophan, was generated, which distinguished between healthy controls and COVID-19 patients with an area under the curve (AUC) = 0.975 in a logistic regression model with leave-one-out (LOO) cross-validation. Boxplots for the ten selected metabolites in the final panel were illustrated and p values were indicated on top of each boxplot. Levels of polar metabolites measured using untargeted metabolomics were presented as corrected intensities, and lipids quantitated using targeted lipidomics were presented in nanomoles of lipids per liter (nmol/L) plasma. See also Figures S2–S4.
Figure 2
Figure 2
Plasma Lipids Associated with Severity of COVID-19 Logistic regression model with covariates BMI, age, and sex was built with each lipid to search for significant variables that could predict disease severity of subjects (i.e., healthy control, and mild, moderate, and severe COVID-19). Only lipids with false discovery rate (FDR) <0.05 were shortlisted and presented. Forest plots illustrate the magnitude of odds ratios with indicator of significance of the estimate in the model; ∗∗∗p < 0.001, ∗∗p < 0.01, p < 0.05. For non-significant lipids, the estimates were plotted as zeros. Lipids were broadly classified according to major classes of neutral lipids, glycerophospholipids, and sphingolipids. See also Figure S4.
Figure 3
Figure 3
Correlation of Plasma Lipids with Clinical Indices Correlation plots illustrate spearman correlations between clinical indices with phosphatidylcholines (PC) (A), phosphatidylethanolamines (PE) (B), and multivesicular body-related lipids including bis(monoacylglyero)phosphate (BMPs), monosialodihexosyl gangliosides (GM3), and sphingomyelins (SMs) (C). Only correlations with p < 0.05 were indicated with colored circles. Negative correlations were shown in red and positive correlations were shown in blue, with sizes of circles representing the magnitude of the correlations. LeuC, leukocyte count; NC, neutrophil count; LC, lymphocyte count; PC_clinic, platelet count; Hb, hemoglobin; aPPT, activated partial thromboplastin time; PT, prothrombin time; D.dimer, D-dimer; ALB, albumin; ALAT, alanine aminotransferase; AST, aspartate aminotransferase; TBIL, total bilirubin; Serum Cr, serum creatinine; LDH, lactate dehydrogenase; IL.6, interleukin-6; CRP, C-reactive protein; PCT, procalcitonin; ESR, erythrocyte sedimentation rate; SF, serum ferritin; LA, lactic acid; TCellC, T cell count; CD4.TCellC, CD4+ T cell count; VLDL-Cho, very low-density lipoprotein cholesterol; HDLCho, high-density lipoprotein cholesterol; total cho, total cholesterol; TG, triglycerides; Fe, iron; ApoA1, apolipoprotein A1; ApoB, apolipoprotein B.
Figure 4
Figure 4
Differential Correlation Analyses of Plasma Lipids in Mild COVID-19 Relative to Healthy Controls Multiscale embedded correlation network analysis illustrates the differential correlation of lipids in mild COVID-19 relative to healthy controls to reveal changes in lipid metabolic pathways upon early stage of viral infection. Only lipid pairs with significant differential correlations (empirical p < 0.05) were included. Sign/sign indicates direction and strength of correlation in control/mild COVID-19, and number that follows indicates number of lipid pairs in the global networks exhibiting this pattern of change. For instance, red line +/++ 1 in the upper legend of the global networks indicates that correlation between two connected lipid pairs was positive (+) in controls, and the correlation became even more strongly positive (++) in mild COVID-19 patients, as defined by statistically significant (p < 0.05) increase in correlation coefficients between the lipid pair across the two conditions. A total of 1 lipid pair connected by red lines in the global network displayed this pattern of change (+/++). Blue line +/− : positive in controls → negative in mild COVID-19. Teal line +/0: positive in controls → insignificant in mild COVID-19. Gold line ++/+: strongly positive in controls → weaker positive in mild COVID-19. Purple line 0/−: insignificant correlation in controls → negative correlation in mild COVID-19. Gray line 0/+: insignificant correlation in controls → positive correlation in mild COVID-19. Four modules (I–IV) of biological interest were circled and expanded for better visual clarity. (I) Module with hub PS 34:1 connected to numerous PEs by teal lines, indicating PS-PE positive correlations in healthy controls were lost in mild COVID-19. (II) Module with hub BMP 38:5(18:1/20:4) connected to CEs by blue lines, indicating BMP-CE correlations became negative in mild COVID-19. (III) Module with GM3 d18:0/25:0 as hub connected to several PSs by blue and purple lines, indicating GM3-PS correlations became negative in mild COVID-19. (IV) Module with LysoPC 16:1 as the hub connected to numerous PUFA-PEs by blue lines, indicating lysoPC-PUFA-PE correlations changed from positive in healthy controls to negative in mild COVID-19. PS, phosphatidylserines; PE, phosphatidylethanolamines; BMP, bis(monoacylglycero)phosphates; CE, cholesteryl esters; GM3, monosiaolodihexosyl gangliosides; PUFA-PE, polyunsaturated PEs.
Figure 5
Figure 5
Lipid Changes in Exosomes of COVID-19 Patients (A) Lipid changes in isolated exosomes from plasma of healthy controls (n = 25) and COVID-19 patients (n = 50). Colored dots (blue and red) in volcano plot indicate lipids that were significantly different (p < 0.05) between healthy controls and COVID-19 patients. Blue dots indicate significant lipids with fold change ≥ 2 in COVID-19 patients relative to controls listed in the blue panel, while red dots indicate significant lipids with fold change < 2 in patients relative to controls (listed in red and green panels). Lipids on the right side of vertical line at x = 0 were increased in COVID-19 patients compared to controls (blue and red panels), and lipids on the left side were decreased in COVID-19 patients compared to controls (green panel). (B) Boxplots illustrate sum of all GM3s (p = 0.0037), and three representatives, GM3 d18:0/26:0 (p = 0.0008), GM3 d18:1/16:0 (p = 0.0017), and GM3 d18:1/24:1 (p = 0.0015), that displayed increasing trends in isolated exosomes from healthy controls to COVID-19 patients of increasing severity. Exosome lipids were expressed in nanomoles of lipids per gram of total protein (nmol/g protein). (C) Volcano plots illustrate exosome lipids that were significantly different (p < 0.05) in pairwise comparisons indicated on top of each plot. Dots corresponding to significant lipids (p < 0.05) were colored (blue and red), and lipids with fold change ≥ 2 were colored blue and listed in the blue panel accompanying each volcano plot, while lipids with fold change < 2 were colored red. See also Figure S5.

References

    1. Baez J.M., Barbour S.E., Cohen D.E. Phosphatidylcholine transfer protein promotes apolipoprotein A-I-mediated lipid efflux in Chinese hamster ovary cells. J. Biol. Chem. 2002;277:6198–6206. - PubMed
    1. Baranano D.E., Rao M., Ferris C.D., Snyder S.H. Biliverdin reductase: a major physiologic cytoprotectant. Proc. Natl. Acad. Sci. USA. 2002;99:16093–16098. - PMC - PubMed
    1. Bhowmick R., Clark S., Bonventre J.V., Leong J.M., McCormick B.A. Cytosolic phospholipase A2α promotes pulmonary inflammation and systemic disease during Streptococcus pneumoniae infection. Infect. Immun. 2017;85 e00280-17. - PMC - PubMed
    1. Bley H., Schöbel A., Herker E. Whole lotta lipids-from HCV RNA replication to the mature viral particle. Int. J. Mol. Sci. 2020;21:2888. - PMC - PubMed
    1. Brügger B., Glass B., Haberkant P., Leibrecht I., Wieland F.T., Kräusslich H.G. The HIV lipidome: a raft with an unusual composition. Proc. Natl. Acad. Sci. USA. 2006;103:2641–2646. - PMC - PubMed

Publication types

MeSH terms