. 2020 Jun 30;31(13):107828.
doi: 10.1016/j.celrep.2020.107828.

Angiocrine Sphingosine-1-Phosphate Activation of S1PR2-YAP Signaling Axis in Alveolar Type II Cells Is Essential for Lung Repair

Affiliations

Angiocrine Sphingosine-1-Phosphate Activation of S1PR2-YAP Signaling Axis in Alveolar Type II Cells Is Essential for Lung Repair

Qian Chen et al. Cell Rep. .

Abstract

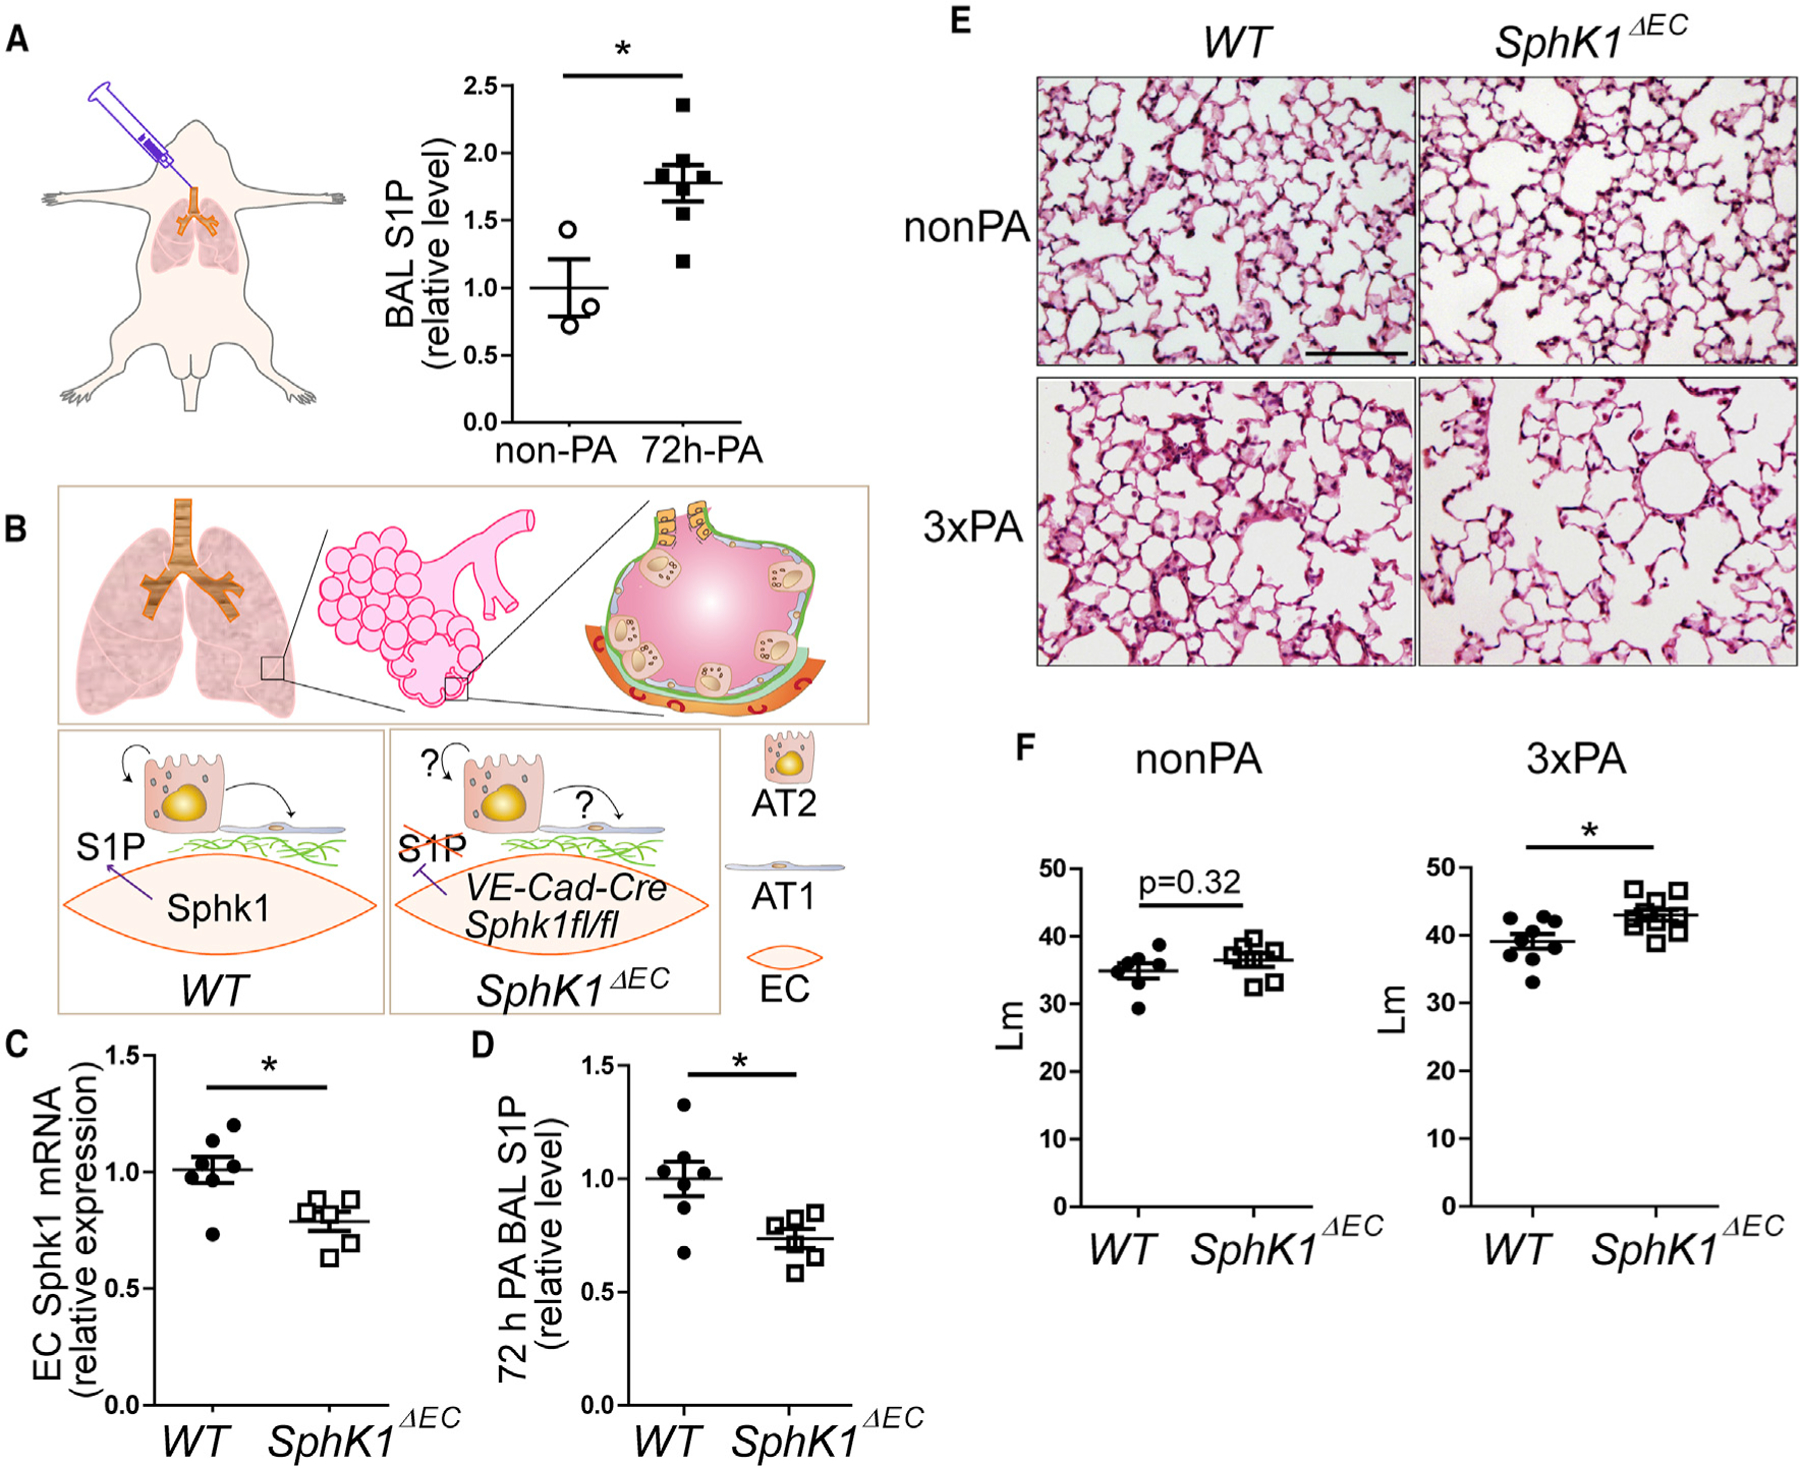
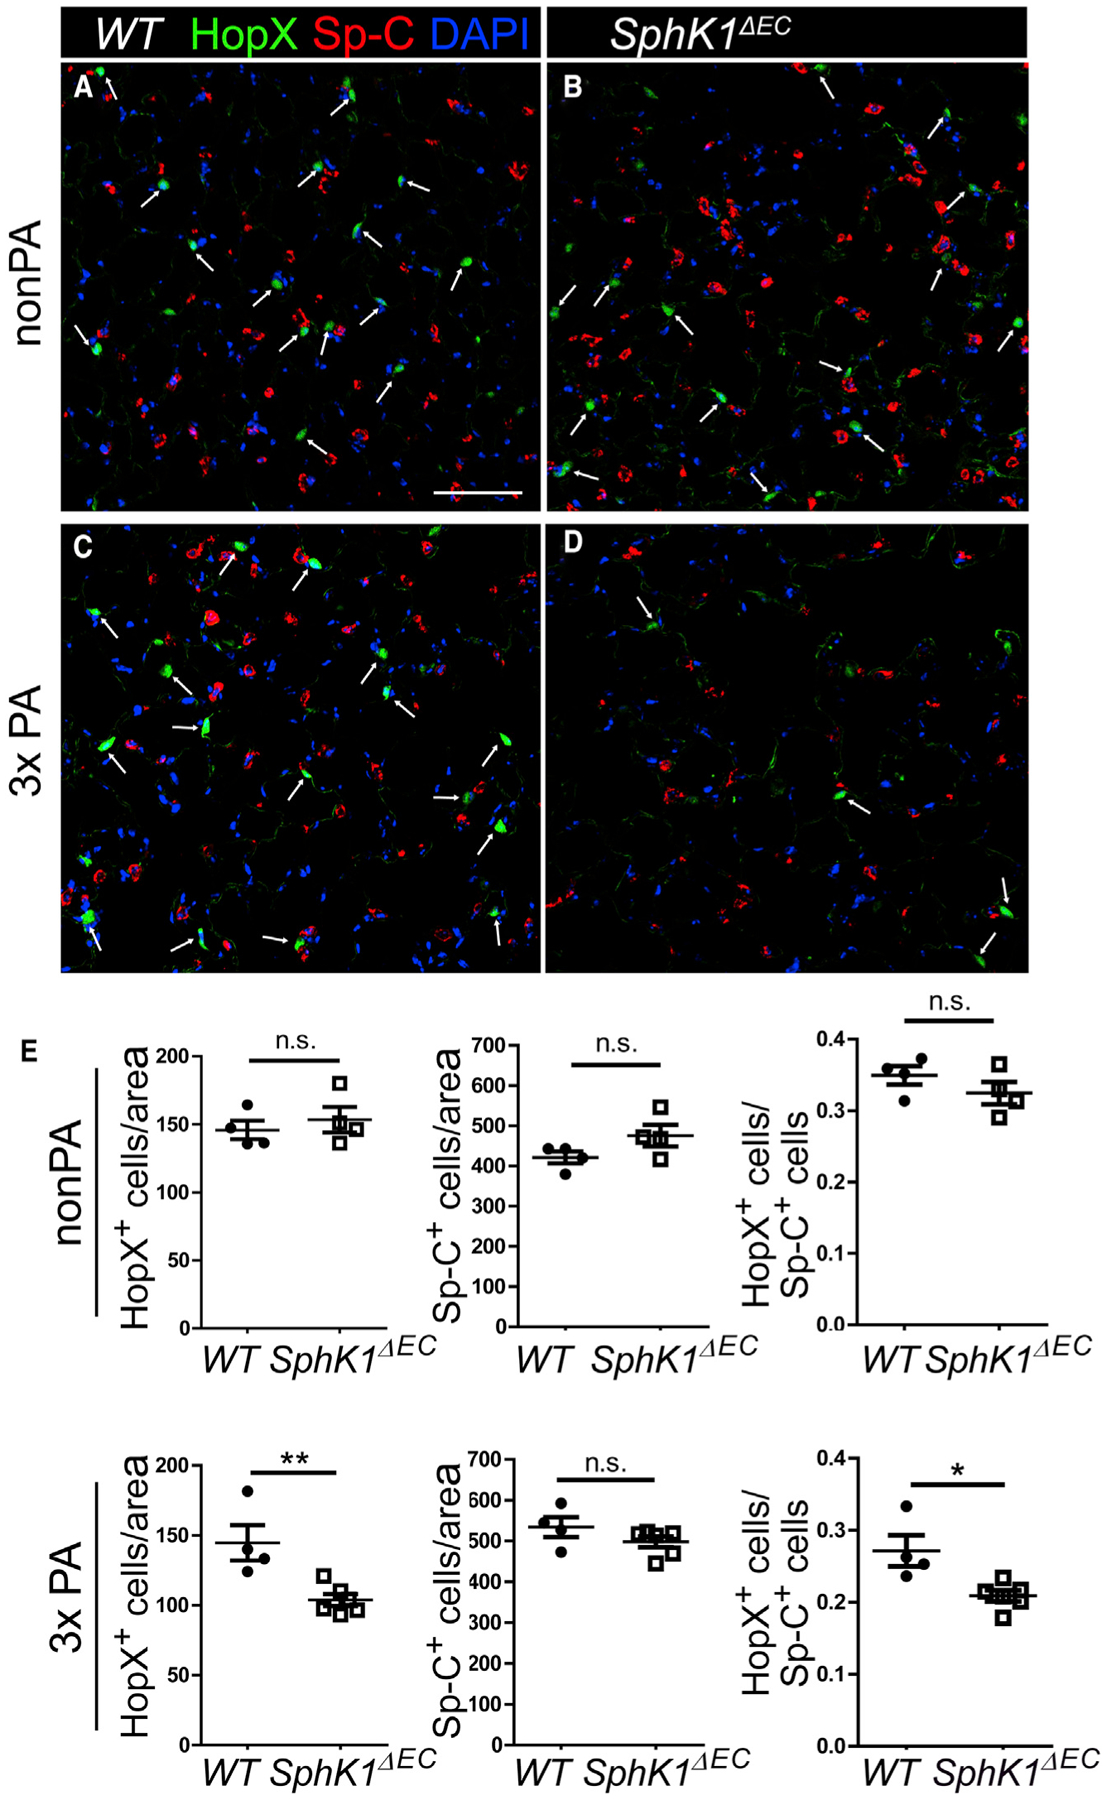
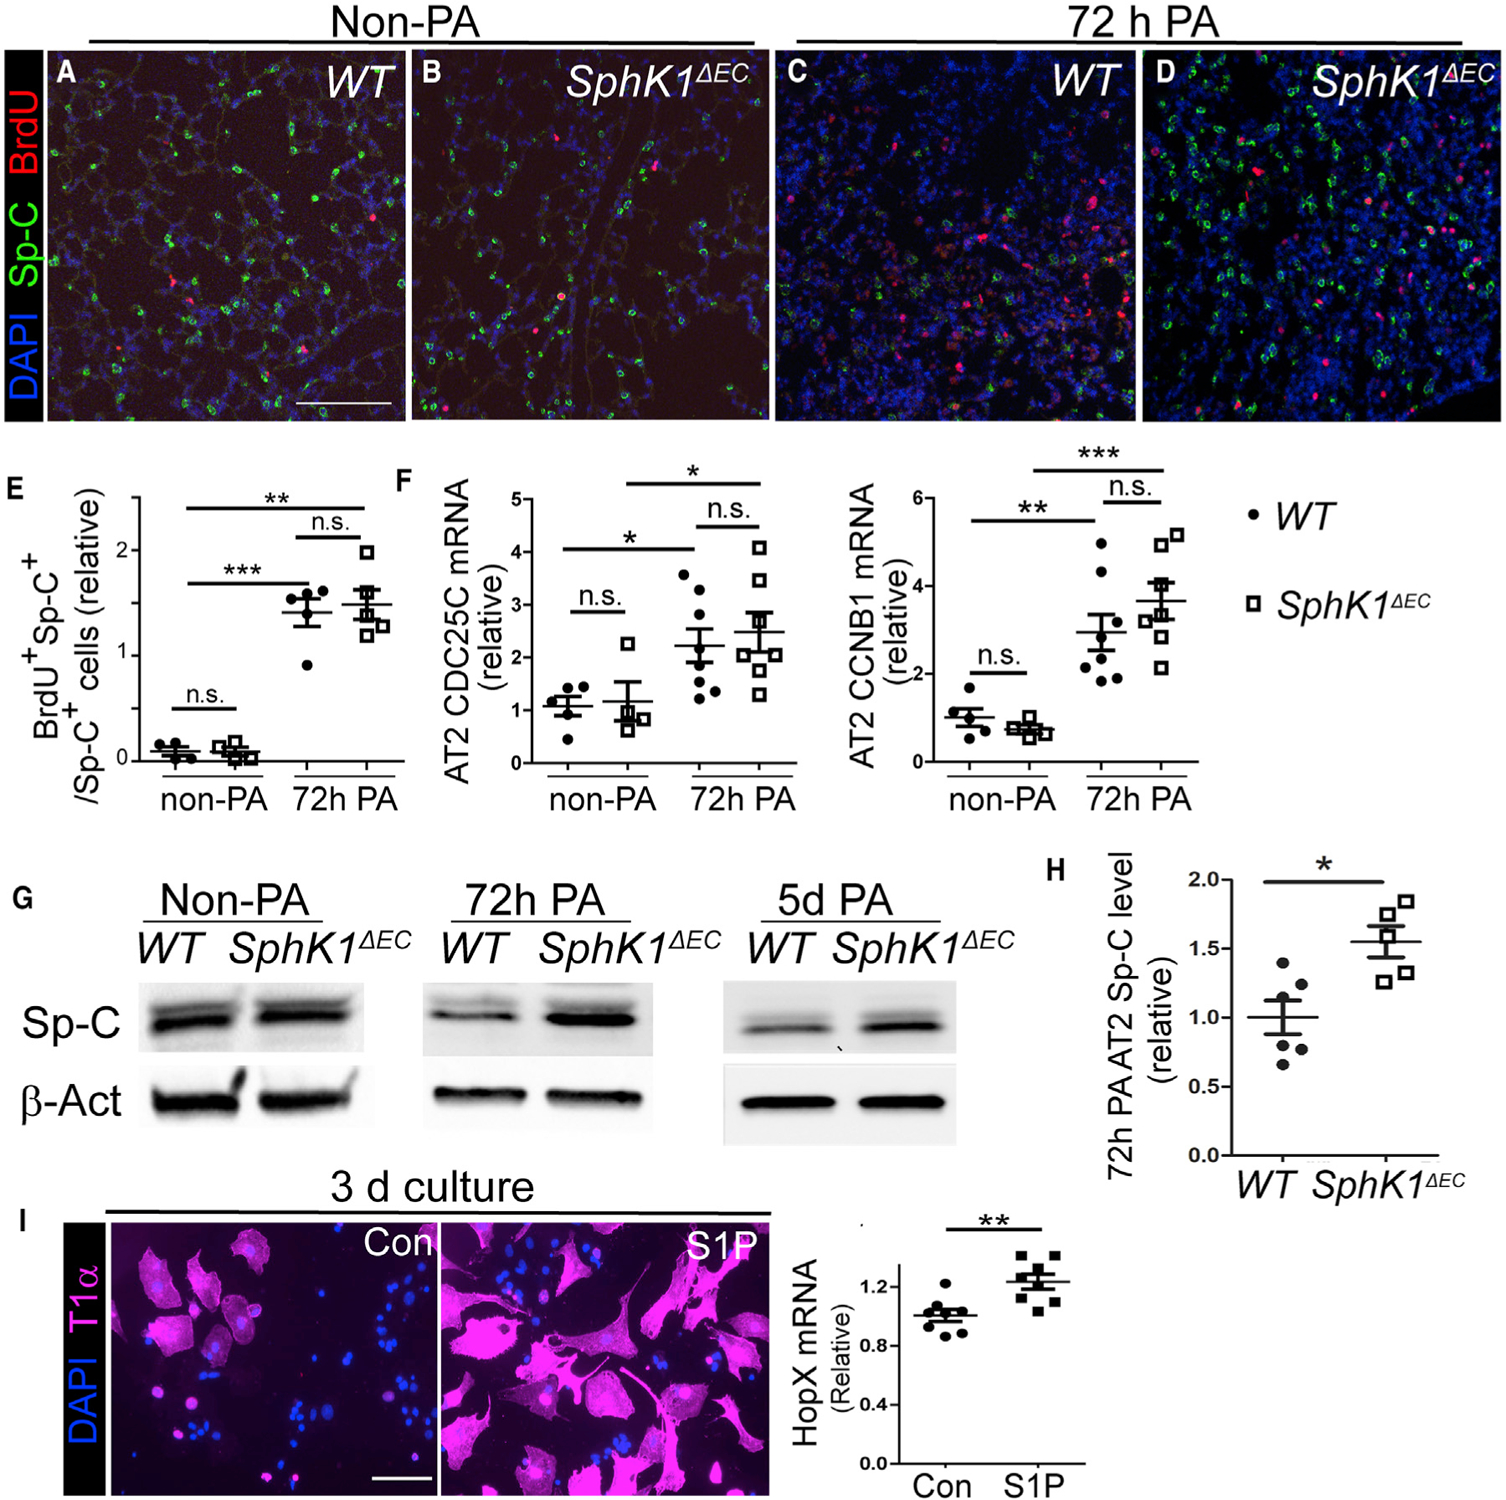
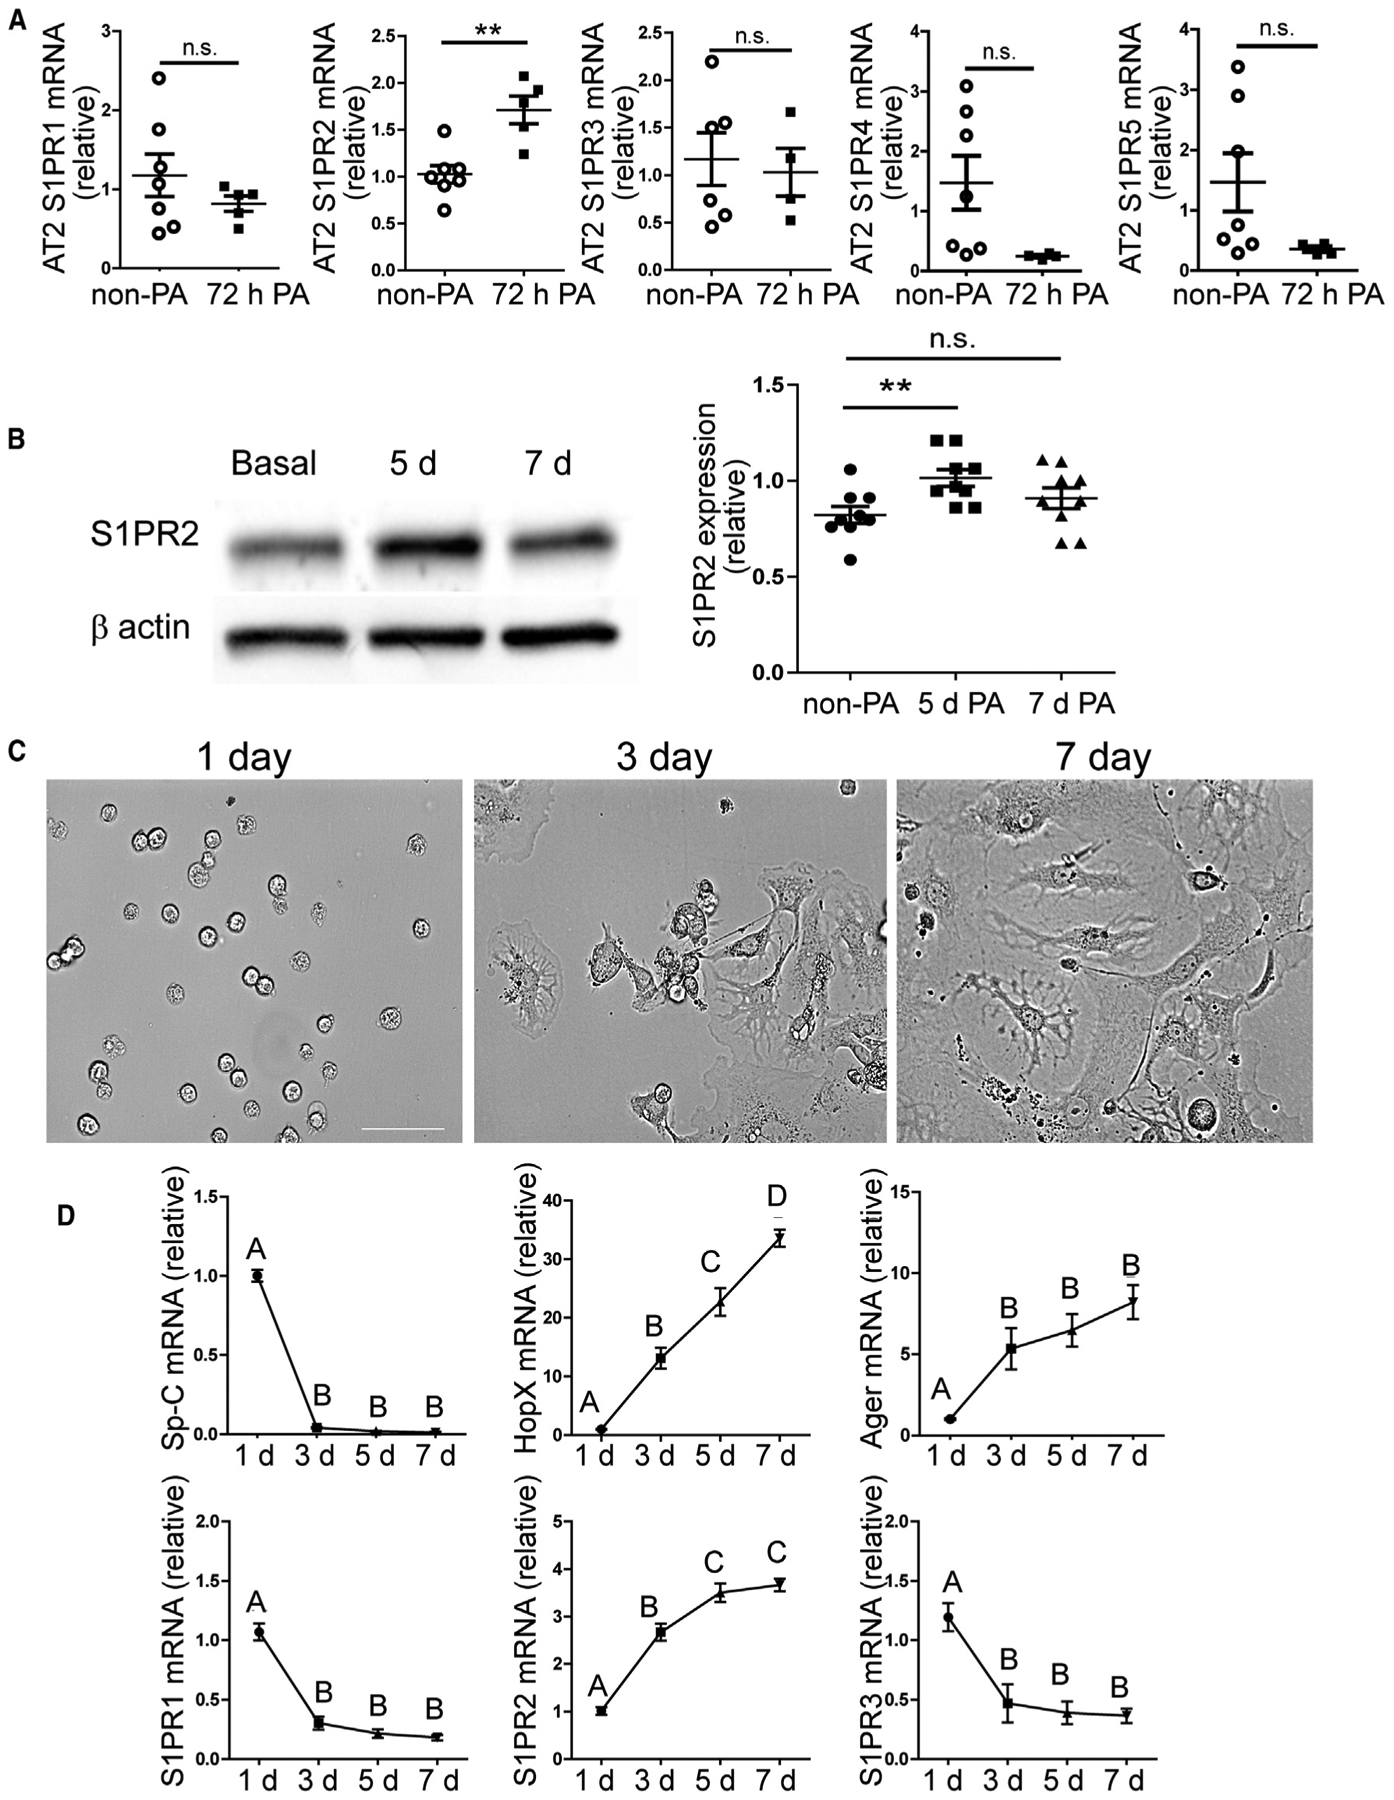
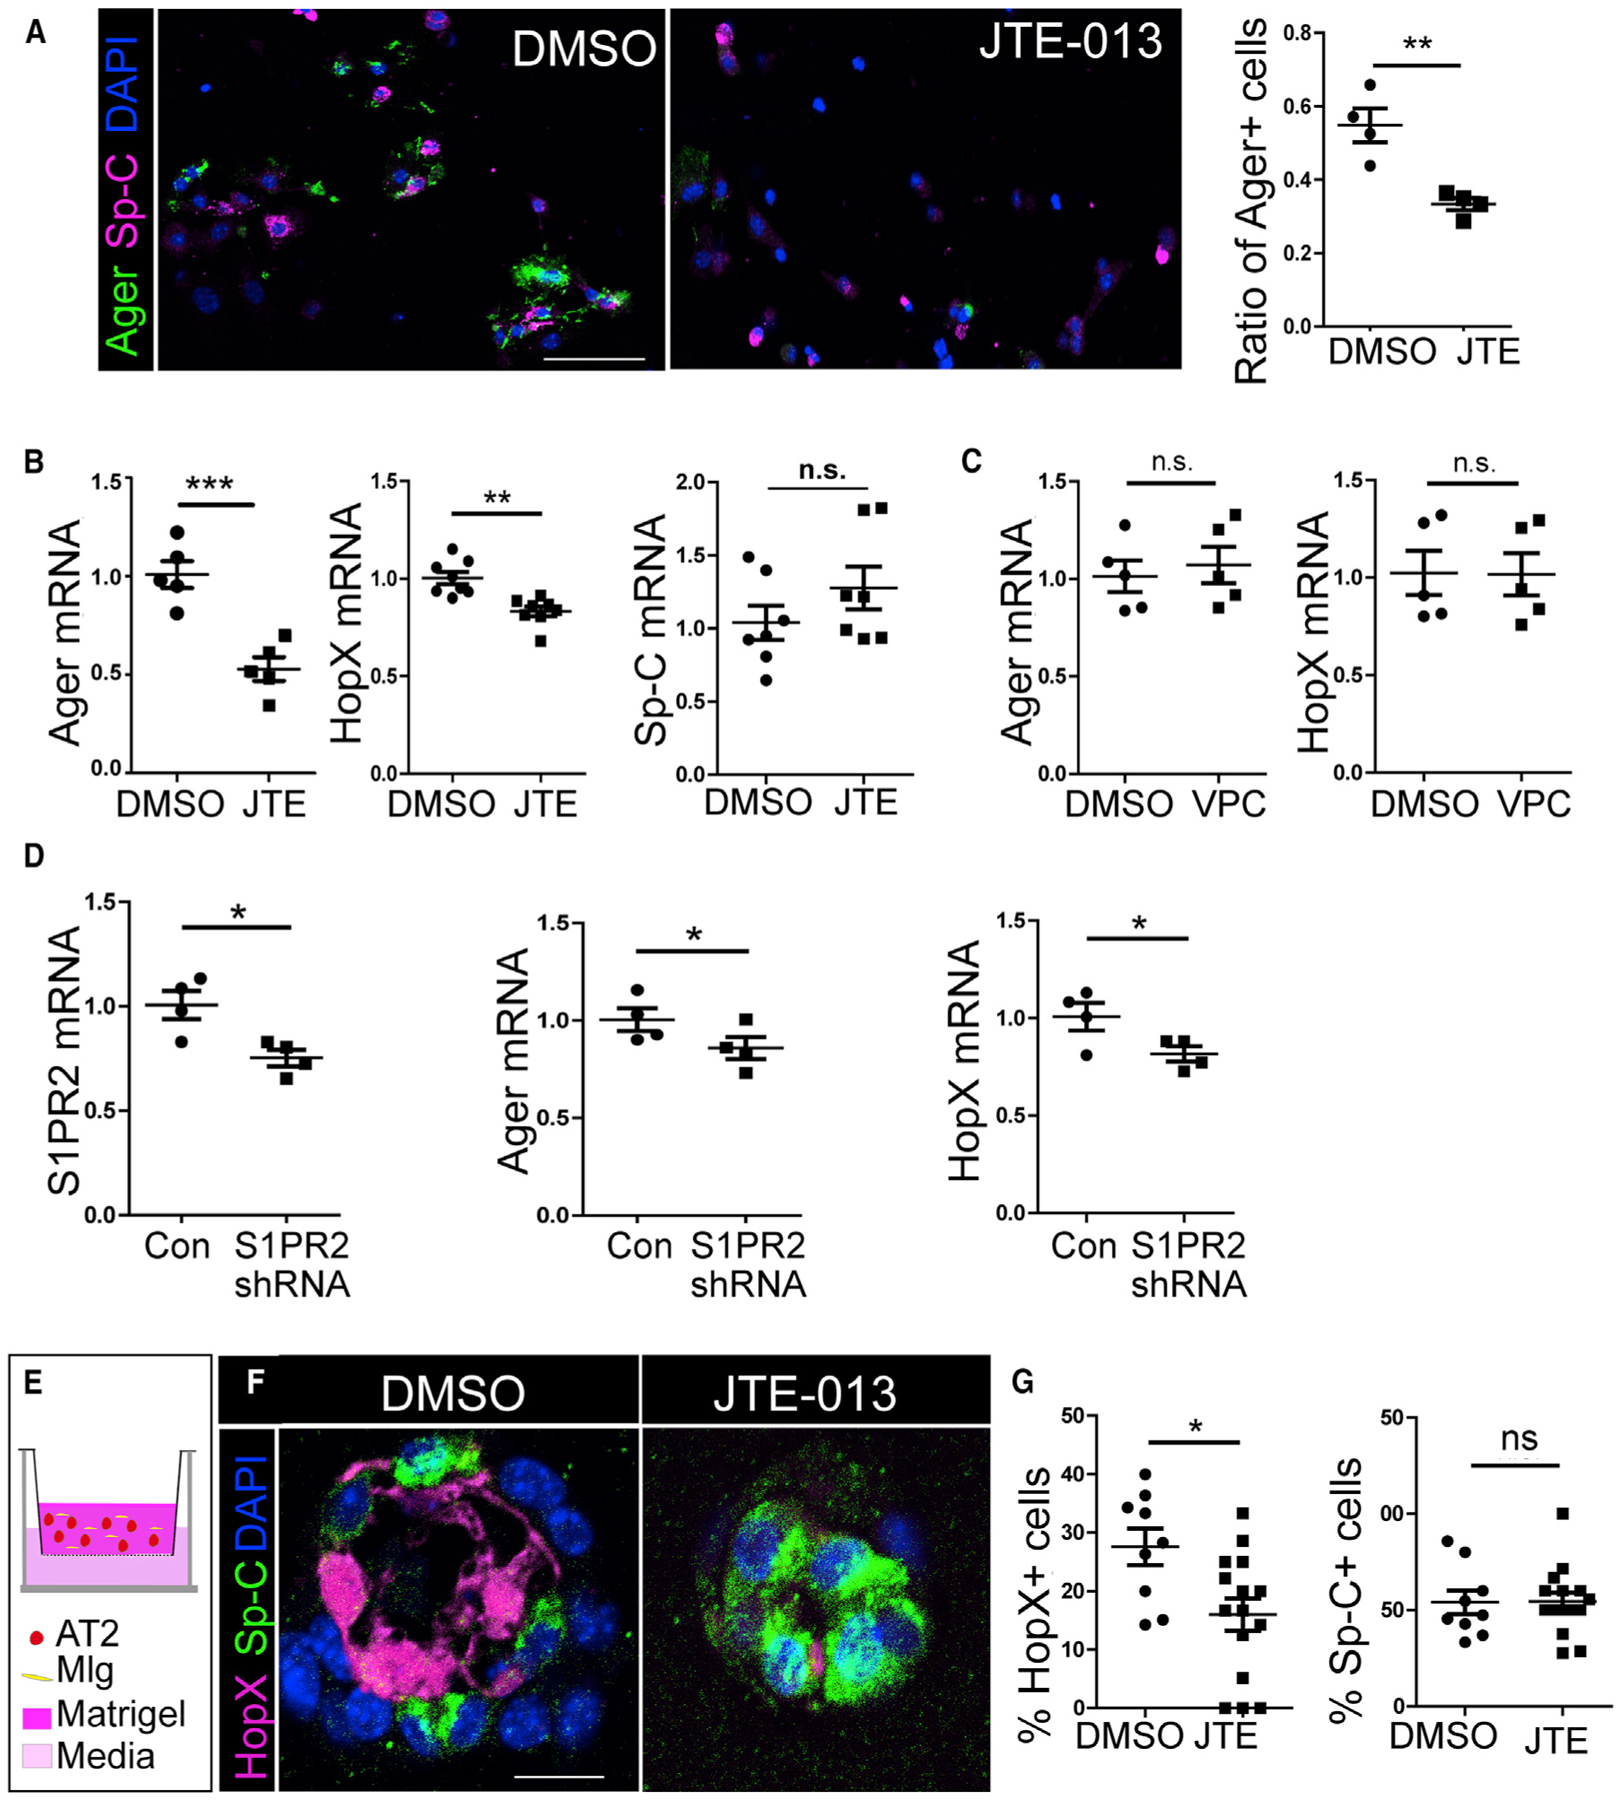
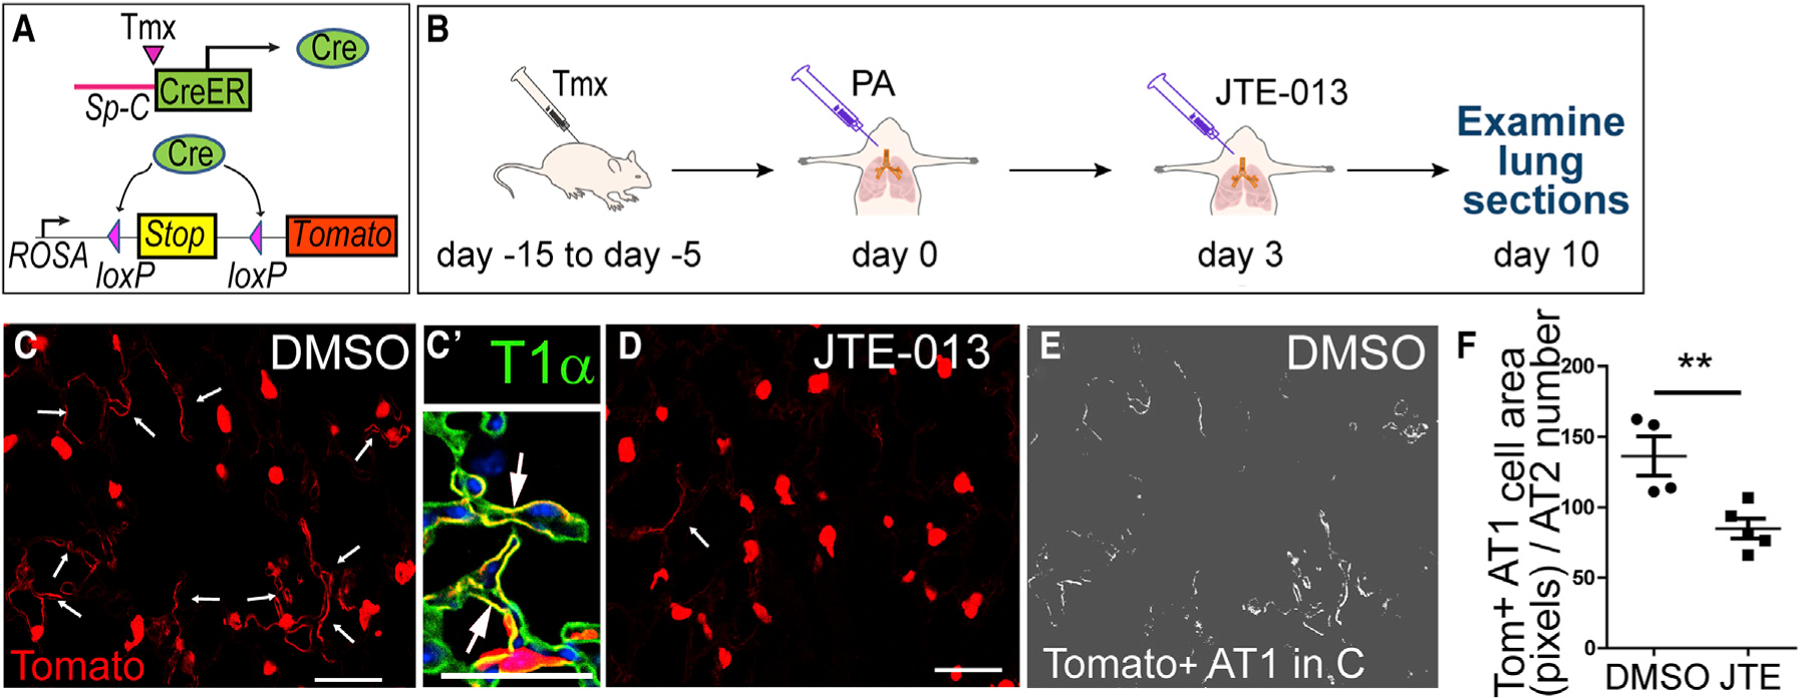
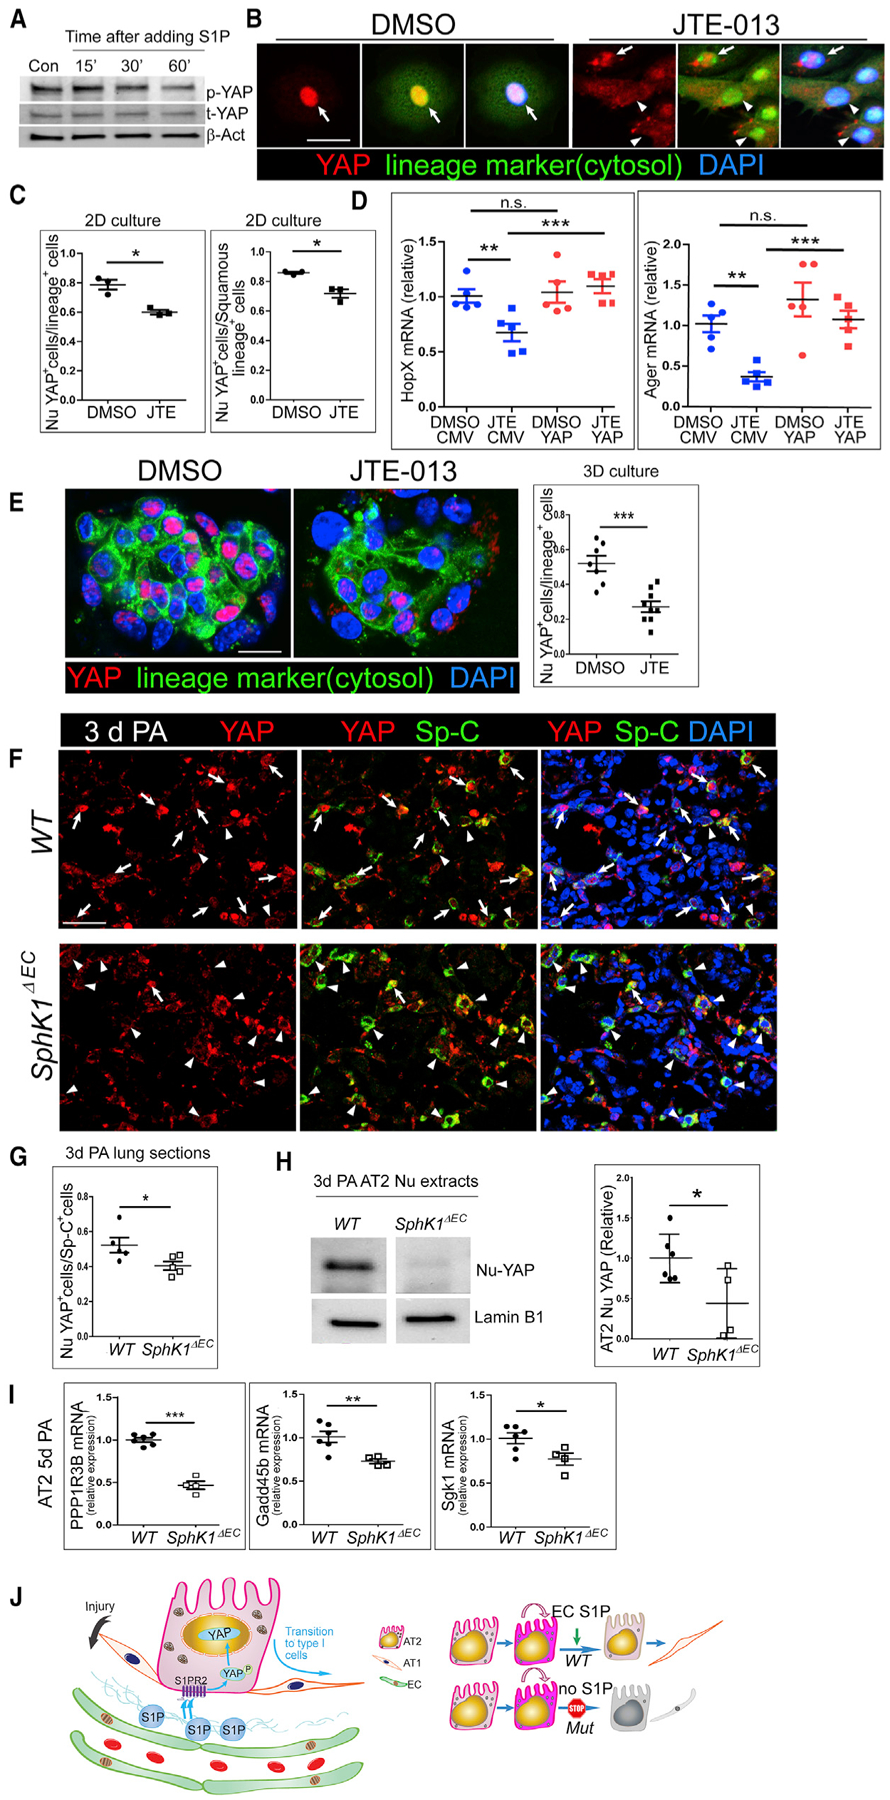
Lung alveolar epithelium is composed of alveolar type I (AT1) and type II (AT2) cells. AT1 cells mediate gas exchange, whereas AT2 cells act as progenitor cells to repair injured alveoli. Lung microvascular endothelial cells (LMVECs) play a crucial but still poorly understood role in regulating alveolar repair. Here, we studied the role of the LMVEC-derived bioactive lipid sphingosine-1-phosphate (S1P) in promoting alveolar repair using mice with endothelial-specific deletion of sphingosine kinase 1 (Sphk1), the key enzyme promoting S1P generation. These mutant lungs developed airspace-enlargement lesions and exhibited a reduced number of AT1 cells after Pseudomonas-aeruginosa-induced lung injury. We demonstrated that S1P released by LMVECs acted via its receptor, S1PR2, on AT2 cells and induced nuclear translocation of yes-associated protein (YAP), a regulator of AT2 to AT1 transition. Thus, angiocrine S1P released after injury acts via the S1PR2-YAP signaling axis on AT2 cells to promote AT2 to AT1 differentiation required for alveolar repair.

Keywords: S1P; alveoli; endothelial; lung; niche; repair; type II cells.


Conflict of interest statement

Declaration of Interests The authors declare no competing interests.

Figures

Figure 1.
Figure 1.. Endothelial-Specific Disruption of S1P Production Resulted in an Airspace-Enlargement Phenotype in Mice after PA Injury
(A) Acute lung injury was induced by intratracheal (i.t.) injection of PA bacteria. BAL fluids were collected from uninjured and 72-h-post-injured lungs, S1P levels in the BAL were measured using LC-mass spectrometry. (B) Lung alveoli are highly vascularized, with epithelial AT1 and AT2 cells residing closely to endothelial cells. To test the potential function of angiocrine S1P on AT2 cell progenitor function, we created VE-Cadherin-Cre/Sphk1fl/fl mice (SphK1ΔEC), in which Sphk1 expression was specifically disrupted in ECs. (C) Sphk1 expression in ECs isolated from non-PA-treated WT and SphK1ΔEC mice was analyzed by qPCR. (D) S1P levels in BAL were measured in WT and SphK1ΔEC mice at 72 h post-PA. (E) Representative images of HE-stained lung sections of WT and SphK1ΔEC mice without injury (non-PA) or 7 days after the last injection of three repetitive PA injuries at 1-week intervals (33 PA). Scale bar, 100 μm. (F) Mean linear intercept (Lm) were measured from HE-stained lung sections. Mean ± SEM. *p < 0.05. See also Figure S1
Figure 2.
Figure 2.. SphK1ΔEC Mice Had Fewer AT1 Cells Than WT after PA
(A–D) Lung sections from uninjured or 33 PA injured WT and SphK1ΔEC mice were stained for Sp-C and HopX. Without injury (A and B), the numbers of HopX+ cells (arrow) were similar between WT (A) and SphK1ΔEC (B) lungs. After 3x PA injury (C and D), more HopX+ AT1 were present in WT (C) than SphK1ΔEC (D) lungs. Scale bar, 100 μm. (E) The numbers of HopX+ and Sp-C+ cells were counted and normalized by area, and the ratios of HopX+ to Sp-C+ cells were calculated. Mean ± SEM. *p < 0.05; **p < 0.01. n.s., not significant. See also Figures S2 and S3.
Figure 3.
Figure 3.. AT2 Cells Failed to Downregulate Sp-C Expression in SphK1ΔEC Mice after PA
(A–D) Non-PA (A and B) and 72-h-post-PA (C and D) lung sections from WT (A and C) and SphK1ΔEC (B and D) mice were stained for Sp-C and BrdU. Images were taken randomly on non-PA lungs and at areas showing signs of pneumonia on injured lungs. Scale bar, 100 μm. Images are representative of 4–5 lungs for each genotype and condition. The number of Sp-C+BrdU+ cells were similar between WT and SphK1ΔEC without PA (A and B) or at 72-h-post-PA (C and D). In WT, Sp-C expression was reduced at 72-h-post-PA injury (C) compared with non-PA (A). Less reduction was detected in SphK1ΔEC comparing post PA (D) with non-PA (B). (E) Percentage of BrdU+ AT2 cells that were quantified from lung sections stained with anti-BrdU and Sp-C antibodies. (F) qPCR of CDC25C and CCNB1 expression in AT2 cells isolated from non-PA and 72-h-post-PA lungs of WT and SphK1ΔEC mice. (G) AT2 cells were isolated from non-PA, 72-h-post-PA, and 5-day-post-PA lungs of WT and SphK1ΔEC mice and subjected to western blotting analysis for Sp-C. (H) AT2 cell Sp-C levels normalized by b-actin were compared between WT and SphK1ΔEC at 72 h post-PA. (I) Freshly isolated AT2 cells were cultured for 3 days and treated with 1 μM S1P or vehicle control. T1α expression in cells was assessed by immunostaining, and HopX expression was assessed by qPCR. Scale bar, 50 μm. Mean ± SEM. *p < 0.05; **p < 0.01; ***p < 0.001; n.s., not significant. See also Figure S4.
Figure 4.
Figure 4.. S1PR2 Expression in AT2 Cells Was Increased during Alveolar Repair and AT2 to AT1 Cell Transition
(A) AT2 cells were isolated from uninjured and 72-h-post-injured WT mice, and the expression levels of the five S1P receptors were analyzed by qPCR. (B) WT AT2 cells isolated at indicated time points were subjected to western blotting analysis for S1PR2, and the S1PR2 levels normalized by β-actin were quantified. Mean ± SEM. **p < 0.01; n.s., not significant. (C and D) In 2D culture, freshly isolated WT AT2 cells gradually changed from cuboidal shape to AT1-like squamous morphology within 7 days (C), and gene expression levels in cultured cells were measured at indicated time points by qPCR (D). Scale bar (C), 50 μm. One-way ANOVA with Bonferroni correction was used to determine statistical differences. Groups labeled with different letters are significantly different. See also Figure S5.
Figure 5.
Figure 5.. Inhibition of S1PR2 Function Disrupted AT2 to AT1 Cell Transition In Vitro
(A) Lineage labeled AT2 cells (from SpC/Tomato mice) were cultured in vitro and treated with DMSO or 10 μM JTE-013. Cells were stained for Ager and Sp-C after 3 days of culture, and the percentage of Ager+ cells over all lineage labeled Tomato+ cells was quantified. For each independent experiment, 200–300 cells were scored. Scale bar, 50 μm. (B) AT2 cells were cultured for 3 days with DMSO or JTE-013, and expressions of Ager, HopX, and Sp-C were analyzed by qPCR. (C) AT2 cells cultured with VPC-23019 for 3 days did not show altered expression of Ager and HopX by qPCR analysis. (D) Freshly isolated AT2 cells were cultured with adenovirus expressing S1PR2 shRNA or vector control for 4 days. The expression of S1PR2, Ager, and HopX was analyzed by qPCR. (E) Lineage labeled AT2 cells were co-cultured with Mlg fibroblast cells in a 3D organoid culture. JTE-013 or DMSO was added to the medium. (F and G) After 14 days of culture, organoids were sectioned and stained for HopX and Sp-C (F), and the percentage of HopX+ and Sp-C+ cells over lineage labeled cells (Tomato+) in organoids were quantified (G). More than 200 cells from 10–15 organoids of each condition from two independent experiments were scored. Scale bar, 10 μm. Mean ± SEM. *p < 0.05; **p < 0.01; ***p < 0.001; n.s., not significant.
Figure 6.
Figure 6.. JTE-013 Inhibits AT2 to AT1 Cell Transition In Vivo
(A) Schematic of inducible AT2 cell lineage tracing mice SpC/Tomato. (B) Four Tmx injections were given to SpC/Tomato mice at 15 to 5 days before PA injury. JTE-013 or DMSO was i.t. injected into the lungs 3 days after PA, and the lungs were harvested on day 10 after the PA. (C and D) Lung sections were stained for Tomato to mark AT2 and AT2-derived cells. Fewer AT1-like Tomato+ cells (arrows) were detected in JTE-013-treated lungs (D) than control lungs (C). Scale bar, 30 μm. (C) Enlarged image of a representative lung section showing squamous Tomato+ cells (arrows) co-expressing T1α. Scale bar, 30 μm. (E and F) Pixel numbers of Tomato+AT1-like cells (E) were measured and normalized to the number of Tomato+ AT2 cells on the same section and plotted (F). Mean ± SEM. **p < 0.01. See also Figure S6.
Figure 7.
Figure 7.. YAP Is Downstream of S1P/S1PR2 Signaling in AT2 Cells
(A) Freshly isolated AT2 cells were cultured overnight and serum starved before treated with 1 μM S1P for the indicated times. Phospho-YAP and total YAP levels in cells were measured by western blot. (B) Lineage labeled AT2 cells (i.e., GFP+ cells from SpC CreER/ROSA-mTmG [SpC/mTmG] mice) were isolated and treated with 10 μM JTE-013 or DMSO in culture. Cells were stained for YAP after 3 days of culture. Arrows: nuclear YAP (nu-YAP). Arrowheads: cells with YAP presence in the cytosol. Scale bar, 20 μm. (C) The percentages of cells with nu-YAP localization among total lineage labeled cells and those among squamous lineage labeled cells were quantified in JTE-013-treated and control cells. More than 100 cells were scored for each condition in each of the three independent experiments. (D) DMSO and 10-μM JTE-013-treated cells were infected with adenovirus expressing YAP-5SA (YAP) or the vector control (CMV). Cells were collected after 3 days of culture, and expressions of HopX and Ager were analyzed by qPCR. (E) Lineage labeled (GFP+) AT2 cells were co-cultured with Mlg in a 3D organoid culture and treated with JTE-013 or DMSO. Organoids were sectioned and stained for YAP after 14 days of culture. Scale bar, 10 μm. The percentage of lineage labeled cells showing nu-YAP staining was quantified. More than 100 cells were scored for each condition in three independent experiments. (F) Lung sections of WT and SphK1ΔEC mice at 72 h post-PA were stained for YAP and Sp-C. Arrow, Nu-YAP; arrowheads, cytosolic YAP. Scale bar, 30 μm. (G) SphK1ΔEC lungs showed a lower percentage of cells with nu-YAP among the Sp-C+ cells compared with that of WT. For each lung, 5–10 microscopic areas were randomly selected from the regions indicating signs of pneumonia, and at least 100 AT2 cells were scored for each selected area. (H) Nuclear proteins were extracted from AT2 cells isolated from 72-h-post-PA lungs. The representative image shows protein samples run on the same blot. Relative YAP levels in the nucleus were quantified comparing with Lamin B1. (I) Ppp1r3b, Gadd45b, and Sgk1 expression in AT2 cells at 5 days post-PA was compared between WT and SphK1ΔEC by qPCR. Mean ± SEM. *p < 0.05; **p < 0.01; ***p < 0.001; n.s., not significant. (J) Schematic of a model for the role of angiocrine S1P in regulating the progenitor function of AT2 cells. In response to injury, S1P is secreted from ECs and acts through an S1PR2-YAP axis to promote AT2 to AT1 cell transition. In SphK1ΔEC mice, the angiocrine production of S1P is blocked, and AT2 cells proliferate normally but are unable to differentiate into AT1 cells. See also Figure S7.

References

    1. Barkauskas CE, Cronce MJ, Rackley CR, Bowie EJ, Keene DR, Stripp BR, Randell SH, Noble PW, and Hogan BL (2013). Type 2 alveolar cells are stem cells in adult lung. J. Clin. Invest 123, 3025–3036. - PMC - PubMed
    1. Berdyshev EV, Gorshkova I, Skobeleva A, Bittman R, Lu X, Dudek SM, Mirzapoiazova T, Garcia JG, and Natarajan V (2009). FTY720 inhibits ceramide synthases and up-regulates dihydrosphingosine 1-phosphate formation in human lung endothelial cells. J. Biol. Chem 284, 5467–5477. - PMC - PubMed
    1. Cao Z, Ye T, Sun Y, Ji G, Shido K, Chen Y, Luo L, Na F, Li X, Huang Z, et al. (2017). Targeting the vascular and perivascular niches as a regenerative therapy for lung and liver fibrosis. Sci. Trans. Med 9, eaai8710. - PMC - PubMed
    1. Chen Q, Suresh Kumar V, Finn J, Jiang D, Liang J, Zhao YY, and Liu Y (2017). CD44high alveolar type II cells show stem cell properties during steady-state alveolar homeostasis. Am. J. Physiol. Lung Cell. Mol. Physiol 313, L41–L51. - PMC - PubMed
    1. Cheng KT, Xiong S, Ye Z, Hong Z, Di A, Tsang KM, Gao X, An S, Mittal M, Vogel SM, et al. (2017). Caspase-11-mediated endothelial pyroptosis underlies endotoxemia-induced lung injury. J. Clin. Invest 127, 4124– 4135. - PMC - PubMed

Publication types

MeSH terms