Review
. 2020 Jun 29;12(7):1919.
doi: 10.3390/nu12071919.

A Comprehensive Critical Assessment of Increased Fruit and Vegetable Intake on Weight Loss in Women

Affiliations
Review

A Comprehensive Critical Assessment of Increased Fruit and Vegetable Intake on Weight Loss in Women

Mark L Dreher et al. Nutrients. .

Abstract

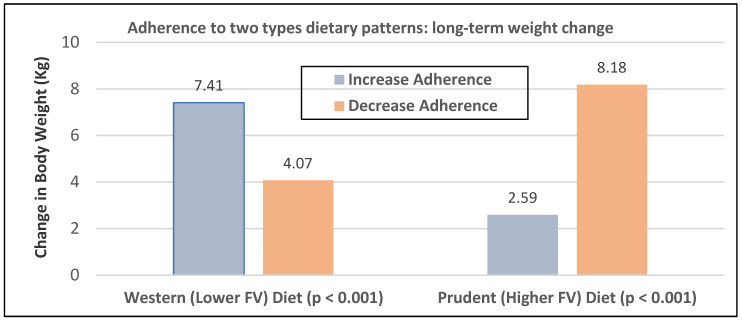
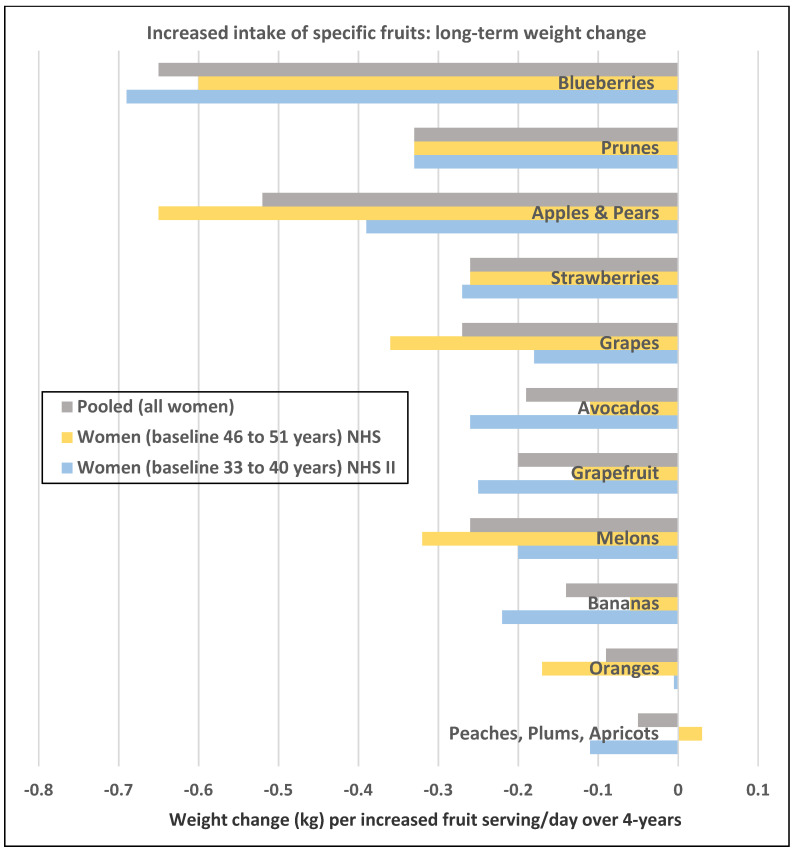
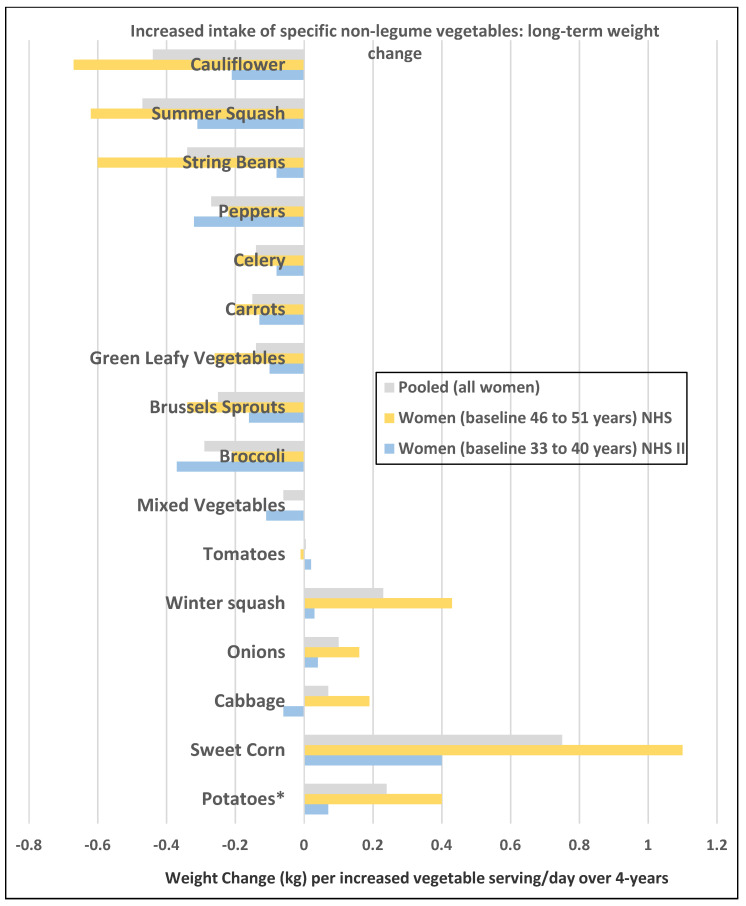
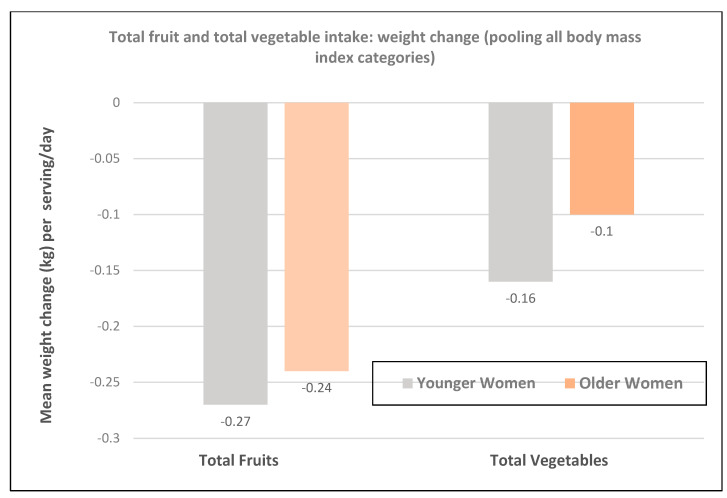
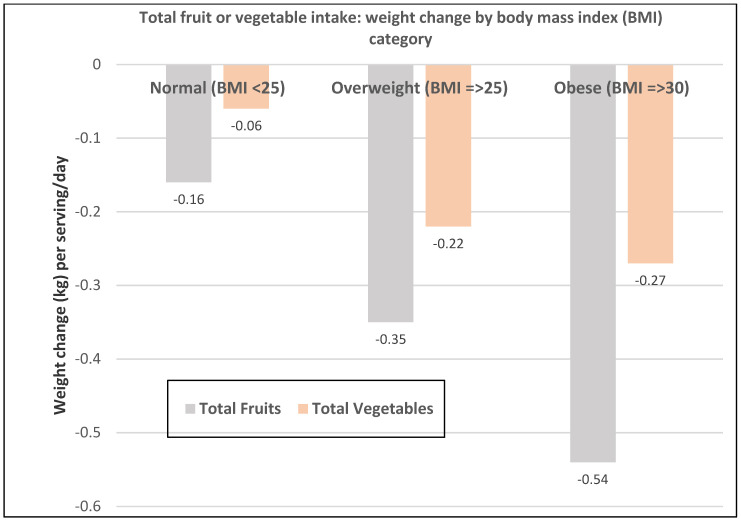
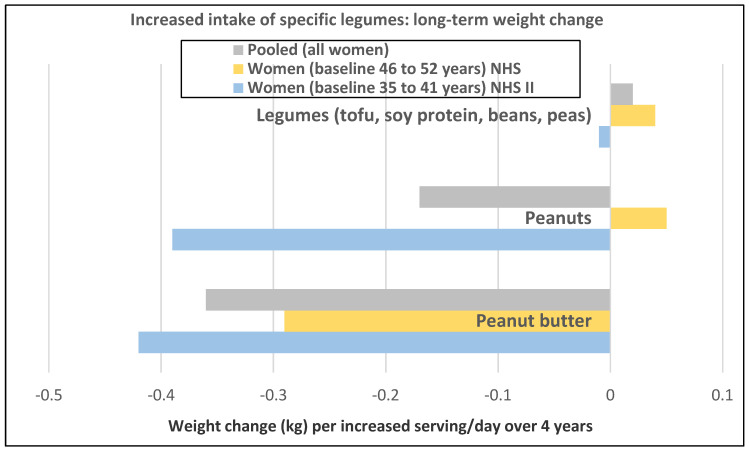
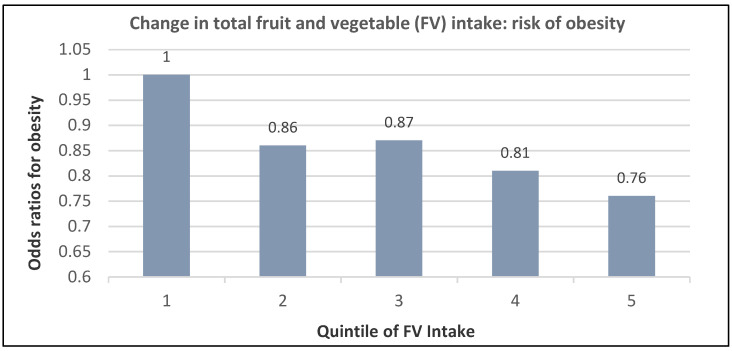
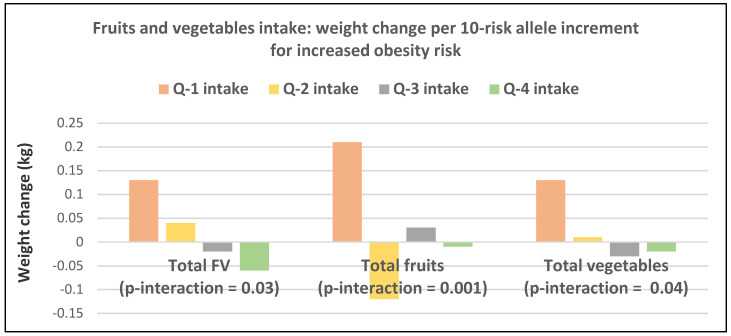
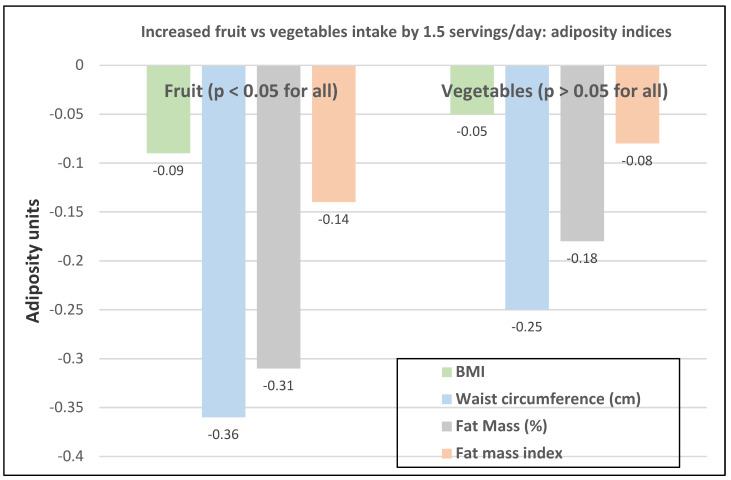
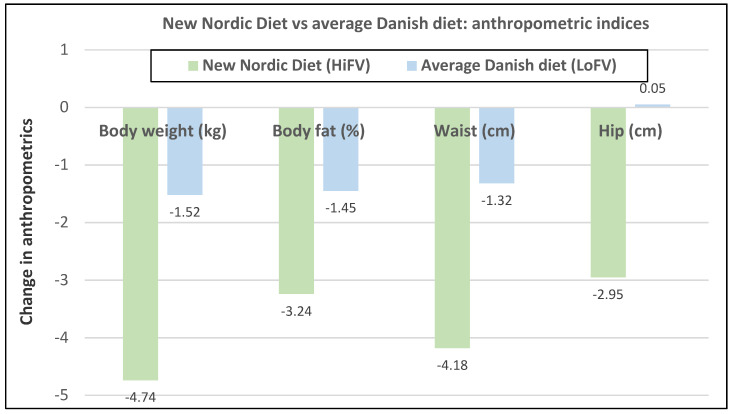
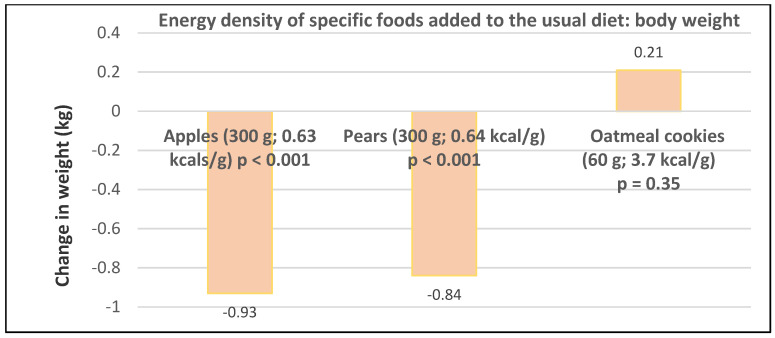
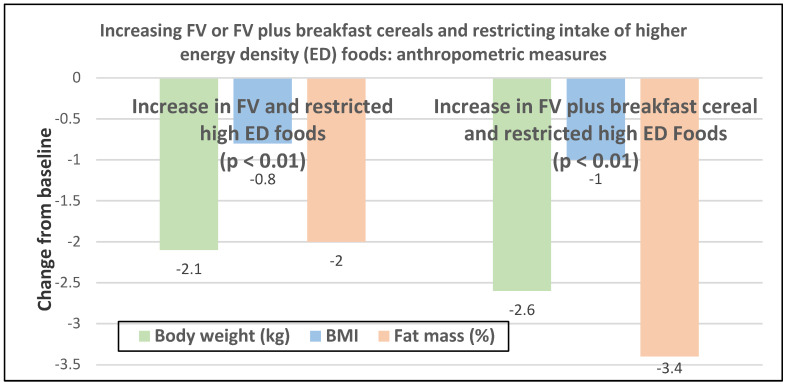
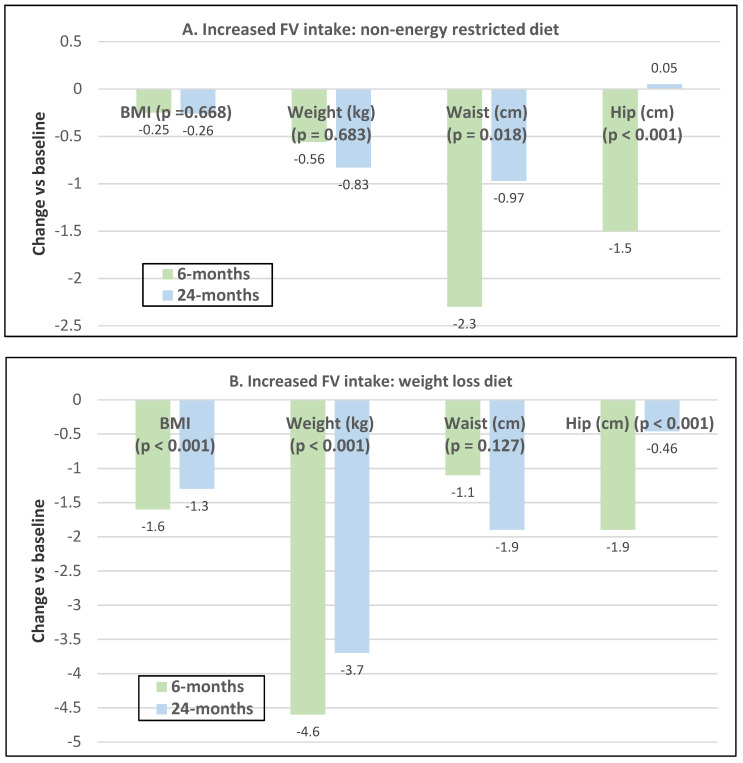
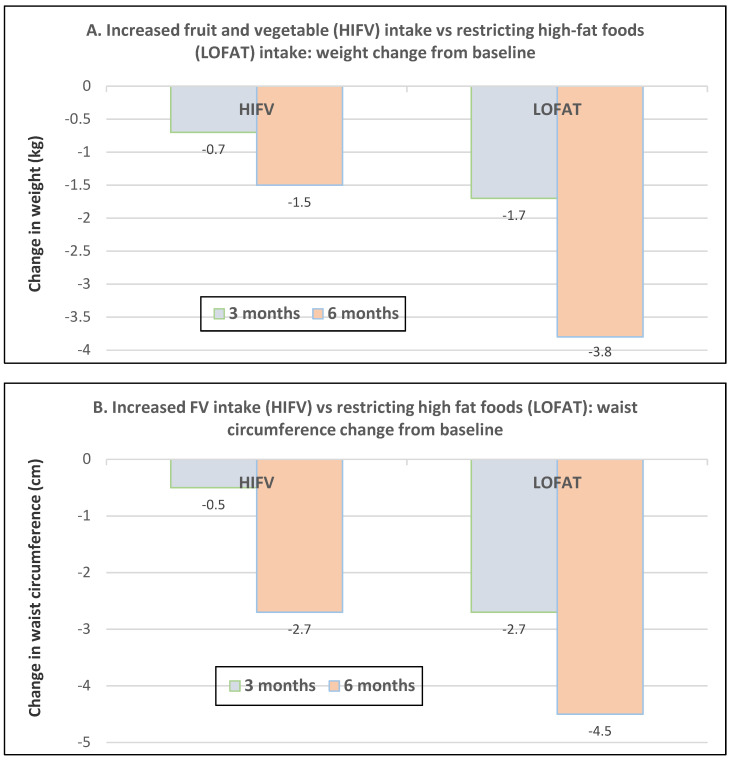
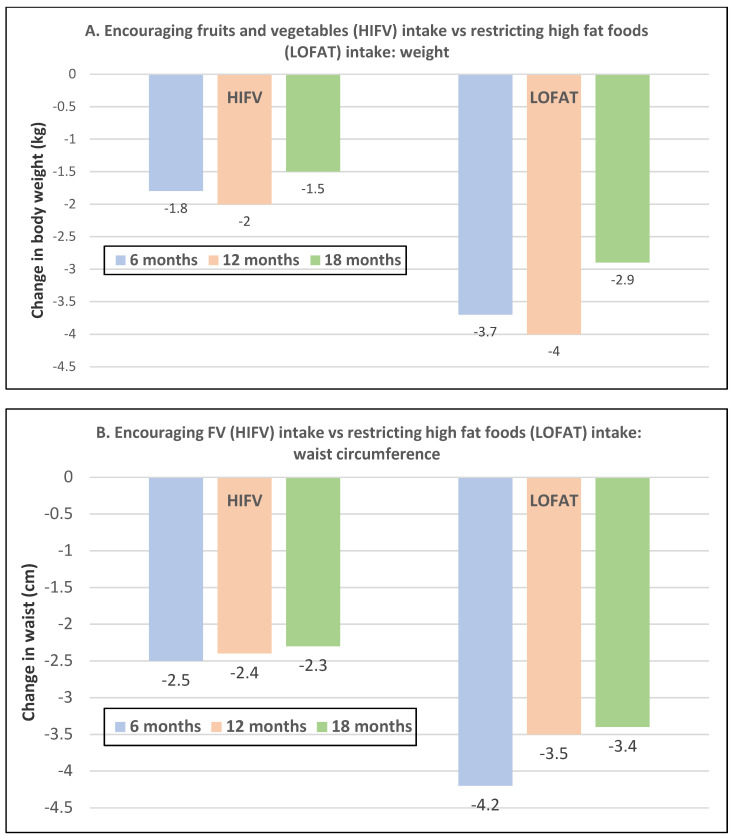
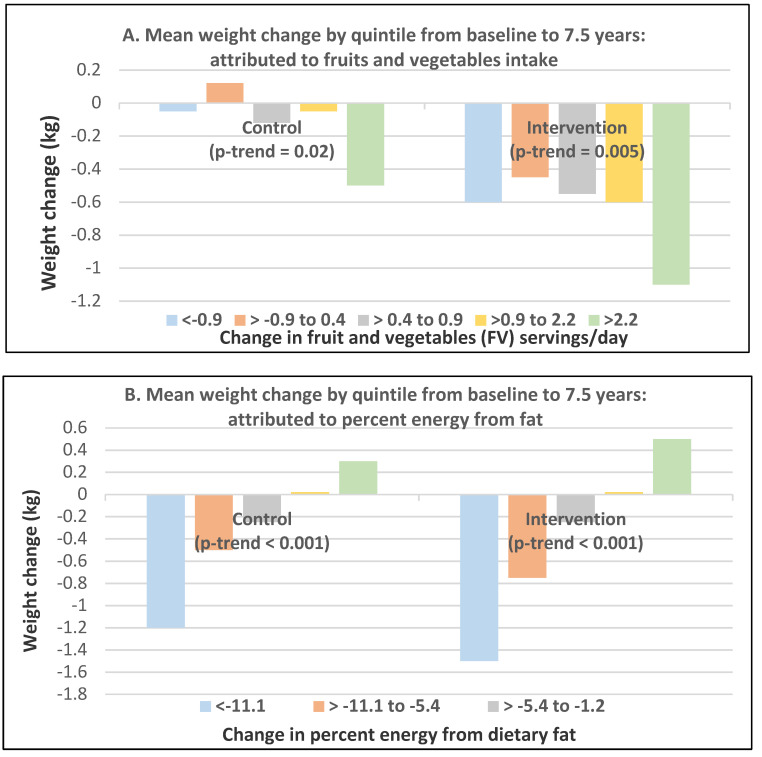
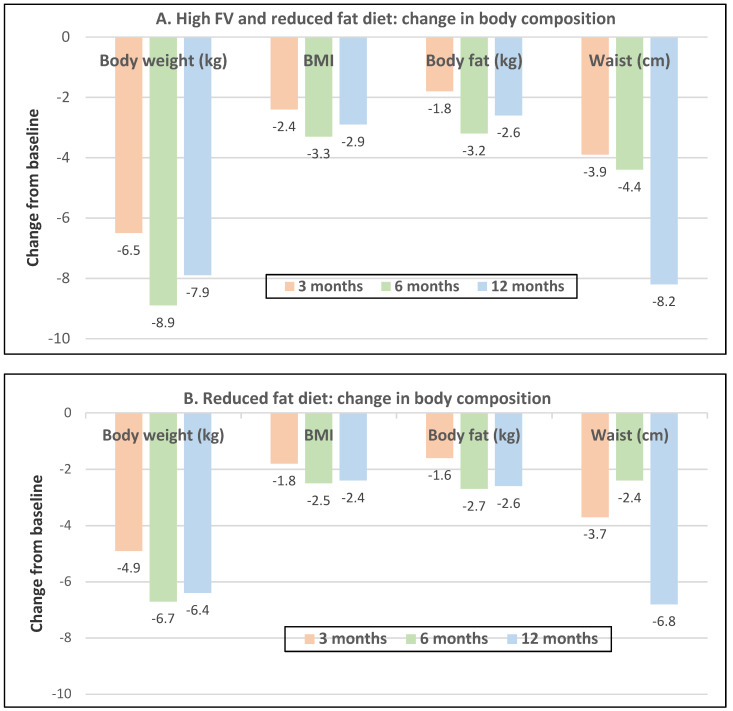
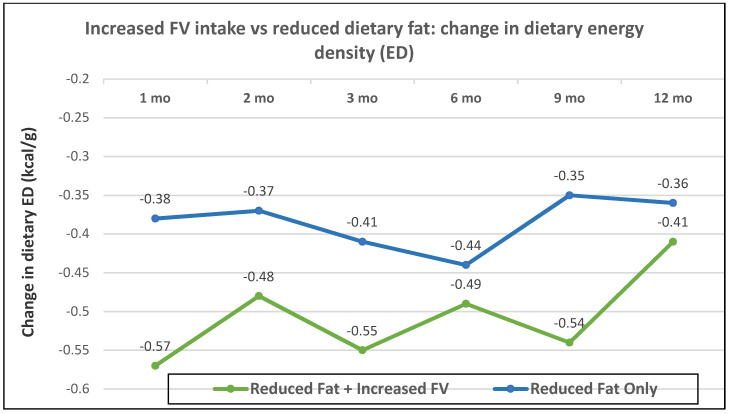
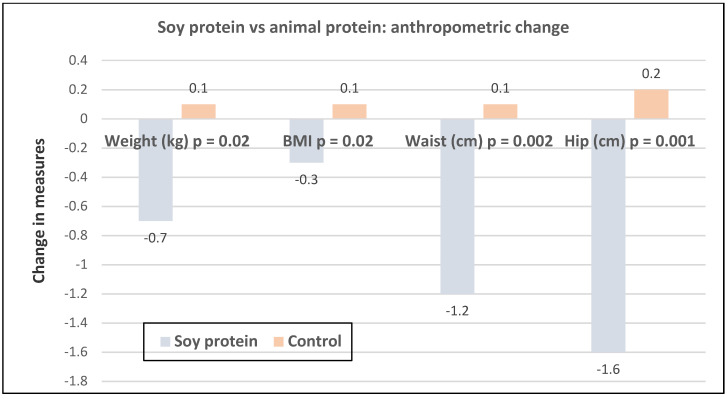
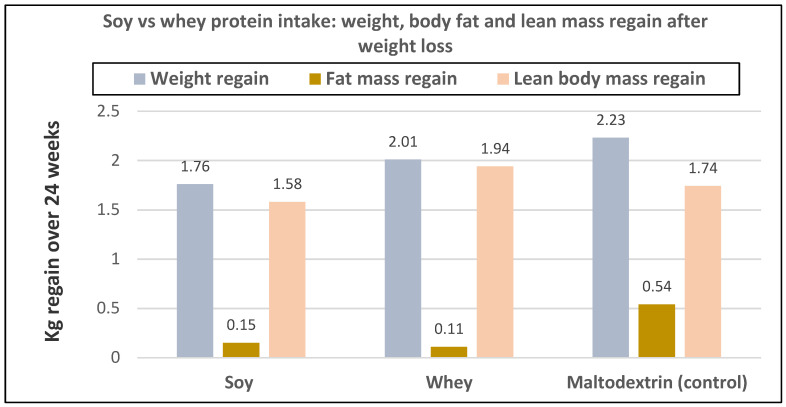
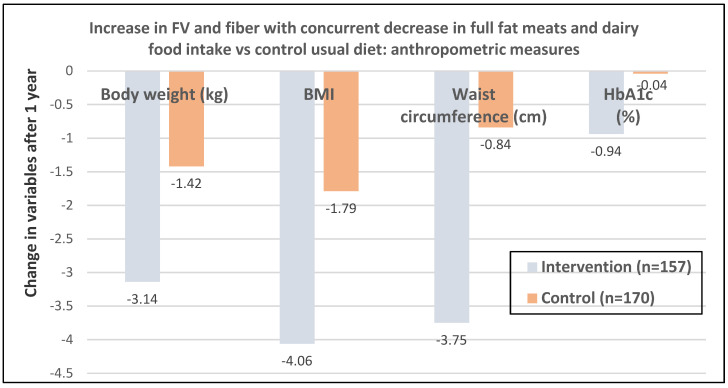
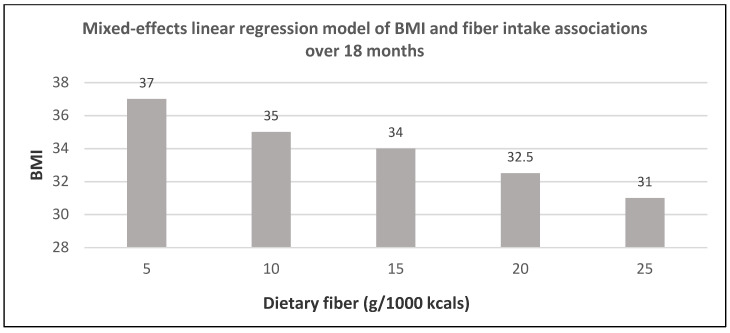
No previous reviews or meta-analyses have specifically assessed the effects of increased fruit and vegetable (FV) intake on weight loss with a primary focus on women. Several studies show differences between men and women in how increased FV intake affects their weight loss and maintenance, risk of becoming overweight or obese, and the influence of eating speed and frequency on weight control. This analysis provides a comprehensive and visual assessment of the effects of increasing FV intake and long-term weight change from observational studies and weight loss from randomized controlled trials (RCTs) in women. Consistent evidence from prospective studies and RCTs shows that increased intake of FV is a chief contributor to weight loss in women. This effect is enhanced with concurrent dietary restriction of high energy density (ED) or high-fat foods. Yet, the type of FV differentially impacts weight loss in women. Whole FV intake may influence weight through a variety of mechanisms including a reduction in eating rate, providing a satisfying, very-low to low energy density, low glycemic load or low-fat content. Also, FV are the primary source of dietary fiber, which can provide additional support for weight loss in women when consumed at adequate levels.

Keywords: adiposity; body mass index; energy density; fruit; glycemic load; legumes; prospective cohort studies; randomized controlled trials; vegetables; waist circumference; weight; women.


Conflict of interest statement

M.L.D. is an ad hoc nutrition research consultant, and N.A.F. is the Senior Director of Nutrition for the Hass Avocado Board.

Figures

Figure A1
Figure A1
Multivariate adjusted association between dietary pattern adherence and change in body weight from the 51,670 Nurses’ Health Study II women (mean baseline age 26 to 46 years and BMI of 24) over 9-year follow-up [14].
Figure 1
Figure 1
Multivariate adjusted associations from the Nurses’ Health Studies (NHS) per increased serving/day of specific fruits and 4-year weight change (kg) in women of different ages (e.g., premenopausal vs. postmenopausal) [18].
Figure 2
Figure 2
Multivariate adjusted associations from the Nurses’ Health Studies (NHS) per increased serving/day of specific non-legume vegetables and 4-year weight change (kg) in women of different age groups (e.g., premenopausal vs. postmenopausal) [18]. * Includes baked, boiled, and mashed white potatoes, sweet potatoes, and yams but excludes French fries and potato chips.
Figure 3
Figure 3
Multivariate association between increased total fruit and total vegetable intake per serving/day and weight change in younger (NHS II; mean baseline age 36-years) and older women (NHS; mean baseline age 49-years) per 4-year period [18].
Figure 4
Figure 4
Multivariate adjusted association between total fruit and total vegetable intake per serving/day and pooled mean weight change for all NHS and NHS II women per 4-year period [18].
Figure 5
Figure 5
Multivariate adjusted association from 94,922 women in the Nurses’ Health Studies (NHS) per increased serving/day of legumes and 4-year weight change (kg) in women of different age groups [19].
Figure 6
Figure 6
Multivariate adjusted evaluation of total fruit and vegetable intake and risk for obesity over 12 years in women from the Nurses’ Health Study (mean baseline age 50 years and BMI 24.9 (p-trend < 0.0001; median change in quintile fruit and vegetable servings from baseline −2.36, −0.49, 0.64, 1.83, and 3.99) [24].
Figure 7
Figure 7
Multivariate adjusted weight change over 4-years per 10 allele increment of genetic susceptibility to obesity for each quintile (Q) of total fruit and vegetable (FV) intake by 8943 middle-aged, overweight women from the Nurses’ Health Study [25].
Figure 8
Figure 8
Multivariate adjusted associations between increased intake of fruit and vegetables by 1.5 servings/day and adiposity indices (26,340 participants, 70% women, mean age 53 years, and BMI 28.5) [36].
Figure 9
Figure 9
Ad libitum New Nordic Diet (high in healthy fruits and vegetables) vs. average Danish diet (low in fruits and vegetables) in 147 centrally obese adults (71% women; mean age 42 years) who completed the 26-week trial (p < 0.001 for all) [40].
Figure 10
Figure 10
Apples or pears vs. oatmeal cookies added to the usual diet and weight change in 49 overweight and obese women (mean age 44 years) for ten weeks [41].
Figure 11
Figure 11
Anthropometric changes with increased intake of fruit and vegetable (FV) or FV plus breakfast cereals, and restricting intake of high energy density foods after six weeks in women (mean baseline age 20–35 years and BMI 28.9) [42].
Figure 12
Figure 12
Change in weight and waist circumference in 75 obese women (mean age 37 years) consuming diets rich in fruit and vegetable (FV), whole grains, or a combination of both [45]. * Diets were a mean of 2100 kcals, and all diets contained ≥35 g fiber: 70% fiber from FV or cereals and 50/50% from each in the combination diet.
Figure 13
Figure 13
Change in weight and BMI vs. baseline in obese adults (73% obese women; mean age 34 years) for high vegetable (8 servings/day) intake or weight loss diet (500 kcal reduced energy intake) over a three-month intervention and up to 18 months follow-up: (A) high vegetable diet reduced weight after three months (p = 0.0087) with an increase back to baseline at 12 and 18 months, and reduced energy and fat intake reduced weight at three months (<0.0001), 12 months (p = 0.0006), and 18 months (p = 0.019), and (B) high vegetable diet reduced BMI at three months (p = 0.014) which remained reduced for the 15 months of follow-up, and the reduced energy and fat diet reduced BMI which remained reduced for all follow-up periods (p ≤ 0.045) [46]. High vegetable group was requested to avoid potato chips, fried vegetables, or 100% fruit or vegetable juices, but post hoc dietary analysis showed that potato chips, French-fried potatoes, 100% vegetable juices were counted as part of the goals and 2–3 servings of fruit including fruit juice.
Figure 13
Figure 13
Change in weight and BMI vs. baseline in obese adults (73% obese women; mean age 34 years) for high vegetable (8 servings/day) intake or weight loss diet (500 kcal reduced energy intake) over a three-month intervention and up to 18 months follow-up: (A) high vegetable diet reduced weight after three months (p = 0.0087) with an increase back to baseline at 12 and 18 months, and reduced energy and fat intake reduced weight at three months (<0.0001), 12 months (p = 0.0006), and 18 months (p = 0.019), and (B) high vegetable diet reduced BMI at three months (p = 0.014) which remained reduced for the 15 months of follow-up, and the reduced energy and fat diet reduced BMI which remained reduced for all follow-up periods (p ≤ 0.045) [46]. High vegetable group was requested to avoid potato chips, fried vegetables, or 100% fruit or vegetable juices, but post hoc dietary analysis showed that potato chips, French-fried potatoes, 100% vegetable juices were counted as part of the goals and 2–3 servings of fruit including fruit juice.
Figure 14
Figure 14
Weight-related changes from baseline with variation in % energy from fat and level of fruit and vegetable (FV) intake, including 100% juice, dried fruit, and starchy vegetables in 122 overweight women (mean age 38 years) over 12 months [47].
Figure 15
Figure 15
Mean change in anthropometric measures in obese women age 30–45 years: (A) increasing fruit and vegetable (FV) intake by 1.3 to 2.2 servings/day with a non-energy restricted diet vs. (B) increasing FV intake by 1.3 to 2.2 servings/day with a weight loss diet [48].
Figure 16
Figure 16
Messaging to encourage increased fruit and vegetable (HIFV) intake vs. restricting intake of high-fat foods (LOFAT) in overweight or obese postmenopausal women: (A) weight change (LOFAT group p < 0.001 at both 3 and 6 months vs. baseline; HIFV p = 0.1829 at three months and p = 0.0004 at six months vs. baseline) and (B) waist circumference change (both diets p < 0.05 at six months vs. baseline) [52].
Figure 17
Figure 17
Messaging to encourage FV intake (HIFV) vs. restricting high-fat foods (LOFAT) in overweight or obese postmenopausal women: (A) Weight change for HIFV was significantly reduced p < 0.05 at 6- and 12-months vs. baseline (p > 0.05) but not at 18 months, and the LOFAT group significantly reduced weight at all three times points (p < 0.05). (B) Waist circumference (WC) change in HIFV group was reduced significantly; WC at 6- and 12-months (p < 0.05) vs. baseline (p < 0.05) and the LOFAT group had significantly WC decreased at all three time points (p < 0.05) [53].
Figure 18
Figure 18
Lower dietary fat and increased fruit and vegetable (FV) (intervention) vs. general dietary guideline information (control) on weight change from baseline to 7.5 years of follow-up that was attributed to (A) increasing FV (servings/day) and (B) decreasing percent energy from fat in postmenopausal women [56].
Figure 19
Figure 19
In 71 obese women (mean age 46 years) two ad libitum diets were assessed over one year: (A) increased fruits and vegetables (FV), and reduced-fat diet reduced weight, BMI and body fat (p < 0.0001) and waist circumference (p = 0.0002) compared to the (B) reduced-fat diet only control diet [58].
Figure 20
Figure 20
Mean change in dietary ED (kcal/g) from baseline for increased fruit and vegetables (FV) and reduced-fat vs. reduced-fat (control) over 12 months (p = 0.019) [58].
Figure 21
Figure 21
Change in anthropometric measures in 60 women with polycystic ovary syndrome (mean age 25 years and BMI 28) consuming isocaloric diets with 0.8 g protein per kg from soy group (35% soy protein, 35% animal protein and 30% plant protein) vs. non-soy control (70% animal protein and 30% vegetable protein) for eight weeks [61].
Figure 22
Figure 22
Double-blinded randomized controlled trial on the effects of type of protein (45 g/day) vs. carbohydrate control and weight regain after weight loss; included 171 adults (78% women) over 24 weeks (p = 0.50 to 0.96) [63].
Figure 23
Figure 23
Beans compared to the recommended intake of fruit and vegetable (FV) and whole grains on weight loss in 20 subjects (90% women; mean 47 y and BMI 31) after four weeks (both diets p < 0.001; mean fiber 28g/day) [65].
Figure 24
Figure 24
Multivariate % change in anthropometric measures in 180 overweight Chinese women consuming 15-g soy protein vs. milk protein for six months in a double-blind RCT [67].
Figure 25
Figure 25
Multivariate adjusted association between dietary energy density (ED) and (A) BMI (mean SD ± 0.3 kg/m2; p-trend < 0.0002) and (B) waist circumference (mean SD + mean SD ± 0.9 cm; p-trend < 0.001) from an NHANES analysis of 4587 US women (≥18 years) [73].
Figure 26
Figure 26
Multivariate adjusted association between increased protein-rich legume vegetable intake per serving/day and dietary glycemic load (GL) status and effect on weight change for all Nurses’ Health Studies (NHS, NHS II), and Health Professionals Follow-up Study (120,784; 80% women) per 4-year period (decreasing GL p < 0.01) [19].
Figure 27
Figure 27
RCT of 327 young overweight and obese women (mean age 34 years). A significant increase in consumption of fruit and vegetable (FV) and fiber along with decreased intake of meat and dairy products, total dietary fat and refined carbohydrates led to reduction of total energy intake by −342 kcals/day in the healthy diet education group resulting in significantly more loss of weight, BMI, and WC than shown in the usual diet control women over 12 months (p < 0.05) [81].
Figure 28
Figure 28
In a randomized weight loss and maintenance trial, increased fiber intake and BMI change estimated over 18 months (6-month intervention and 12 months of follow-up) in middle-aged obese African-American women (p = 0.003) [82].

References

    1. Lee-Kwan S.H., Moore L.V., Blanck H.M., Harris D.M., Galuska D. Disparities in state -specific adult fruit and vegetable consumption—United States. 2015. MMWR Morb. Mortal. Wkly. Rep. 2017;66:1241–1247. doi: 10.15585/mmwr.mm6645a1. - DOI - PMC - PubMed
    1. US Department of Health and Human Services and U.S. Department of Agriculture 2015–2020 Dietary Guidelines for Americans. 8th Edition. December 2015. [(accessed on 31 May 2020)]; Available online: https://health.gov/dietaryguidelines/2015/guidelines/
    1. Charlton K., Kowai P., Soriano M.M., Williams S., Banks E., Vo K., Byles J. Fruit and vegetables intake and body mass index in a large sample of middle-ager Australian men and women. Nutrients. 2014;6:2305–2319. doi: 10.3390/nu6062305. - DOI - PMC - PubMed
    1. Williams R.L., Wood L.G., Collins C.E., Callister R. Comparison of fruit and vegetable intakes during weight loss in males and females. Eur. J. Clin. Nutr. 2016;70:28–34. doi: 10.1038/ejcn.2015.123. - DOI - PubMed
    1. Karfopoulou E., Brikou D., Mamalaki E., Bersimis F., Anastasiou C.A., Hill J.O., Yannakoulia M. Dietary patterns in weight loss maintenance: Results from the MedWeight study. Eur. J. Nutr. 2017;56:991–1002. doi: 10.1007/s00394-015-1147-z. - DOI - PubMed