. 2020 Jun;147(6):EL478.
doi: 10.1121/10.0001334.

Numerical analysis of three-dimensional echo decorrelation imaging

Affiliations

Numerical analysis of three-dimensional echo decorrelation imaging

Michael T Cox et al. J Acoust Soc Am. 2020 Jun.

Abstract

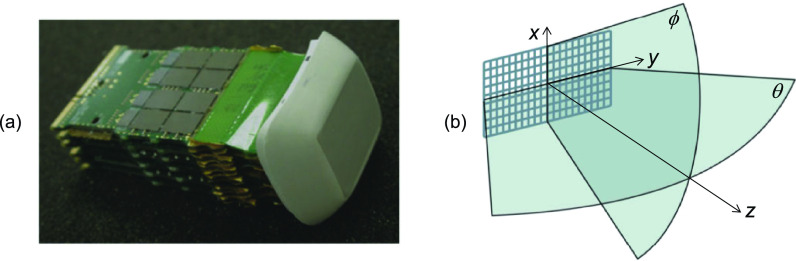
A numerical model for three-dimensional echo decorrelation imaging, a pulse-echo ultrasound method applicable to thermal ablation monitoring, is presented. Beam patterns for steered transmit and receive array apertures are combined with a three-dimensional numerical tissue model to yield beamformed scan lines in a pyramidal configuration, volumetric B-mode images, and spatial maps of normalized decorrelation between sequential image volumes. Simulated three-dimensional echo decorrelation images of random media are analyzed as estimators of local tissue reflectivity decoherence, mimicking thermal ablation effects. The estimation error is analyzed as a function of correlation window size, scan line density, and ensemble averaging of decorrelation maps.


Figures

Fig. 1.
Fig. 1.
Simulation configuration and geometry, adapted from manufacturer literature (Ref. 11). (a) Modeled 4Z1c array, showing integrated beamforming electronics. (b) Geometry indicating elevation, azimuth, and range coordinates (x, y, and z, relative to origin at the array midpoint) and azimuth and elevation steering angles (θ and ϕ, relative to the z axis).
Fig. 2.
Fig. 2.
Representative cross sections of 3D echo decorrelation images, illustrating effects of correlation window size. Each panel shows a map of log10-scaled echo decorrelation (color bar shown) overlaid on a cross section of the B-mode image volume, plotted using a gray scale with 70 dB dynamic range. (a) Perpendicular (yz and xz) cross sections for a simulated ablation zone of radius 15 mm and correlation window width parameter σ=0.0 mm. (b) Same as panel (a), but correlation window σ=1.5 mm. (c) Azimuth-range (yz) cross sections with simulated ablation zone radius 20 mm and σ=0.8 mm, for one realization (no ensemble averaging) at full scan line density (top) and half line density (bottom) in each scanning direction. (d) Same as panel (b), but decorrelation maps averaged over ten independent iterations.
Fig. 3.
Fig. 3.
Normalized RMS error of 3D echo decorrelation maps vs imposed reflectivity decoherence. Each panel shows RMS error normalized to RMS decoherence in the same region of interest using the color bar shown, as a function of the correlation window width parameter σ and the number of ensemble averages for simulated spherical ablation zones with radius 5–25 mm from left to right. Normalized RMS error of 0.5 is shown by the black (outer) dashed contour, error of 0.3 is shown by the yellow (inner) contour, and minimum error for each number of averages is plotted as a white circle. (a) Full line density. (b) Half line density in each scanning direction.

References

    1. Ridouani F. and Srimathveeravalli G., “ Percutaneous image-guided ablation: From techniques to treatments,” Presse Med. 48, e219–e231 (2019).10.1016/j.lpm.2019.06.005 - DOI - PubMed
    1. Puijk R. S., Ruarus A. H., Scheffer H. J., Vroomen L. G. P. H., van Tilborg A. A. J. M., de Vries J. J. J., Berger F. H., van den Tol P. M. P., and Meijerink M. R., “ Percutaneous liver tumour ablation: Image guidance, endpoint assessment, and quality control,” Can. Assoc. Radiol. J. 69, 51–62 (2018).10.1016/j.carj.2017.11.001 - DOI - PubMed
    1. Hooi F. M., Nagle A. S., Subramanian S., and Mast T. D., “ Analysis of tissue changes, measurement system effects, and motion artifacts in echo decorrelation imaging,” J. Acoust. Soc. Am. 137, 585–597 (2015).10.1121/1.4906580 - DOI - PMC - PubMed
    1. Lewis M. A., Staruch R. M., and Chopra R., “ Thermometry and ablation monitoring with ultrasound,” Int. J. Hyperthermia 31, 163–181 (2015).10.3109/02656736.2015.1009180 - DOI - PMC - PubMed
    1. Zhou Z., Wang Y., Song S., Wu W., Wu S., and Tsui P. H., “ Monitoring microwave ablation using ultrasound echo decorrelation imaging: An ex vivo study,” Sensors 19, 977 (2019).10.3390/s19040977 - DOI - PMC - PubMed

Publication types