

Increasing Temperature and Relative Humidity Accelerates Inactivation of SARS-CoV-2 on Surfaces
- PMID: 32611701
- PMCID: PMC7333574
- DOI: 10.1128/mSphere.00441-20
Increasing Temperature and Relative Humidity Accelerates Inactivation of SARS-CoV-2 on Surfaces
Abstract
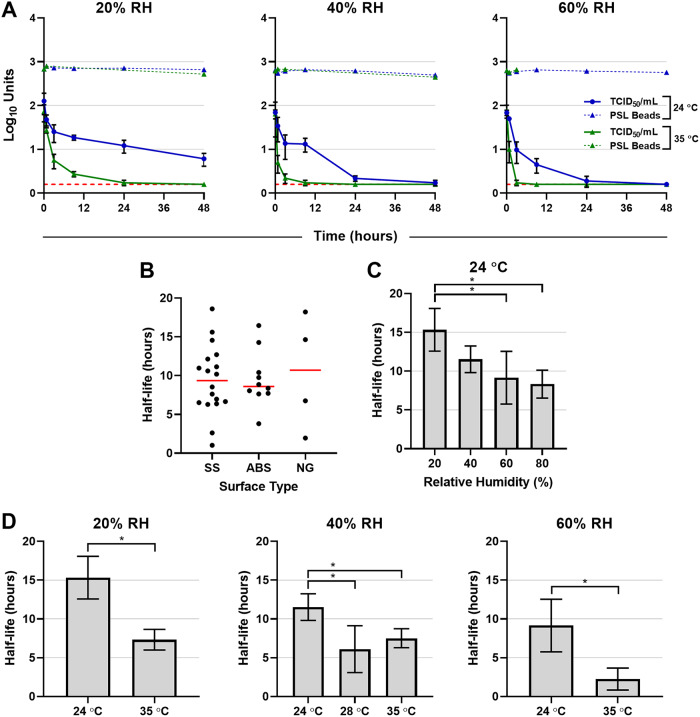
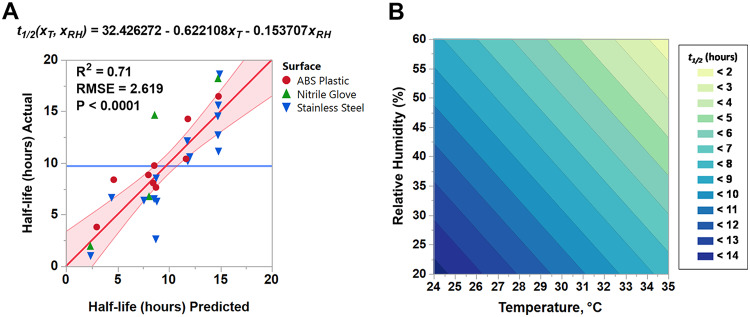
Coronavirus disease 2019 (COVID-19) was first identified in China in late 2019 and is caused by newly identified severe acute respiratory syndrome coronavirus 2 (SARS-CoV-2). Previous studies had reported the stability of SARS-CoV-2 in cell culture media and deposited onto surfaces under a limited set of environmental conditions. Here, we broadly investigated the effects of relative humidity, temperature, and droplet size on the stability of SARS-CoV-2 in a simulated clinically relevant matrix dried on nonporous surfaces. The results show that SARS-CoV-2 decayed more rapidly when either humidity or temperature was increased but that droplet volume (1 to 50 μl) and surface type (stainless steel, plastic, or nitrile glove) did not significantly impact decay rate. At room temperature (24°C), virus half-life ranged from 6.3 to 18.6 h depending on the relative humidity but was reduced to 1.0 to 8.9 h when the temperature was increased to 35°C. These findings suggest that a potential for fomite transmission may persist for hours to days in indoor environments and have implications for assessment of the risk posed by surface contamination in indoor environments.IMPORTANCE Mitigating the transmission of SARS-CoV-2 in clinical settings and public spaces is critically important to reduce the number of COVID-19 cases while effective vaccines and therapeutics are under development. SARS-CoV-2 transmission is thought to primarily occur through direct person-to-person transfer of infectious respiratory droplets or through aerosol-generating medical procedures. However, contact with contaminated surfaces may also play a significant role. In this context, understanding the factors contributing to SARS-CoV-2 persistence on surfaces will enable a more accurate estimation of the risk of contact transmission and inform mitigation strategies. To this end, we have developed a simple mathematical model that can be used to estimate virus decay on nonporous surfaces under a range of conditions and which may be utilized operationally to identify indoor environments in which the virus is most persistent.
Keywords: COVID-19; SARS-CoV-2; contamination; coronavirus; fomite; half-life; humidity; temperature; transmission.
Copyright © 2020 Biryukov et al.
Figures
References
-
- Chia PY, Coleman KK, Tan YK, Ong SWX, Gum M, Lau SK, Lim XF, Lim AS, Sutjipto S, Lee PH, Son TT, Young BE, Milton DK, Gray GC, Schuster S, Barkham T, De PP, Vasoo S, Chan M, Ang BSP, Tan BH, Leo YS, Ng OT, Wong MSY, Marimuthu K, Singapore Novel Coronavirus Outbreak Research Team. 2020. Detection of air and surface contamination by SARS-CoV-2 in hospital rooms of infected patients. Nat Commun 11:2800. doi: 10.1038/s41467-020-16670-2. - DOI - PMC - PubMed
-
- Guo Z-D, Wang Z-Y, Zhang S-F, Li X, Li L, Li C, Cui Y, Fu R-B, Dong Y-Z, Chi X-Y, Zhang M-Y, Liu K, Cao C, Liu B, Zhang K, Gao Y-W, Lu B, Chen W. 2020. Aerosol and surface distribution of severe acute respiratory syndrome coronavirus 2 in hospital wards, Wuhan, China, 2020. Emerg Infect Dis 26 doi: 10.3201/eid2607.200885. - DOI - PMC - PubMed
-
- Ong SWX, Tan YK, Chia PY, Lee TH, Ng OT, Wong MSY, Marimuthu K. 2020. Air, surface environmental, and personal protective equipment contamination by severe acute respiratory syndrome coronavirus 2 (SARS-CoV-2) from a symptomatic patient. JAMA 323:1610–1612. doi: 10.1001/jama.2020.3227. - DOI - PMC - PubMed
Publication types
MeSH terms
Substances
LinkOut - more resources
Full Text Sources
Other Literature Sources
Miscellaneous
