. 2020 Jul 1;10(1):10751.
doi: 10.1038/s41598-020-67470-z.

Modulation of acoustic navigation behaviour by spatial learning in the echolocating bat Rhinolophus ferrumequinum nippon

Affiliations

Modulation of acoustic navigation behaviour by spatial learning in the echolocating bat Rhinolophus ferrumequinum nippon

Yasufumi Yamada et al. Sci Rep. .

Abstract

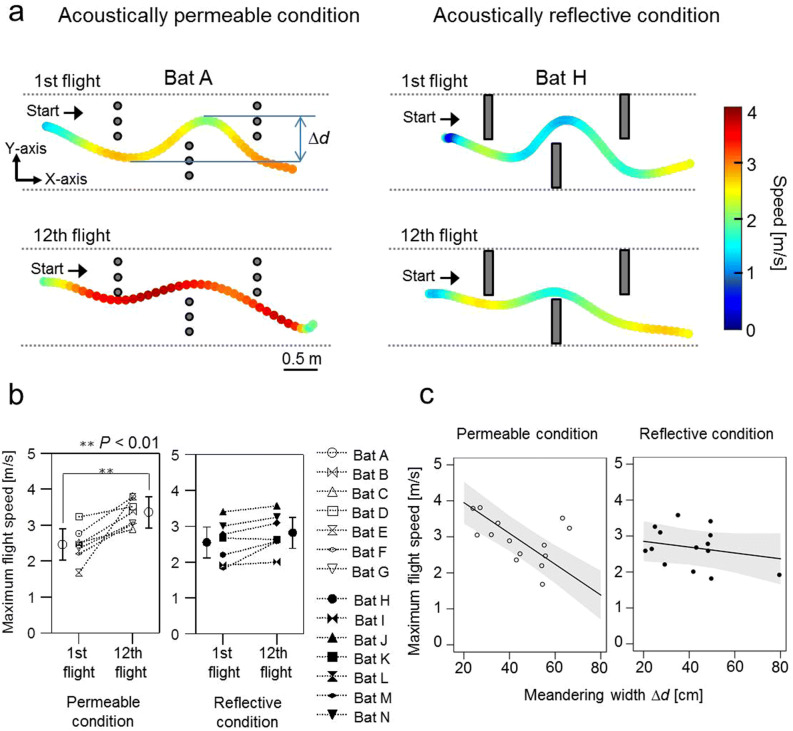
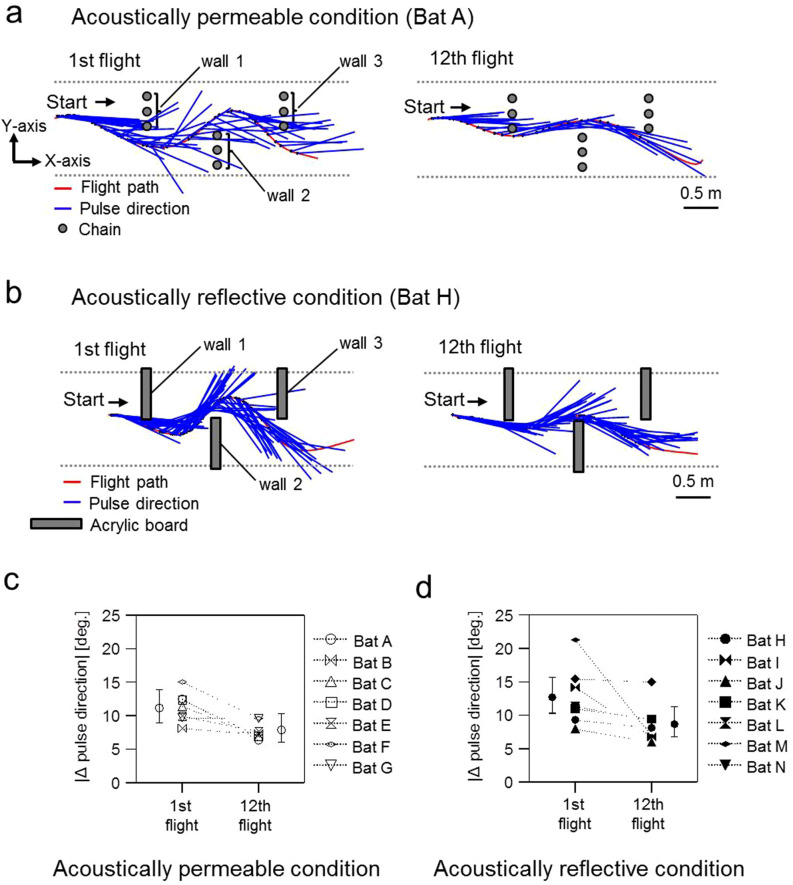
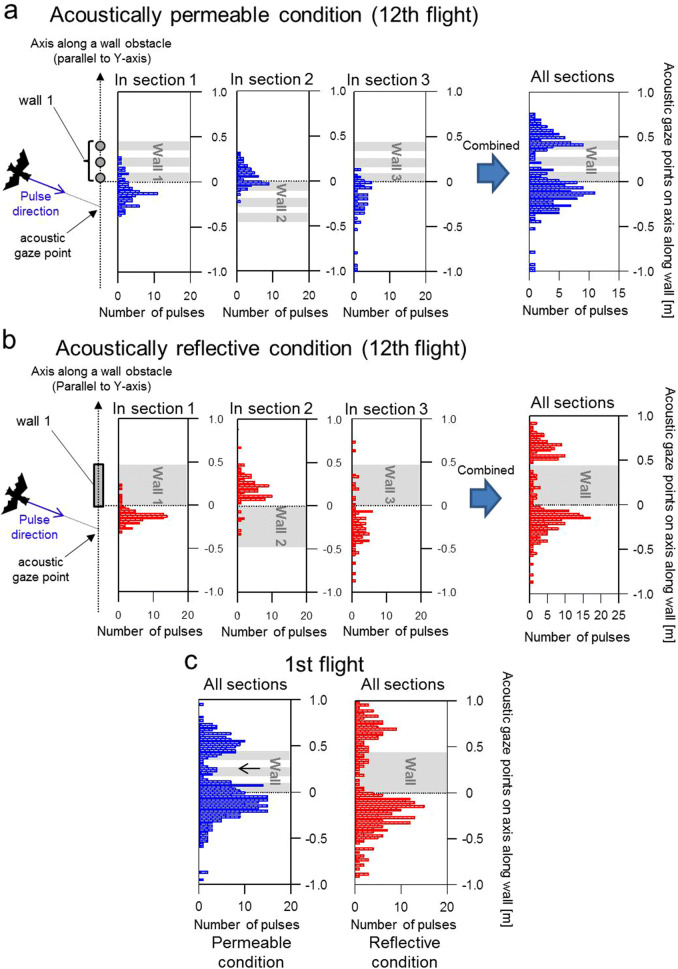
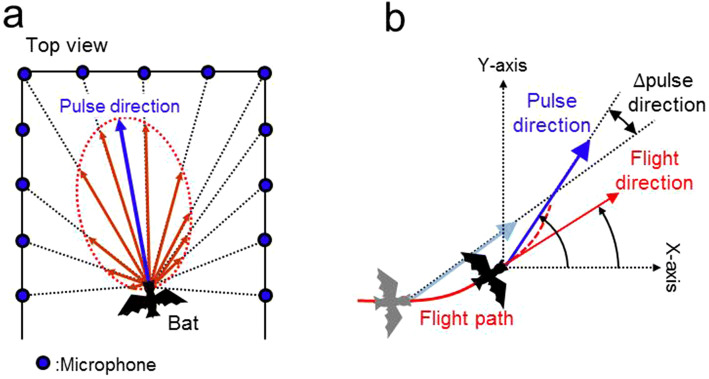
Using echolocation, bats receive acoustic information on their surroundings, which is assumed to help them sophisticatedly navigate complex environments. In this study, to understand spatial learning and acoustic sensing in bats, we investigated how flight and echolocation control changed in Rhinolophus ferrumequinum nippon as they learnt about their surroundings in an obstacle course that they flew through repeatedly. In these experiments, two testing environments (acoustically permeable and acoustically reflective) were prepared using chains and acrylic boards as obstacles to evaluate the interactive effects of spatial learning and flight environments. We found that bats reduced the meandering width of their flights and pulse emissions, and also seemed to reduce their shifts in pulse direction as they learnt more about their environments in both conditions. Throughout all our experiments, the bats with slower flight speeds tended to emit more pulses, which suggests that the number of pulse emissions reflects the echolocation tactics of each bat. The maximum flight speed was especially increased in the acoustically permeable condition, with frequent emissions of multiple pulses (≧triplets) in the early stages of flight, suggesting that bats adjust their flight plan based on how much of their surroundings they are able to sense in advance.


Conflict of interest statement

The authors declare no competing interests.

Figures

Figure 1
Figure 1
Echolocation calls of R. ferrumequinum nippon during repeated flights in the obstacle course in acoustically permeable and acoustically reflective wall conditions. (a) Amplitude pattern (top) and sonogram (bottom) of typical pulse emission sequences in R. ferrumequinum nippon during flight in the chamber. Sounds were recorded with the telemetry microphone mounted on the back of the bat. (b) Arrangement of the microphone array and obstacles in the flight chamber. To construct the acoustically permeable environment, three chains (yellow circles) were arranged at 22-cm intervals along the y-axis to form acoustically permeable walls. To create the acoustically reflective condition, we replaced the chain walls with acrylic boards. The three chain walls or acrylic boards were alternately arranged within an aisle, which was framed by chain walls (15-cm interval between chains, x-axis, grey circles), so that the bats were forced to follow an S-shaped flight pattern. For the behavioural analysis of the acoustic gaze, the flight state was separated into three sections, based on the location of each obstacle wall.
Figure 2
Figure 2
Movement behaviour of R. ferrumequinum nippon during repeated flights in the obstacle course in acoustically permeable and acoustically reflective wall conditions. (a) Exemplary flight paths and flight speeds between the 1st (top panel) and 12th (bottom panel) flight of bat A in the acoustically permeable wall condition and bat H in the acoustically reflective wall condition, respectively. (b) Relationship between the maximum flight speed, the flight number, and acoustical condition for all individuals’ data. (c) Relationship between the maximum flight speed, the meandering width Δd, and the acoustic condition. Open and filled circles represent the raw data recorded in the acoustically permeable and reflective wall conditions, respectively. Black line and Grey shaded area in each panel indicate the predicted value and 95% confidence intervals, respectively.
Figure 3
Figure 3
Relationship between the type and number of pulse emissions, the flight number, and acoustical conditions. All pulses (named total pulses, n = 7 bats per condition) were classified into three types: triplets or more pulses (n = 7 bats per condition, blue), doublets (n = 7 bats per condition, green), and single pulses (n = 7 bats per condition, red). Note that single pulses were not modelled due to insufficient data points. (a) Changes in echolocation behaviour between the 1st and 12th flight in the acoustically permeable condition. (b) Changes in echolocation behaviour between the 1st and 12th flight in the acoustically reflective wall condition.
Figure 4
Figure 4
Emission of triplets across space and time. (a) Exemplary flight path of bat A as seen from above shows the spatial locations of triplet emissions as blue points. (b) Spatial locations of triplet emissions during the 1st and 12th flight of bats (A–G) passing the obstacle course in the acoustically permeable wall condition. (c) Spatial locations of triplet emissions during the 1st and 12th flight of bats (H–N) passing the obstacle course in the acoustically reflective wall condition. In both subplots (b) and (c), blue marker plots indicate the location of the emission of triplets, while grey shaded areas indicate the positions of the obstacle walls. (d) Change of the number of emitted triplets across obstacle course Sects. (1, 2 and 3) in the 1st and 12th flight and in the acoustically permeable (left panel) and reflective wall condition (right panel). Values for means and 95% confidence intervals were derived from the generalized linear mixed effect model. Closed and open plots in each panel indicate emissions during the 1st and 12th flight, respectively. (e) Relationship between the total number of emitted pulses and flight speed. Each plot represents the raw data recorded in the acoustically permeable and reflective wall conditions. Black line and Grey shaded area indicate the predicted value and 95% confidence intervals, respectively.
Figure 5
Figure 5
Directions of emitted pulses across space and time. (a, b) Aerial view of the 1st (left panel) and 12th (right panel) flight of bats (A and H). Flight path (red line) and the pulse directions (blue line) from the echolocation calls of flying bats in the obstacle course have been indicated. (c, d) Changes in average ∆pulse direction between the 1st and 12th flight in the acoustically permeable (c) and reflective (d) wall conditions. ∆pulse direction represents the change in the pulse direction between successive pulses (see Fig. 7b). Values for means and 95% confidence intervals were derived from the respective generalized linear mixed effect model.
Figure 6
Figure 6
Comparison of the acoustic gaze dynamics of bats between the acoustically permeable and acoustically reflective wall conditions while flying through the obstacle course. (a, b) Histograms of the acoustic gaze points combined for all bats during the 12th flight in the acoustically permeable (a) and reflective (b) wall conditions. Note that the cross point of the pulse direction and the axis along an immediate obstacle wall was defined as the acoustic gaze point. The grey area indicates the immediate obstacle wall. Histograms for acoustic gaze points relative to the first, second, and third obstacle walls were made by separating the flight state into three sections (see Fig. 1b). An integrated histogram for all three sections in each condition is indicated in the upper-right and bottom-right panels, respectively. Note that the histogram was integrated with the vertical axis offset so that the wall locations of all three obstacles would be aligned. (c) Integrated histogram for all three sections during the 1st flight. The left and right-side panels indicate the acoustically permeable and reflective wall conditions, respectively.
Figure 7
Figure 7
Methods used to derive pulse direction and Δpulse direction from the echolocation calls of flying bats. (a) Procedure of calculating the horizontal pulse direction using microphone array recordings. The pattern of pulse directivity (dashed red line) was reconstructed by integrating the sound pressure vectors across all microphones (red arrows). Then, the horizontal pulse direction was determined at the peak of the reconstructed pulse directivity pattern (blue arrow). (b) ∆pulse direction was defined as the angular differences between the previous and present pulse direction. Note that ∆pulse direction represents the absolute value.

References

    1. Simmons JA. The resolution of target range by echolocating bats. J. Acoust. Soc. Am. 1973;54:157–173. doi: 10.1121/1.1913559. - DOI - PubMed
    1. Barchi JR, Knowles JM, Simmons JA. Spatial memory and stereotypy of flight paths by big brown bats in cluttered surroundings. J. Exp. Biol. 2013;216:1053–1063. doi: 10.1242/jeb.073197. - DOI - PubMed
    1. Hase K, et al. Bats enhance their call identities to solve the cocktail party problem. Commun. Biol. 2018;1:39. doi: 10.1038/s42003-018-0045-3. - DOI - PMC - PubMed
    1. Jen PH-S, Kamada T. Analysis of orientation signals emitted by the CF-FM bat, Pteronotus p. parnellii and the FM bat, Eptesicus fuscus during avoidance of moving and stationary obstacles. J. Comp. Physiol. 1982;148:389–398. doi: 10.1007/BF00679023. - DOI
    1. Surlykke A, Pedersen SB, Jakobsen L. Echolocating bats emit a highly directional sonar sound beam in the field. Proc. R. Soc. Lond. B: Biol. Sci. 2009;276:853–860. doi: 10.1098/rspb.2008.1505. - DOI - PMC - PubMed

Publication types