. 2020 Jul 1;11(1):3282.
doi: 10.1038/s41467-020-17099-3.

A FAK/HDAC5 signaling axis controls osteocyte mechanotransduction

Affiliations

A FAK/HDAC5 signaling axis controls osteocyte mechanotransduction

Tadatoshi Sato et al. Nat Commun. .

Abstract

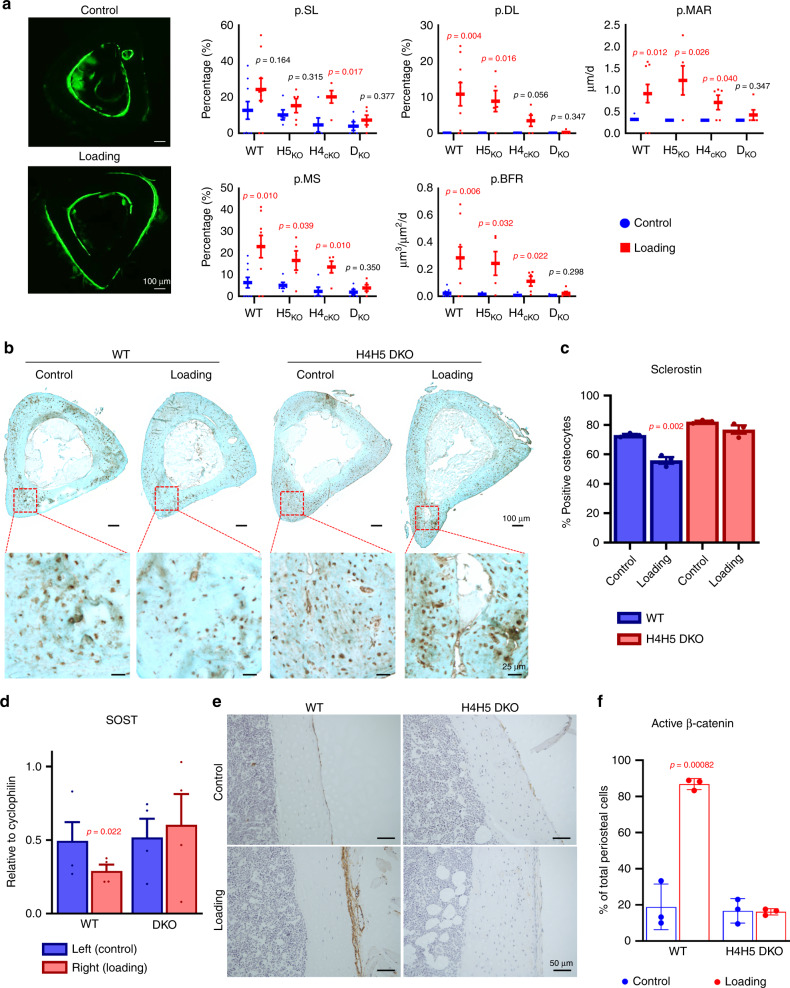
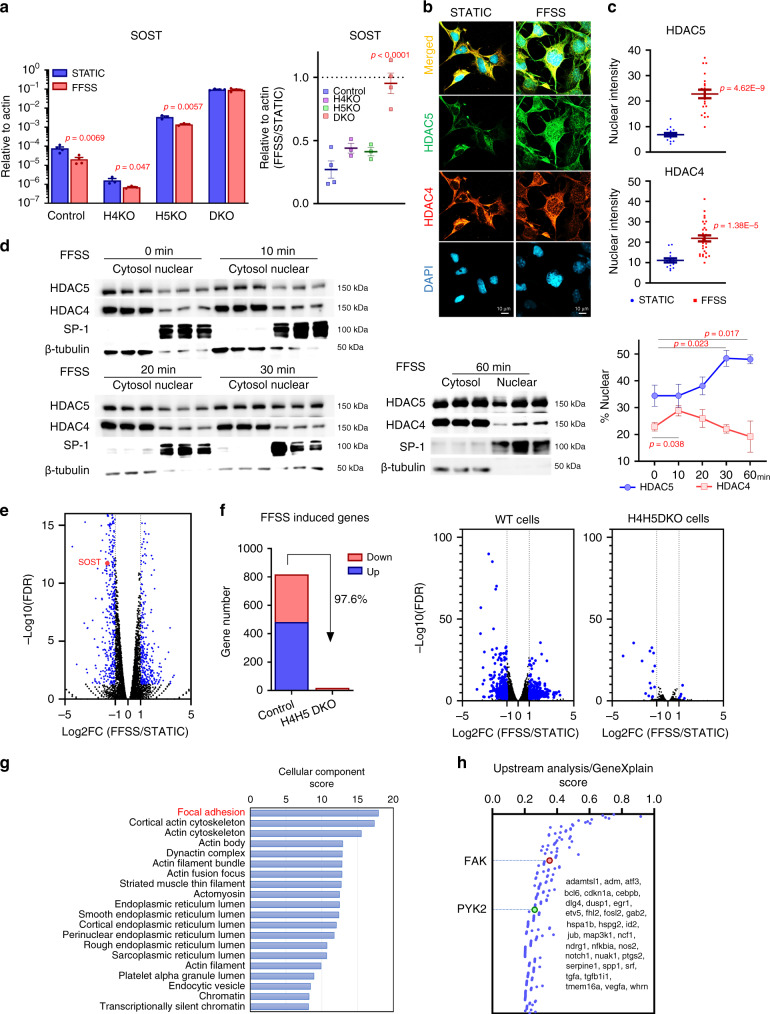
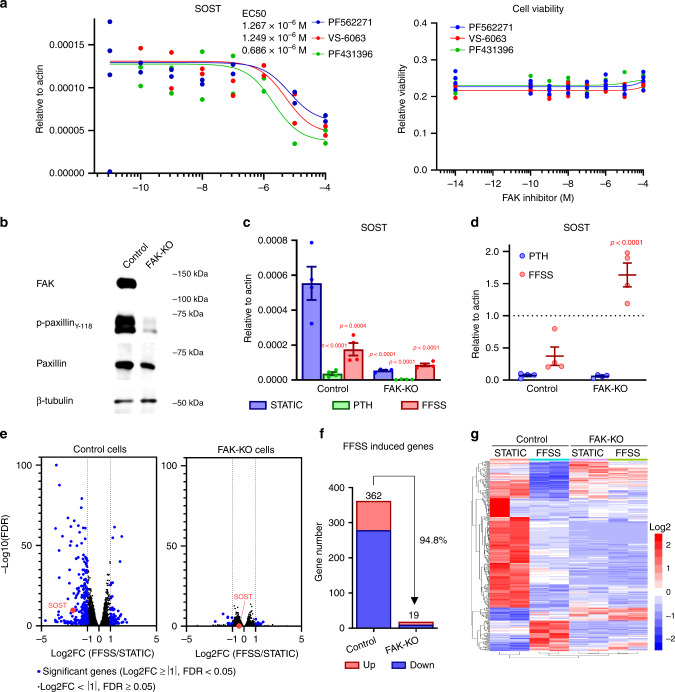
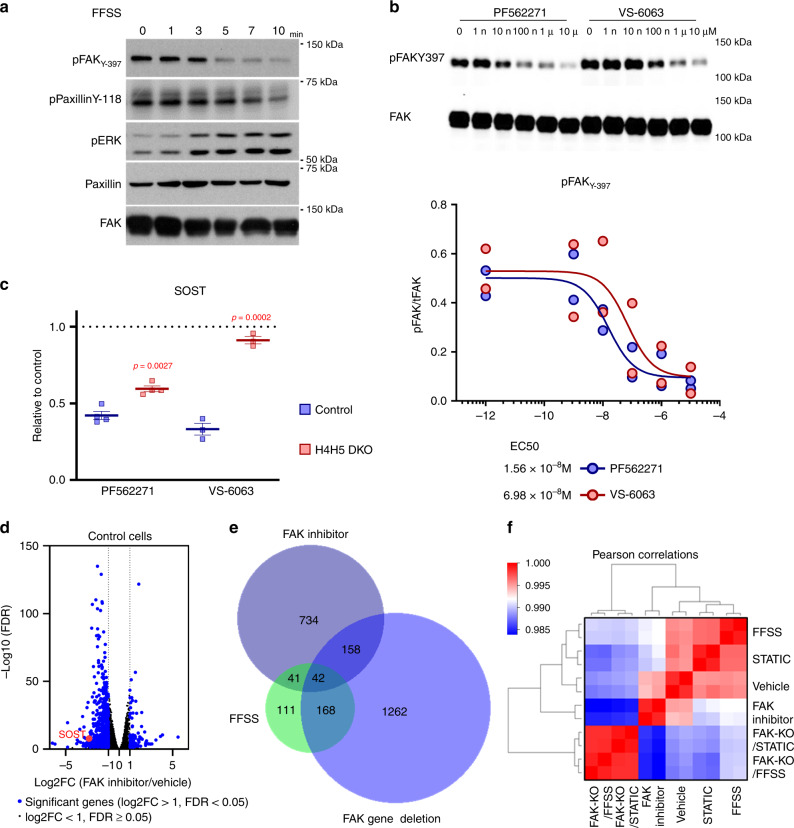
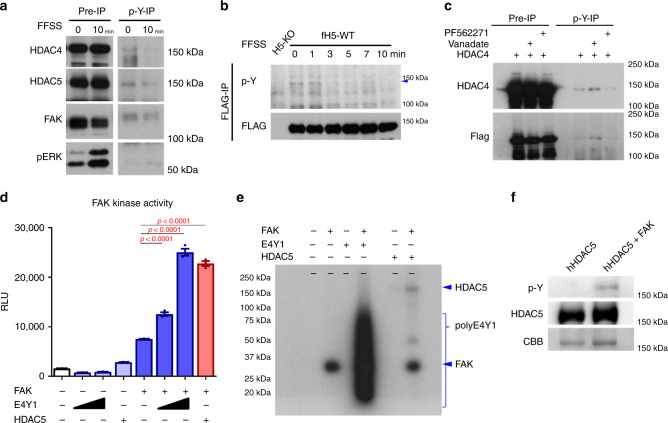
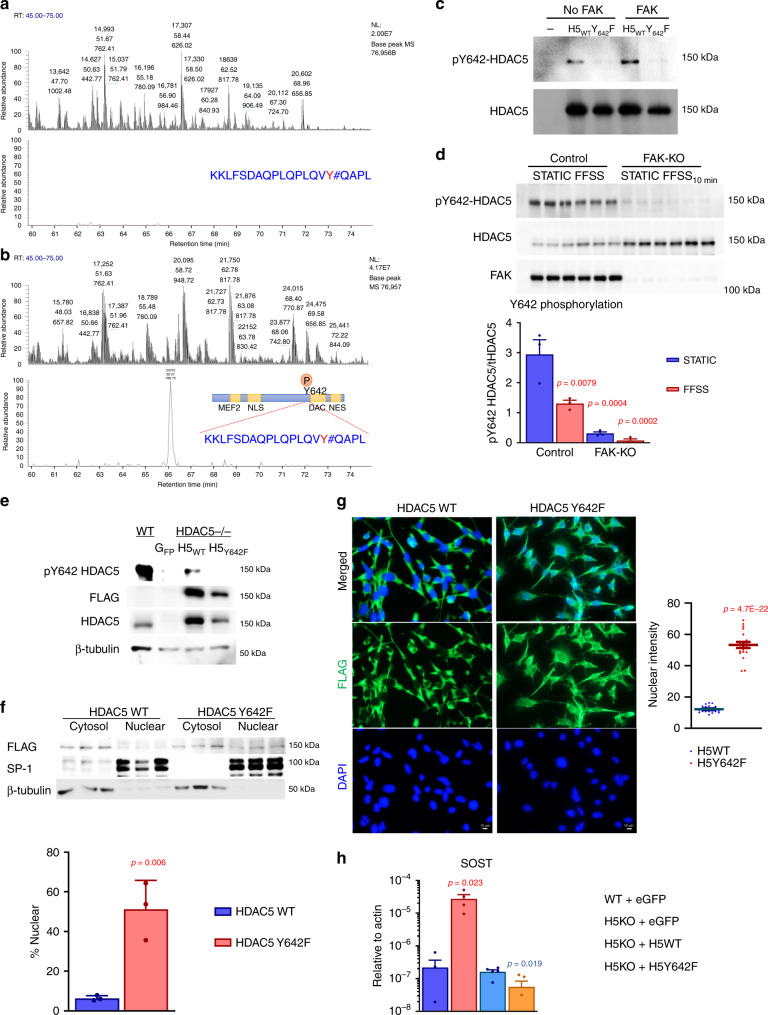
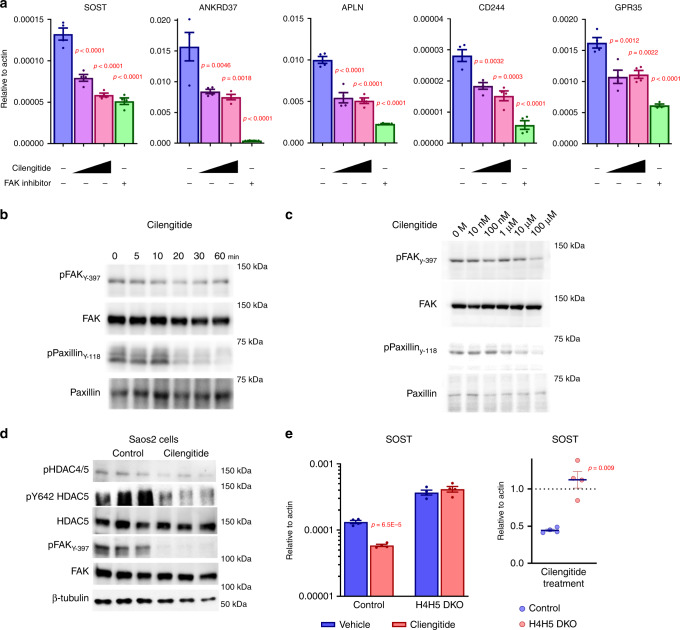
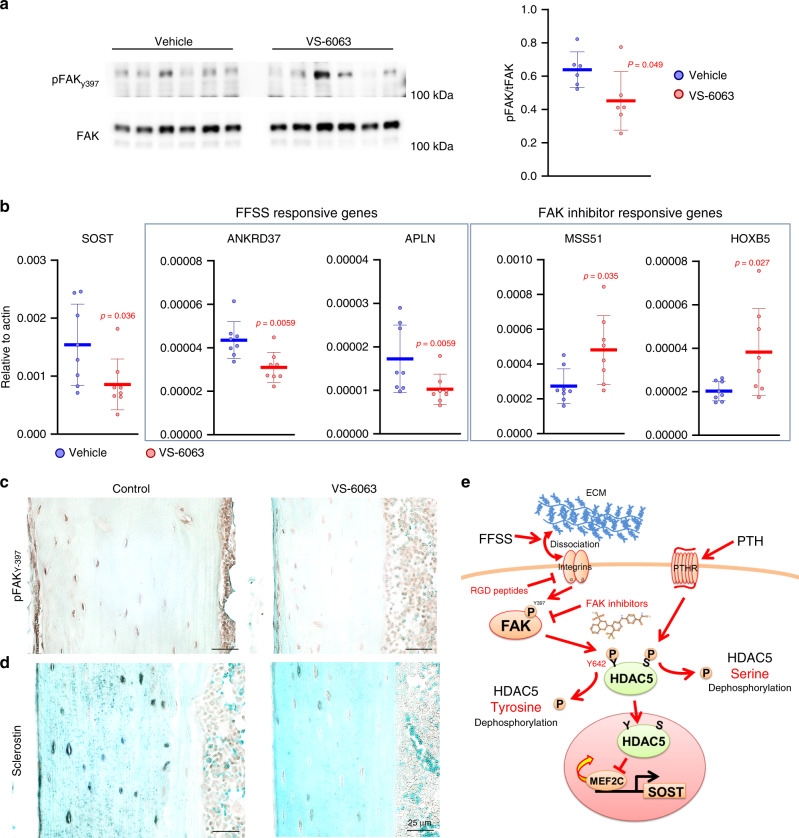
Osteocytes, cells ensconced within mineralized bone matrix, are the primary skeletal mechanosensors. Osteocytes sense mechanical cues by changes in fluid flow shear stress (FFSS) across their dendritic projections. Loading-induced reductions of osteocytic Sclerostin (encoded by Sost) expression stimulates new bone formation. However, the molecular steps linking mechanotransduction and Sost suppression remain unknown. Here, we report that class IIa histone deacetylases (HDAC4 and HDAC5) are required for loading-induced Sost suppression and bone formation. FFSS signaling drives class IIa HDAC nuclear translocation through a signaling pathway involving direct HDAC5 tyrosine 642 phosphorylation by focal adhesion kinase (FAK), a HDAC5 post-translational modification that controls its subcellular localization. Osteocyte cell adhesion supports FAK tyrosine phosphorylation, and FFSS triggers FAK dephosphorylation. Pharmacologic FAK catalytic inhibition reduces Sost mRNA expression in vitro and in vivo. These studies demonstrate a role for HDAC5 as a transducer of matrix-derived cues to regulate cell type-specific gene expression.


Conflict of interest statement

M.N.W. and H.M.K. receive research funding from Radius Health and Galapagos NV. D.L. has received research funding from Boehringer Ingelheim, Indalo Therapeutics and Unity Biotechnology, and has financial interests in Mediar Therapeutics and Zenon Biotech. The remaining authors declare no competing interests.

Figures

Fig. 1
Fig. 1. Class IIa HDACs are required for loading-induced bone formation.
a WT, HDAC4-cKO (HDAC4flfl;DMP1-cre), HDAC5-KO, and H4H5-DKO mice were subjected in vivo cantilever bending of the right tibia. Each mouse underwent a 3-week regimen (3 days/week, 100 cycles/day, 2500 µε peak normal strain), and dynamic histomorphometry was performed on the tibia mid-shaft. Calcein labeling was performed at 2 days and 11 days prior to sacrifice. Exogenous loading significantly increased p.BFR in WT, HDAC4-cKO, and HDAC5 KO compared with contralateral tibiae. No significant p.BFR elevation observed in H4H5-DKO mice compared with contralateral tibiae (n = 5–9 mice per group). p.SL (periosteal single-labeling surface), p.DL (periosteal double-labeling surface), pMAR (periosteal mineral apposition rate), p.MS (periosteal mineralizing surface), p.BFR (periosteal bone-mineral formation rate), WT (wild-type mice), H5KO (HDAC5−/−), H4KO (HDAC4flfl;DMP1-cre), DKO (H4H5-DKO, HDAC5−/−; HDAC4fl/fl;DMP1-cre). b Sclerostin immunohistochemistry (IHC) was performed in WT and H4H5-DKO mice (n = 3). High-magnification images show representative images of sclerostin-positive and -negative cells in cortical bones. c All transverse sections were counted by ImageJ. Sclerostin-positive cells numbers are normalized by entire osteocyte number. (n = 3 mice per group) P-values vs control (contralateral tibia). d qRT-PCR analyses from bone marrow-flushed tibias of WT and H4H5-DKO mice. Exogenous loading significantly reduced Sost mRNA expression in WT, but not H4H5-DKO mice. (n = 4) P-values vs contralateral tibia. e, f Non-phospho (active) β-catenin IHC in WT and H4H5-DKO mice. Exogenous loading increased active β-catenin staining in periosteal cells of WT, but not in H4H5-DKO mice. Each experiment was repeated three times. (n = 3 mice per group) P-values vs control (contralateral tibia) are shown in the figure. Two-sided unpaired t test was used (a, c, d, f). Data are expressed as mean ± SEM. Source data are provided as a Source Data file.
Fig. 2
Fig. 2. Fluid-flow shear stress (FFSS) regulates Sost expression through HDAC4/5 nuclear translocation and changes in FAK/integrin signaling.
a WT, HDAC4 KO, HDAC5-KO, and HDAC4/HDAC5 (H4H5) DKO Ocy454 cells were treated plus/minus FFSS for 3 h, followed by RT-qPCR for Sost. FFSS for 3 h reduced Sost expression in WT cells to a greater degree than in H4H5-DKO cells. P-values vs STATIC condition. Absolute SOST expression data are shown in the left panel (n = 4 cells per group for control and DKO, n = 3 cells per group for H4KO and H5KO). The right panel shows the ratio of SOST comparing FFSS versus static-treatment within each cell line. P-values adjusted for multiple comparisons (versus control) are shown in the right panel. b, c HDAC5-deficient Ocy454 cells infected with FLAG-tagged HDAC5 were subjected to FFSS (3 h) followed by immunocytochemistry staining for HDAC4/5 and then confocal microscopy. Pictures show a representative image of each condition. HDAC5 (green, localization determined by anti-FLAG immunostaining), endogenous HDAC4 (red), and DAPI (blue). The nuclear densitometric intensity of FLAG-HDAC5 and endogenous HDAC4 were measured by ImageJ. P-values vs STATIC condition (n = 15 cells for STATIC, n = 21 cells for HDAC5 FFSS, n = 29 cells for HDAC4 FFSS). Each experiment was repeated three times. d Ocy454 cells were subjected to FFSS for the indicated times and subjected to subcellular fractionation followed by immunoblotting. The nuclear fraction of endogenous HDAC5 and HDAC4 was quantified by densitometry over time. (n = 3 biologic cell replicates were performed) P-values for each time point versus 0 min are shown in the right panel. e Volcano plot showing up- and downregulated genes by RNA-seq by FFSS treatment for 3 h in Ocy454 cells. Blue dots represent significantly regulated genes (log2 fold change (FFSS/STATIC) < −1 or >1, FDR < 0.05), black dots represent genes whose expression is not significantly regulated by FFSS. Sost gene was confirmed as a downregulated gene. f Control and HDAC4/5-deficient Ocy454 cells were treated plus/minus FFSS for 3 h followed by RNA-seq. Volcano plots as in e are shown. The majority of FFSS-induced DEGs are not regulated in cells lacking HDAC4/5. g Gene ontology analysis of FFSS-regulated genes showed enrichment of pathways linked to integrin/FAK signaling (matrix cellular components). In this graph, the x axis corresponds to the gene ontology enrichment score (adjusted P-value) for genes differentially expressed in response to FFSS. h Upstream analysis suggests that FAK and PYK2 are potential upstream candidate regulators of the coordinated gene expression changes seen by RNA-seq in response to FFSS. In this graph, the x axis corresponds to the upstream analysis score (adjusted P-value) for genes that were differentially expressed in response to FFSS. Listed in the figure are the FFSS-induced DEGs found in the upstream FAK-dependent “signature”. One-sided a, d and two-sided c unpaired t test, and one-way analysis of variance (ANOVA) followed by Tukey–Kramer post hoc test (a in the right panel) were used. Data are expressed as mean ± SEM. Source data are provided as a Source Data file.
Fig. 3
Fig. 3. FAK is required for FFSS-induced gene expression changes in osteocytes.
a Left, Sost mRNA expression was assessed after treatment with FAK inhibitors (PF562271, VS-6063, and PF431396) for 4 h (n = 2 biologic replicates were performed). All FAK inhibitor treatments reduced Sost mRNA expression in Ocy454 cells grown in static conditions. Right, cell viability was measured after 4 h treatment with the indicated FAK inhibitors (n = 4 biologic cell replicates were performed). Data are shown with each measured value and best fit curve. b Single-cell FAK-KO cells were generated by CRISPR-Cas9. Protein expression of FAK, p-paxillin (Y118), and paxillin in control and FAK gene deleted (FAK-KO) Ocy454 cells. Phospho-paxillin was significantly decreased in FAK-KO cells. Each experiment was independently repeated three times. c, d Control and FAK-KO cells were as indicated for 3 h followed by RT-qPCR analysis for Sost. For PTH treatments, cells were treated under static condition at a PTH 1–34 concentration of 242 nM. While basal Sost levels are reduced in FAK-KO cells, there is no further decrease in response to FFSS. In contrast, PTH further suppresses SOST in FAK-deficient cells. (n = 4 biologic cell replicates were performed for RNA analysis) P-values adjusted for multiple comparisons are shown versus STATIC condition in control cells. e RNA-seq analyses were performed with control and FAK-KO cells treated for 3 h with/without FFSS. Volcano plots representing the effects of FFSS in each cell type (control and FAK-KO) are shown. Differentially expressed genes (DEGs, log2FC > 1 or < −1, FDR < 0.05) are shown as blue points. While many DEGs are noted in response to FFSS in control cells, very few FFSS-induced DEGs are detected in FAK-KO cells. f Genes whose expression was significantly changed by FFSS in control and FAK-KO cells. g Most FFSS-regulated gene expression changes require the presence of FAK. Heatmap of expression values for DEGs, shown as Z scores of log2(CPM) values for a given gene across all samples. Rows, genes; columns, samples of control and FAK-KO single-cell clones. One-way ANOVA followed by Tukey–Kramer post hoc test was used (c, d). Data are expressed as mean ± SEM. Source data are provided as a Source Data file.
Fig. 4
Fig. 4. FFSS reduces FAK activity, and FAK inhibitors mimic effect of FFSS.
a Protein expression of phospho-FAK (Y397), p-paxillin (Y118), and paxillin in Ocy454 cells exposed to FFSS for the indicated times. Phospho-FAK (Y397) was significantly decreased by FFSS within 10 min, and paxillin (the substrate of FAK) phosphorylation was decreased at later time points. b Dose responses of FAK inhibitors (PF562271 and VS-6063) on Ocy454 cells. FAK inhibitors were treated with indicated concentrations for 1 h. FAK inhibitors significantly reduced phospho-FAK (y-397) activity. Immunoblotting data are quantified in the bottom graph (n = 2 biologic protein replicates were performed). Data are shown with each measured value and best fit curve. c Control and HDAC4/5 compound mutant (H4H5-DKO) cells were treated plus/minus FAK inhibitors for 4 h followed by SOST RT-qPCR. H4H5-DKO cells fail to suppress SOST in response to FAK inhibitor treatment. (n = 4 RNA replicates for control, and n = 3 RNA replicates for H4H5-DKO were performed) P-values adjusted for multiple comparisons vs control are shown. d A volcano plot of RNA-seq analysis with FAK inhibitor, PF562271. RNA-seq analysis was performed with Ocy454 cells by vehicle and PF562271 treatment for 4 h. Significant genes were determined as log2FC > |1| and FDR < 0.05. e A Venn diagram of significantly changed genes among FFSS, FAK inhibitor (PF562271), and FAK gene deletion. FFSS was performed for 3 h with Ocy454 cells infected with a mock sgRNA-expressing lentivirus. Control uninfected Ocy454 cell were treated with FAK inhibitor for 4 h. FAK gene deletion was carried out by CRISPR-Cas9, and single-cell FAK-KO cell line was generated from bulk FAK-KO cell lines with puromycin selection. f A Pearson correlation matrix heatmap of RNA-seq analysis. Ocy454 cells were treated with/without FFSS, with/without FAK inhibitor (PF562271), and with/without FAK gene deletion by CRISPR-Cas9. One-way ANOVA followed by Tukey–Kramer post hoc test were used (c). Data are expressed as mean ± SEM. Each experiment was repeated three times (a, b). Source data are provided as a Source Data file.
Fig. 5
Fig. 5. FAK-mediated class IIa HDACs tyrosine phosphorylation is regulated by FFSS.
a Immunoprecipitation by anti-phosphotyrosine (referred to as “p-Y-1000” throughout) antibody. FFSS was performed for 10 min with Ocy454 cells. Phosphotyrosine immunoprecipitation was performed on cell lysates treated as indicated, and protein expression was determined by western blotting. FFSS reduced HDAC4 and HDAC5 with p-Y-1000 immunoprecipitation. b FLAG immunoprecipitation was performed in HDAC5-deficient cells stably expressing FLAG-HDAC5, subjected to FFSS for times as indicated. phospho-HDAC5 was decreased in a time-dependent manner. c HEK293T cells were transfected with FLAG-HDAC4, then treated for one hour as indicated with PF562271 (10 µM) or vanadate (1 mM) followed by phosphotyrosine immunoprecipitation and then immunoblotting. Tyrosine-phosphorylated HDAC4 was increased by vanadate treatment and decreased by FAK inhibitor treatment. P-values adjusted for multiple comparisons vs control are shown. d FAK kinase activity was measured by ADP-Glo kinase assay. E4Y1 (poly(Glu)/poly(Tyr) ratio of 4:1) polypeptides were used as a control substrate of FAK tyrosine kinase. Increased FAK kinase activity was detected when recombinant human HDAC5 protein was used as a substrate. e Recombinant human HDAC5 and E4Y1 (a control substrate) were incubated with ɣ-32P-ATP and FAK tyrosine kinase for 1 h, then separate by SDS-PAGE followed by autoradiography. FAK treatment showed ɣ-32P-ATP-positive band at the expected HDAC5 recombinant protein size. f Kinase assay reactions as in e were separated by SDS-PAGE followed by immunoblotting as indicated. CBB indicates Coomassie Brilliant Blue stain. One-way ANOVA followed by Tukey–Kramer post hoc test was used (d). Data are expressed as mean ± SEM. Each experiment was repeated three times (a–c, e, f). Source data are provided as a Source Data file.
Fig. 6
Fig. 6. FAK-dependent HDAC5 Y642 phosphorylation controls HDAC5 function and SOST expression.
a, b Recombinant HDAC5 was phosphorylated in vitro by FAK followed by phospho-modification analysis by mass spectrometry. Tyrosine 642 on HDAC5 was phosphorylated in a FAK-dependent manner. Top panel: the total base peak chromatogram of the chymotrypsin digested HDAC5 in the absence of FAK treatment (a) or presence of FAK treatment (b). Bottom panel: extracted ion chromatogram for the m/z value (788.75) of the phosphorylated peptide KKLFSDAQPLQPLQVY#QAPL (# symbol represents phosphorylation) demonstrating the ability to detect the phosphorylated peptide upon FAK treatment (b). c 293T cells were transfected with FLAG-tagged WT and Y642F HDAC5 cDNAs followed by anti-FLAG immunoprecipitation and then elution with FLAG peptide. Eluted protein was then used as a substrate for in vitro kinase assays plus/minus recombinant FAK followed by immunoblotting as indicated. HDAC5 WT, but not Y642F mutant, is recognized by HDAC5 pY642 antibody. Each experiment was repeated three times. d Control and single-cell FAK-knockout cells were treated plus/minus FFSS (10 min) followed by immunoblotting as indicated. HDAC5 Y642 phosphorylation is reduced by FFSS, and dramatically reduced in FAK-mutant cells, as quantified in the bottom panel. (n = 3 biologic replicates for protein were performed) P-values adjusted for multiple comparisons vs control in STATIC conditions are shown. e HDAC5-deficient Ocy454 cells were reconstituted with FLAG-tagged lentiviral constructs followed by immunoblotting as indicated. f Lentiviral reconstituted HDAC5-deficient cells were subjected to subcellular fractionation followed by immunoblotting as indicated. The percentage of the total FLAG-HDAC5 (WT or Y642F) in the nuclear fraction was measured by densitometry. (n = 3 biologic replicates for protein were performed) P-values vs HDAC5 WT. g Cells as in f were subjected to anti-FLAG immunocytochemistry. Nuclear FLAG intensity was quantified (n = 20 cells were analyzed). HDAC5Y642F shows increased nuclear localization compared to HDAC5WT grown under identical conditions. h Cells as in f were grown at 37 °C for 14 days. RNA was isolated for RT-qPCR. HDAC5-deficient cells show increased SOST expression which is reduced to a greater extent by HDAC5Y642F than HDAC5WT reconstitution. (n = 4 biologic replicates for RNA for WT + eGFP and H5KO + eGFP) P-values (red) vs WT + eGFP. (n = 5 biologic replicates for RNA for H5KO + H5WT and H5KO + H5Y642F) P-values (blue) vs H5KO + H5WT. Two-sided unpaired t test (f, h) and one-way ANOVA followed by Tukey–Kramer post hoc test (d) were used. Data are expressed as mean ± SEM. Source data are provided as a Source Data file.
Fig. 7
Fig. 7. RGD peptide blocks FAK activity and reduce Sost in a HDAC4/5-dependent manner.
a Ocy454 cells were treated with cilengitide (10 µM and 50 µM) or PF562271 (10 µM) for 4 h, followed by RT-qPCR for FFSS-regulated genes as indicated. Both cilengitide and PF562271 regulate expression of FFSS-responsive genes. (n = 4 biologic replicates for RNA) P-values adjusted for multiple comparisons vs controls are shown. b Cells were treated with cilengitide (50 µM) for the indicated times followed by immunoblotting. c Cells were treated with the indicated doses of cilengitide (1 h) followed by immunoblotting. pHDAC4/5 immunoblotting was performed using an antibody that recognizes HDAC4 pS246 and HDAC5 pS259. d Saos2 cells were treated with cilengitide (100 µM) for 60 min followed by immunoblotting. e WT and HDAC4/5 double-knockout (H4H5-DKO) cells were treated with vehicle or cilengitide (50 µM) for 4 h followed by Sost RT-qPCR. Cilengitide treatment decreased Sost expression in control cells, but not in H4H5-DKO cells. (n = 4 biologic replicates for RNA) P-values vs control in the left and right panels. Two-sided unpaired t test e and one-way ANOVA followed by Tukey–Kramer post hoc test (a) were used. Data are expressed as mean ± SEM. Each experiment was repeated three times (bd). Source data are provided as a Source Data file.
Fig. 8
Fig. 8. FAK inhibitors reduce osteocytic Sost expression in vivo.
a FAK inhibitor (VS-6063) was administrated by single intraperitoneal injection (60 mg kg−1), and liver protein lysates were collected 5 h later and then subjected to immunoblotting as indicated. P-values vs vehicle. N = 6. b Cortical bone RNA was isolated after acute VS-6063 treated followed by RT-qPCR as indicated. FAK inhibitor significantly regulated expression of FFSS- and FAK inhibitor-sensitive transcripts. FFSS-responsive genes are those that were regulated by FFSS in vitro in our RNA-seq results. FAK inhibitor responsive genes are those that were upregulated by PF562271 in vitro in our RNA-seq results. P-values vs vehicle, n = 8 mice. c, d Immunohistochemistry was performed on tibia samples from mice in (a) and (b). Immunohistochemistry of mouse long bone. c phospho-FAK (Y397) and d Sclerostin levels were downregulated by FAK inhibitor treatment. e Model demonstrating the effects of fluid-flow shear stress (FFSS)-mediated gene regulation in osteocytes, see text for details. Data are expressed as mean ± SEM. Each experiment was repeated three times (c, d). Source data are provided as a Source Data file.

References

    1. Ozcivici E, et al. Mechanical signals as anabolic agents in bone. Nat. Rev. Rheumatol. 2010;6:50–59. - PMC - PubMed
    1. Tatsumi S, et al. Targeted ablation of osteocytes induces osteoporosis with defective mechanotransduction. Cell Metab. 2007;5:464–475. - PubMed
    1. Bonewald LF, Johnson ML. Osteocytes, mechanosensing and Wnt signaling. Bone. 2008;42:606–615. - PMC - PubMed
    1. Schaffler MB, Cheung WY, Majeska R, Kennedy O. Osteocytes: master orchestrators of bone. Calcif. Tissue Int. 2014;94:5–24. - PMC - PubMed
    1. Bonewald LF. The amazing osteocyte. J. Bone Min. Res. 2011;26:229–238. - PMC - PubMed

Publication types

Substances