. 2020 Jul;583(7814):66-71.
doi: 10.1038/s41586-020-2433-3. Epub 2020 Jul 1.

Chemical gradients in human enamel crystallites

Affiliations

Chemical gradients in human enamel crystallites

Karen A DeRocher et al. Nature. 2020 Jul.

Erratum in

Abstract

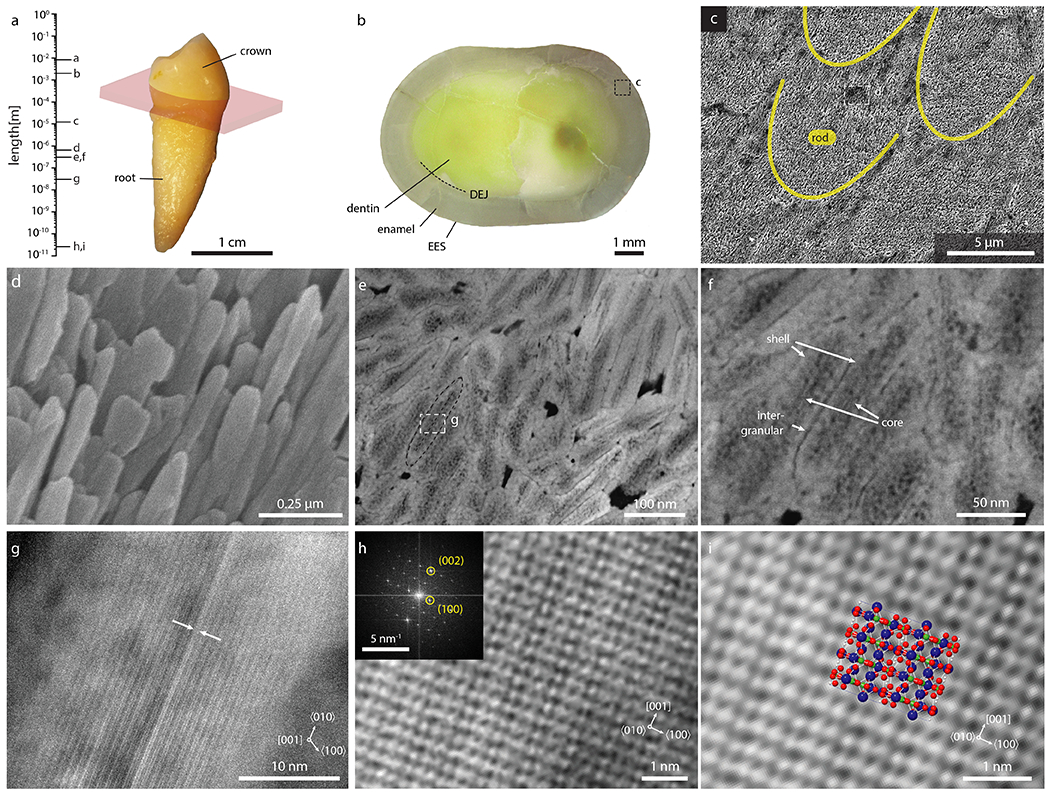
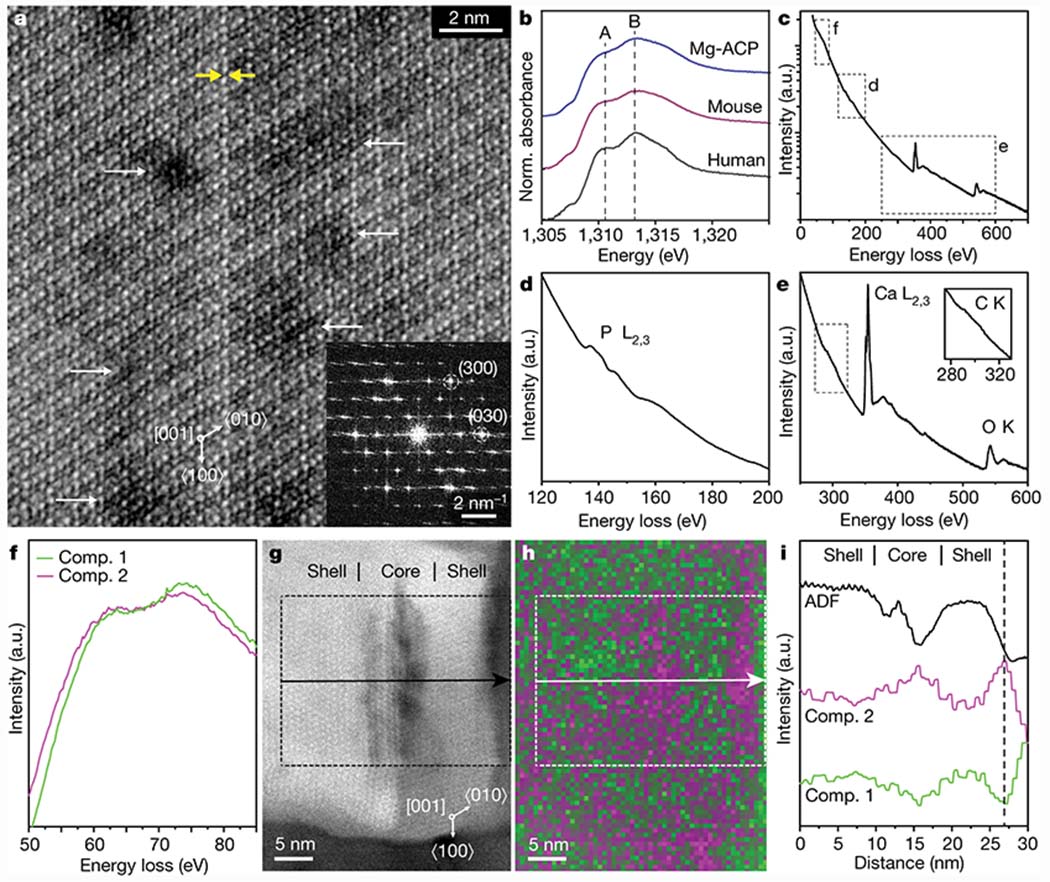
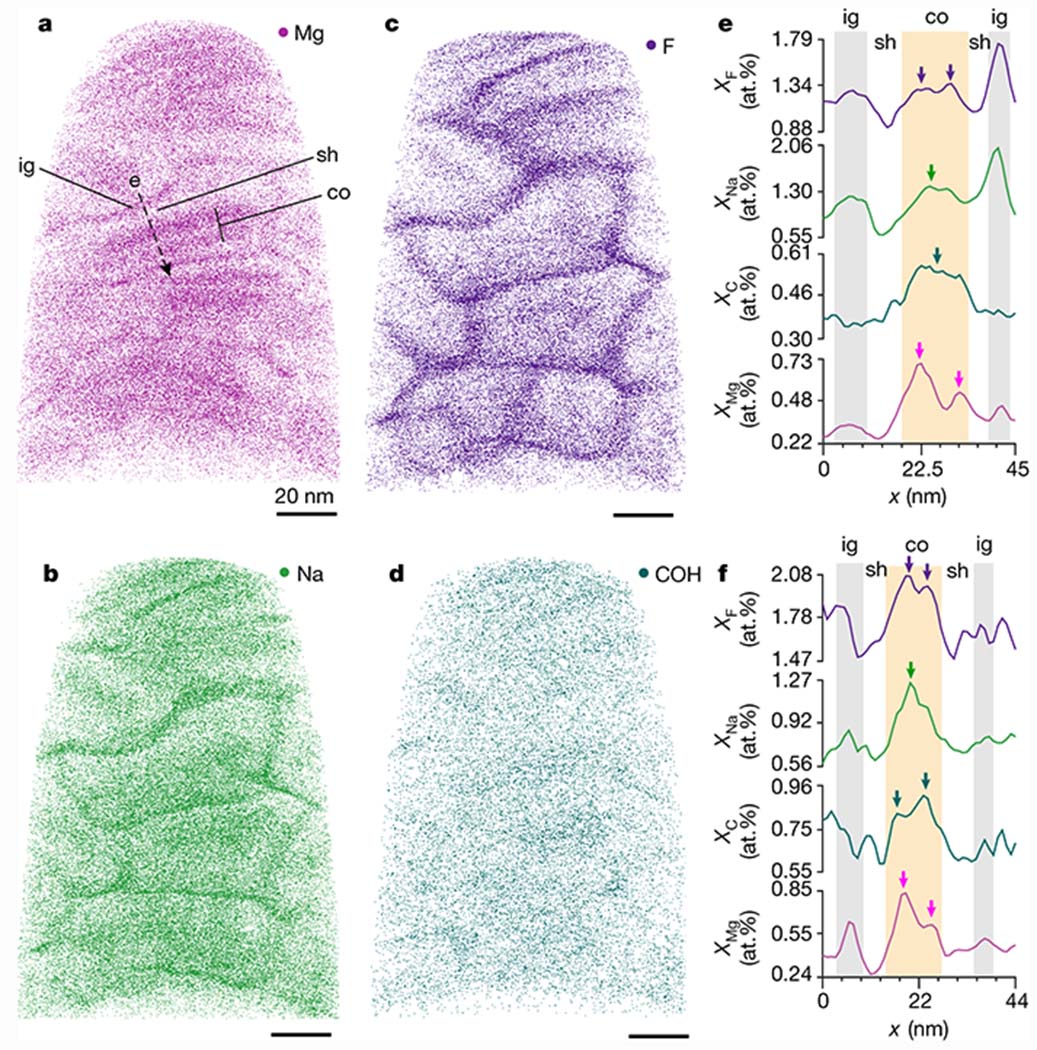
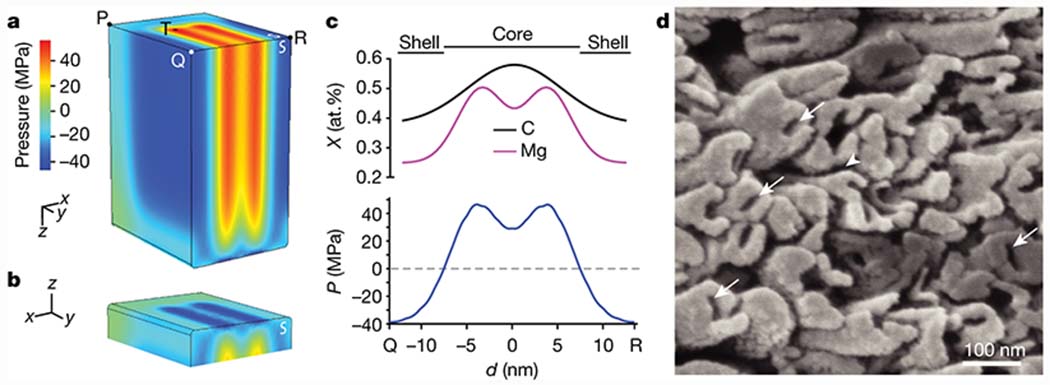
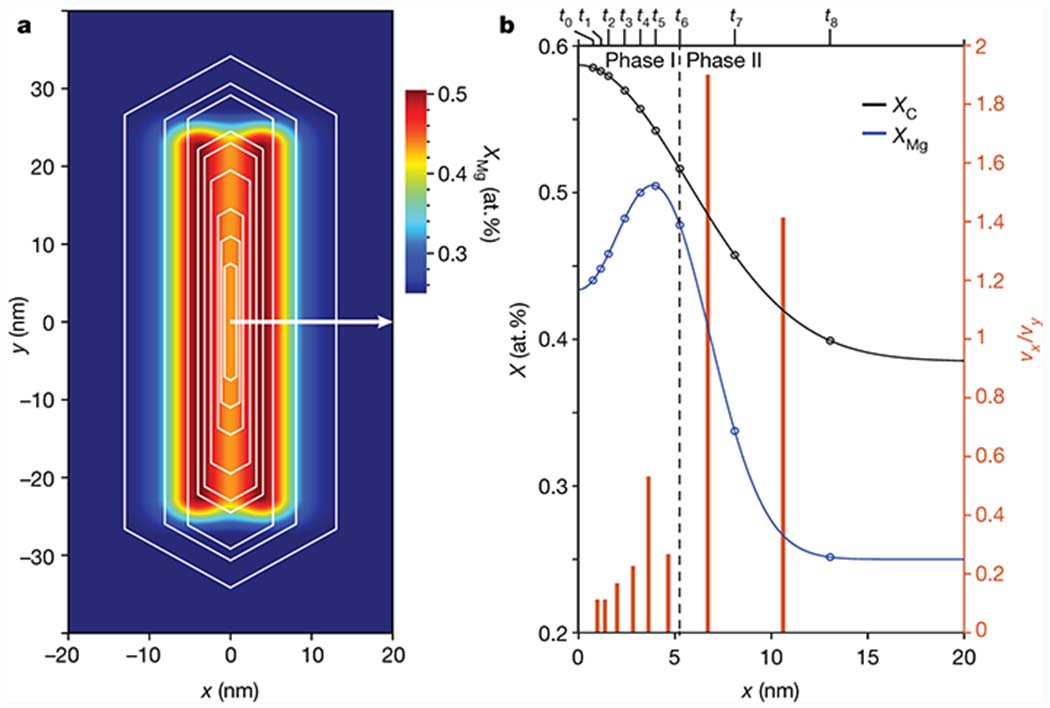
Dental enamel is a principal component of teeth1, and has evolved to bear large chewing forces, resist mechanical fatigue and withstand wear over decades2. Functional impairment and loss of dental enamel, caused by developmental defects or tooth decay (caries), affect health and quality of life, with associated costs to society3. Although the past decade has seen progress in our understanding of enamel formation (amelogenesis) and the functional properties of mature enamel, attempts to repair lesions in this material or to synthesize it in vitro have had limited success4-6. This is partly due to the highly hierarchical structure of enamel and additional complexities arising from chemical gradients7-9. Here we show, using atomic-scale quantitative imaging and correlative spectroscopies, that the nanoscale crystallites of hydroxylapatite (Ca5(PO4)3(OH)), which are the fundamental building blocks of enamel, comprise two nanometric layers enriched in magnesium flanking a core rich in sodium, fluoride and carbonate ions; this sandwich core is surrounded by a shell with lower concentration of substitutional defects. A mechanical model based on density functional theory calculations and X-ray diffraction data predicts that residual stresses arise because of the chemical gradients, in agreement with preferential dissolution of the crystallite core in acidic media. Furthermore, stresses may affect the mechanical resilience of enamel. The two additional layers of hierarchy suggest a possible new model for biological control over crystal growth during amelogenesis, and hint at implications for the preservation of biomarkers during tooth development.


Conflict of interest statement

Competing Interests:

The authors declare no competing interests.

Figures

Figure 1:
Figure 1:. The hierarchical architecture of human enamel.
a. Length scales of enamel in a human premolar. b. Section parallel to the mid-coronal cervical plane (indicated in pink in a). c. SEM image of keyhole-shaped cross-sections of enamel rods in lactic acid-etched outer enamel. d. SEM image of OHAp crystallites. e-g. STEM-ADF images of enamel crystallites in cross section, oriented approximately parallel to the [001] zone axis. The CDL (arrows) appears bright in ADF. h. Cryo-STEM-ADF lattice image of a crystallite oriented parallel to the [010] zone axis (inset: FFT). i. Close up of (h) with rendering of 2×2×2 OHAp supercell (Ca, blue; O, red; P, green; H, white).
Figure 2:
Figure 2:. Atomic scale structure and composition of human enamel crystallites.
a. Cs-corrected cryo-STEM ADF lattice image of the core of a single enamel crystallite oriented to the [001] zone axis, close to the CDL (yellow arrows). Inset: FFT. b. Mg-K edge XANES of human enamel and reference materials. Fit parameters are reported in Table S3. c-e. Cryo-STEM EEL spectra obtained from a region containing several enamel crystallites, with closeups of the P-L2,3 edge (d) and the Ca-L2,3, O-K, and C-K edges (e). f. MCR components contributing to feature near the Mg-L2,3 edge. g. Cryo-STEM ADF image of an enamel crystallite. h. Spatial intensity map of MCR components 1 (green) and 2 (magenta) in (g). i. Average intensity profile for the region of interest indicated in (g) and (h), in the direction of the arrow.
Figure 3:
Figure 3:. Chemical gradients in human enamel crystallites and the amorphous intergranular phase.
Rendering of Mg (a), Na (b), F (c), and COH (d) positions in a 3D reconstruction of fluoridated human enamel, viewed along the long axis of crystallites. Scale bars represent 20 nm. e. Concentration profiles of F (purple), Na (green), C (teal), and Mg (magenta) along the dashed line in (a). Profiles for n = 15 crystallites across 3 technical replicates are shown in Fig. S13a–o. f. Concentration profiles in a crystallite from a sample that had not been fluoridated. Profiles for n = 5 crystallites across 2 biological replicates are shown in Fig. S13p–t. Note that fluoridation increases the concentration of Na and F in the intergranular phase (ig, gray highlights) vs. the core (co, orange highlight), due to short circuit diffusion, whereas the concentration in the shell (sh) is not affected.[7]
Figure 4.
Figure 4.. Impact of substitution on mechanical and chemical properties of human enamel crystallites.
a. Rendering of the scalar pressure, calculated as one third of the trace of the stress tensor, as a measure of residual stress in an FE model of an enamel crystallite. Note that symmetric boundary conditions were applied to two faces (white “S”); values on these represent internal rather than surface stresses. b. View of (a) showing the free surface parallel to the (001) plane. c. Plot of the mole fractions of C (black) and Mg (magenta), and of the residual pressure (blue), against the distance from Q to R. d. SEM image of an acid-etched enamel section in which crystallites emerge end-on, displaying intergranular corrosion (arrowhead) and preferential dissolution of the core (white arrows).
Figure 5.
Figure 5.. A model for human enamel crystallite growth during amelogenesis.
a. Schematic drawing of growth stages (timepoints t0-t8) of human primary enamel crystallites (white hexagons, after Daculsi and Kerebel, Ref. [33]) superimposed on an idealized map of the Mg concentration based on observation of human permanent enamel crystallites reported herein. b. On the left y-axis, plot of the mole fraction of Mg (blue) and carbon(ate) (black, see Fig. S21 for map) against distance along the white arrow in (a). The open circles indicate the mole fractions at the interface of the growing crystallite at t0-t8. On the right y-axis, plot of the ratio of the average growth velocities in the x- and y-directions in successive time intervals (Table S9). Note that scaling of the time axis is unknown, and likely non-linear. As a consequence, absolute speeds cannot be determined and may vary.

References

    1. Nanci A, Ten Cate’s Oral histology : development, structure, and function, 7th ed., Mosby Elsevier, St. Louis, 2008.
    1. Chai H, Lee JJW, Constantino PJ, Lucas PW, Lawn BR, Proceedings of the National Academy of Sciences of the United States of America 2009, 106, 7289–7293. “Remarkable resilience of teeth”. - PMC - PubMed
    1. Klein OD, Duverger O, Shaw W, Lacruz RS, Joester D, Moradian-Oldak J, Pugach MK, Wright JT, Millar SE, Kulkarni AB, Bartlett JD, Diekwisch TGH, DenBesten P, Simmer JP, International Journal Of Oral Science 2017, 9, 1–7. “Meeting report: a hard look at the state of enamel research”. - PMC - PubMed
    1. Moradian-Oldak J, Frontiers In Bioscience 2012, 17, 1996–2023. “Protein-mediated enamel mineralization”. - PMC - PubMed
    1. Lacruz RS, Habelitz S, Wright JT, Paine ML, Physiological Reviews 2017, 97, 939–994. “Dental Enamel Formation and Implications for Oral Health and Disease.(Report)”. - PMC - PubMed

Publication types