. 2020 Jul;583(7815):253-258.
doi: 10.1038/s41586-020-2451-1. Epub 2020 Jul 1.

Structure and flexibility in cortical representations of odour space

Affiliations

Structure and flexibility in cortical representations of odour space

Stan L Pashkovski et al. Nature. 2020 Jul.

Erratum in

Abstract

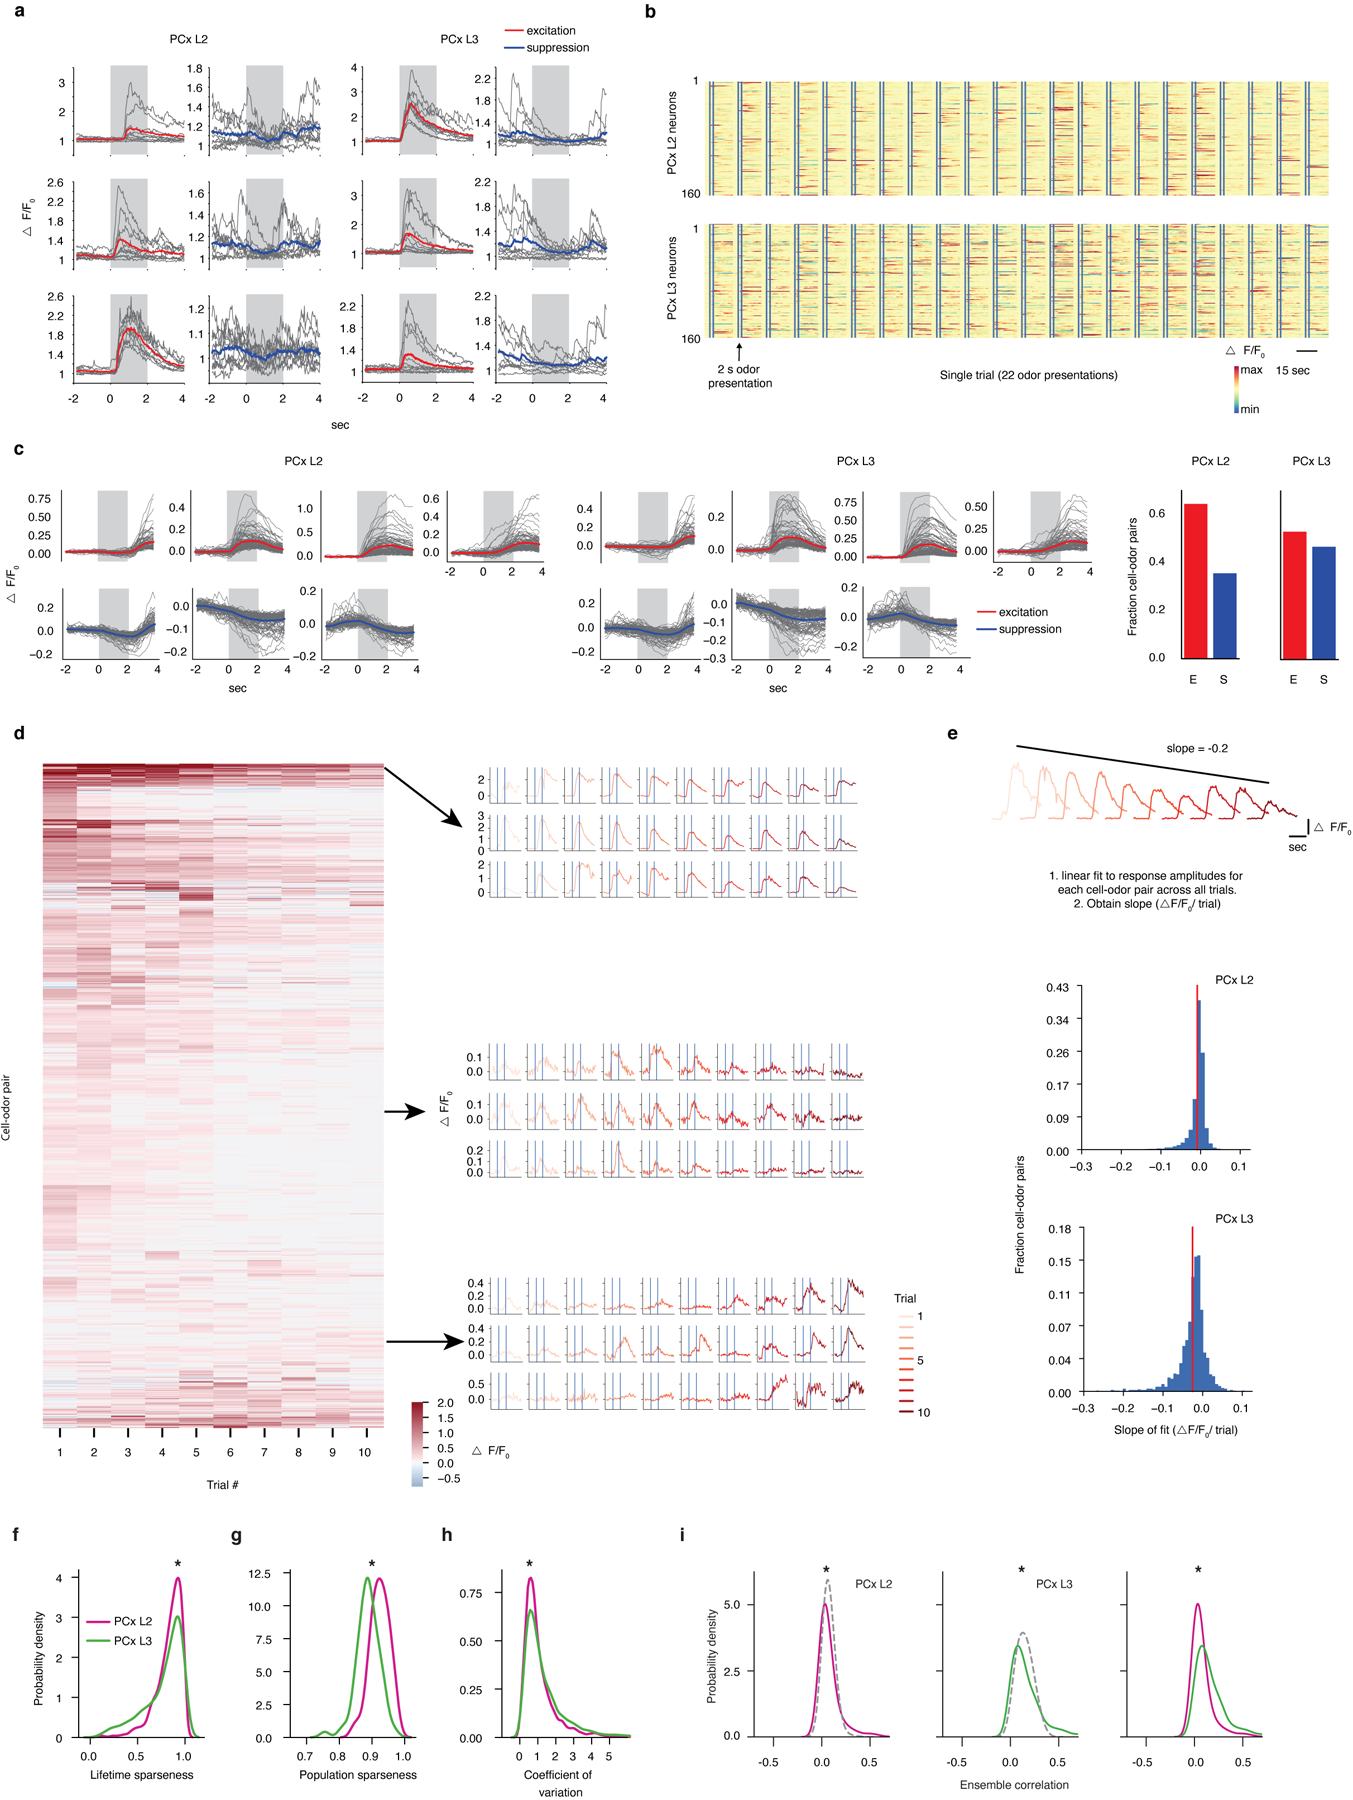
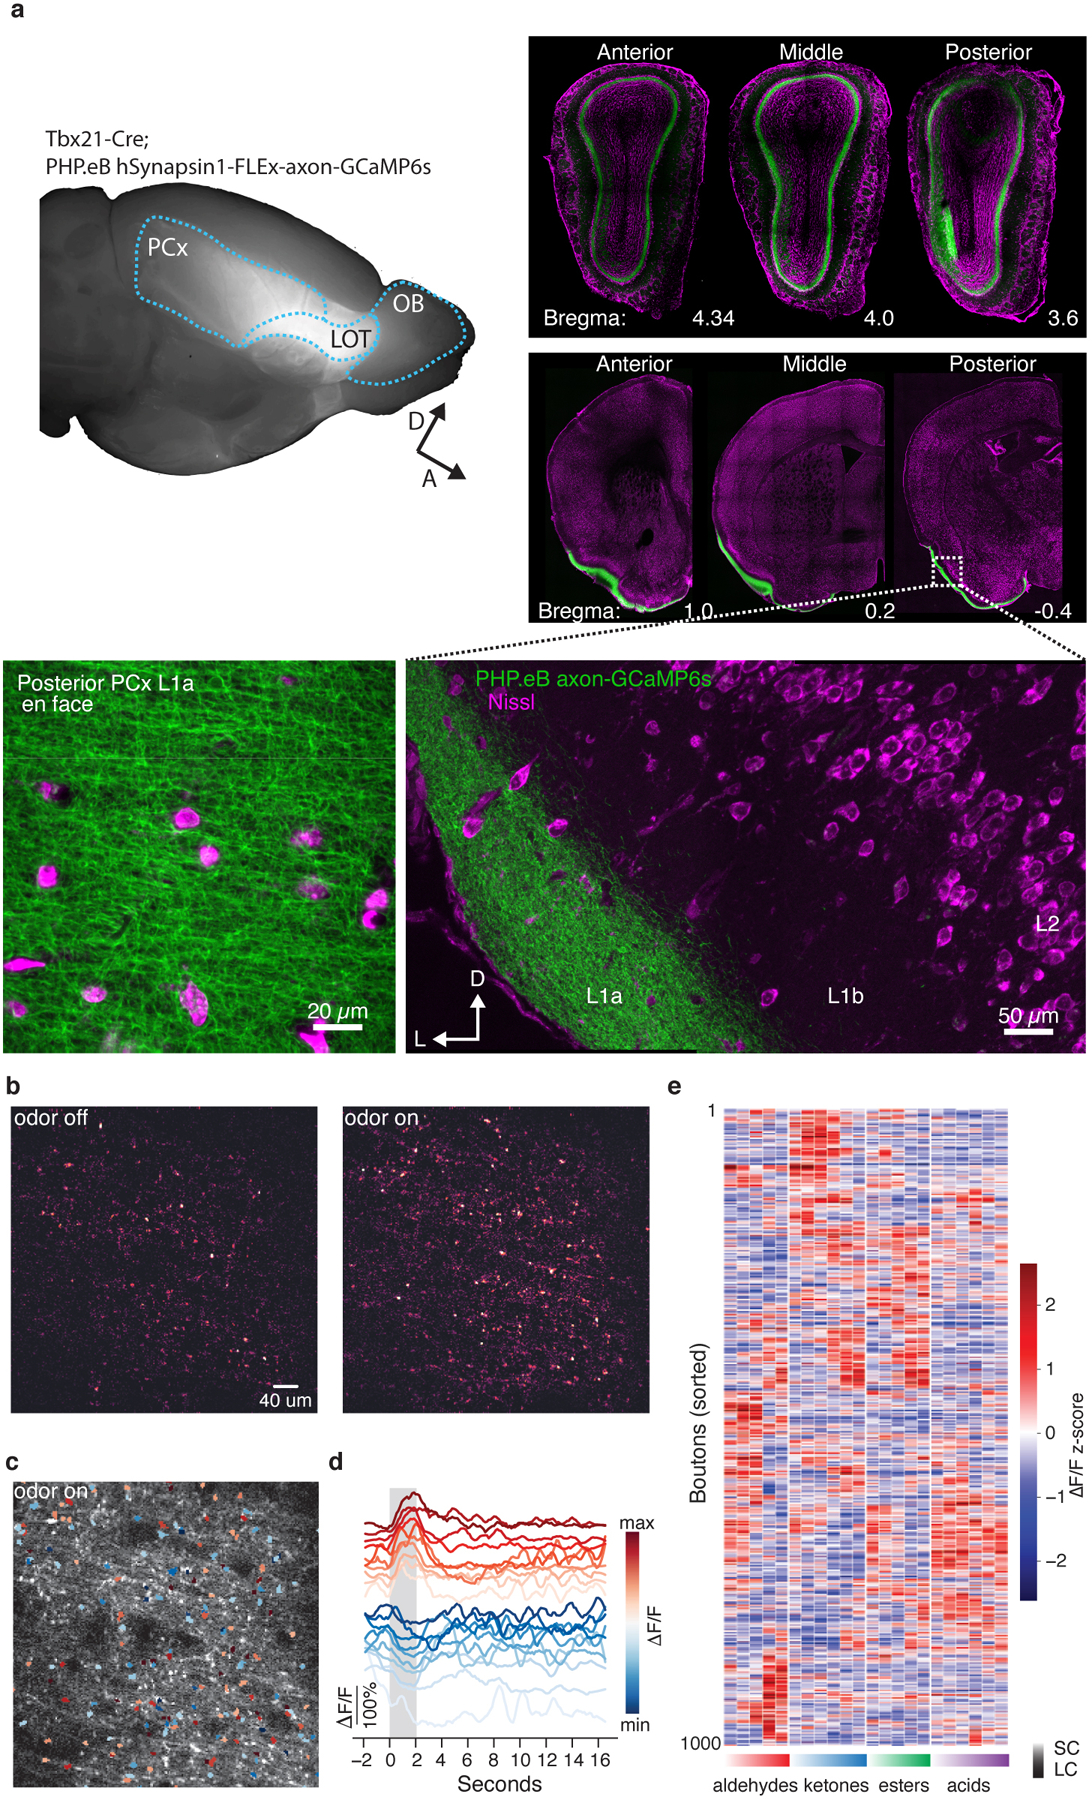
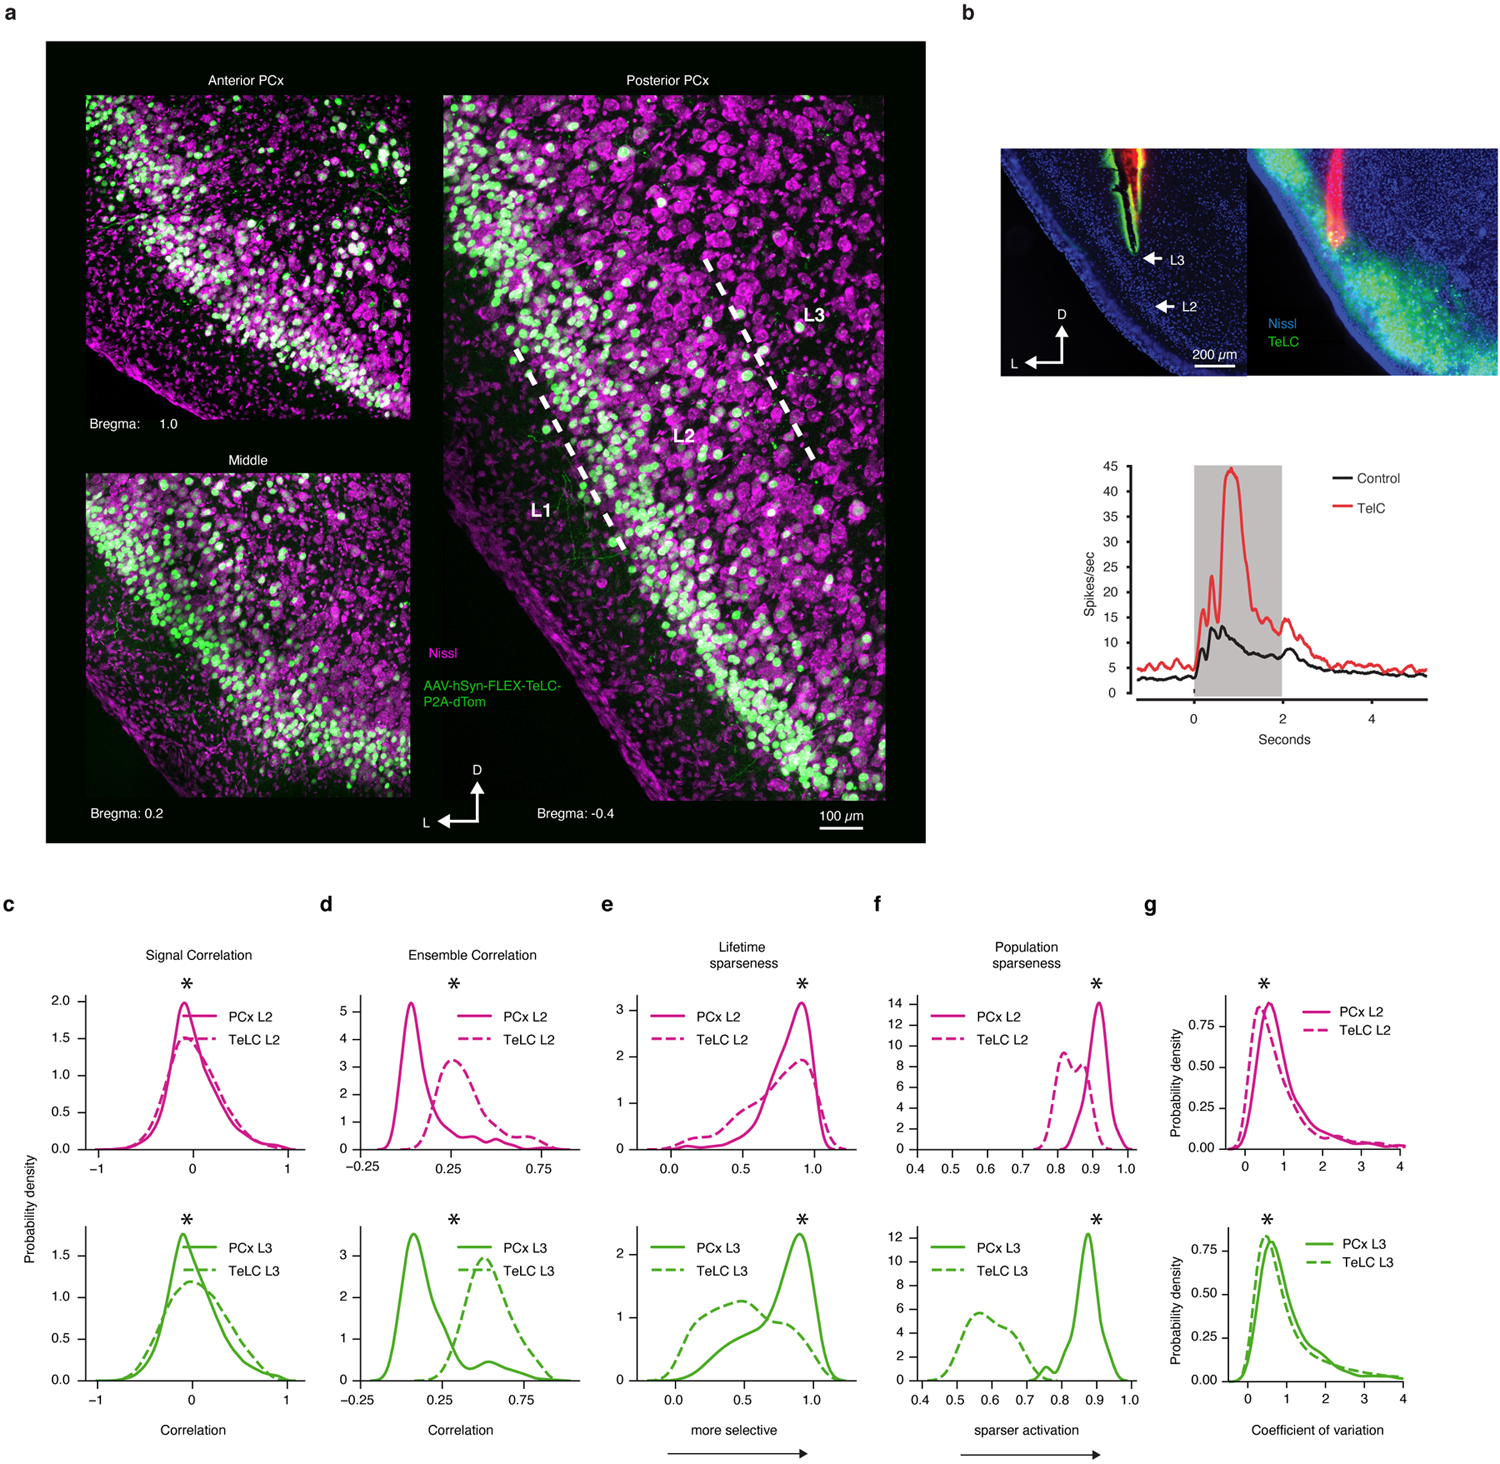
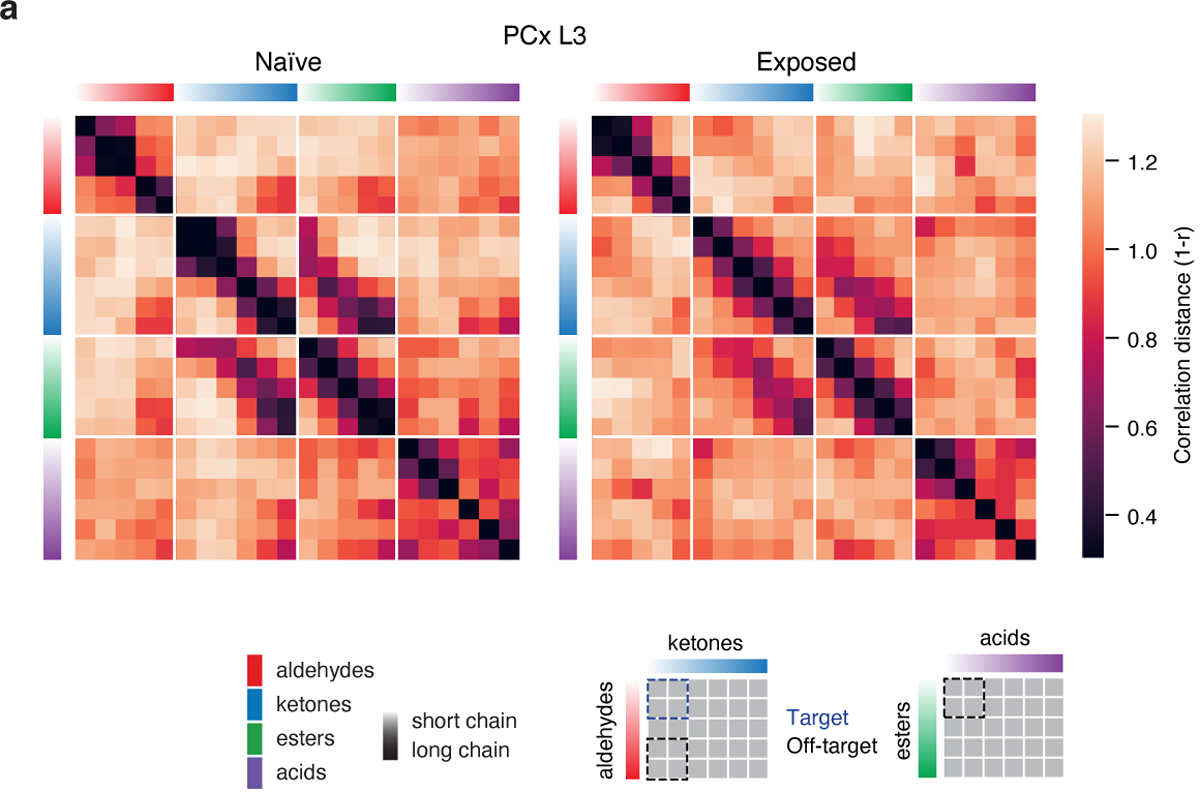
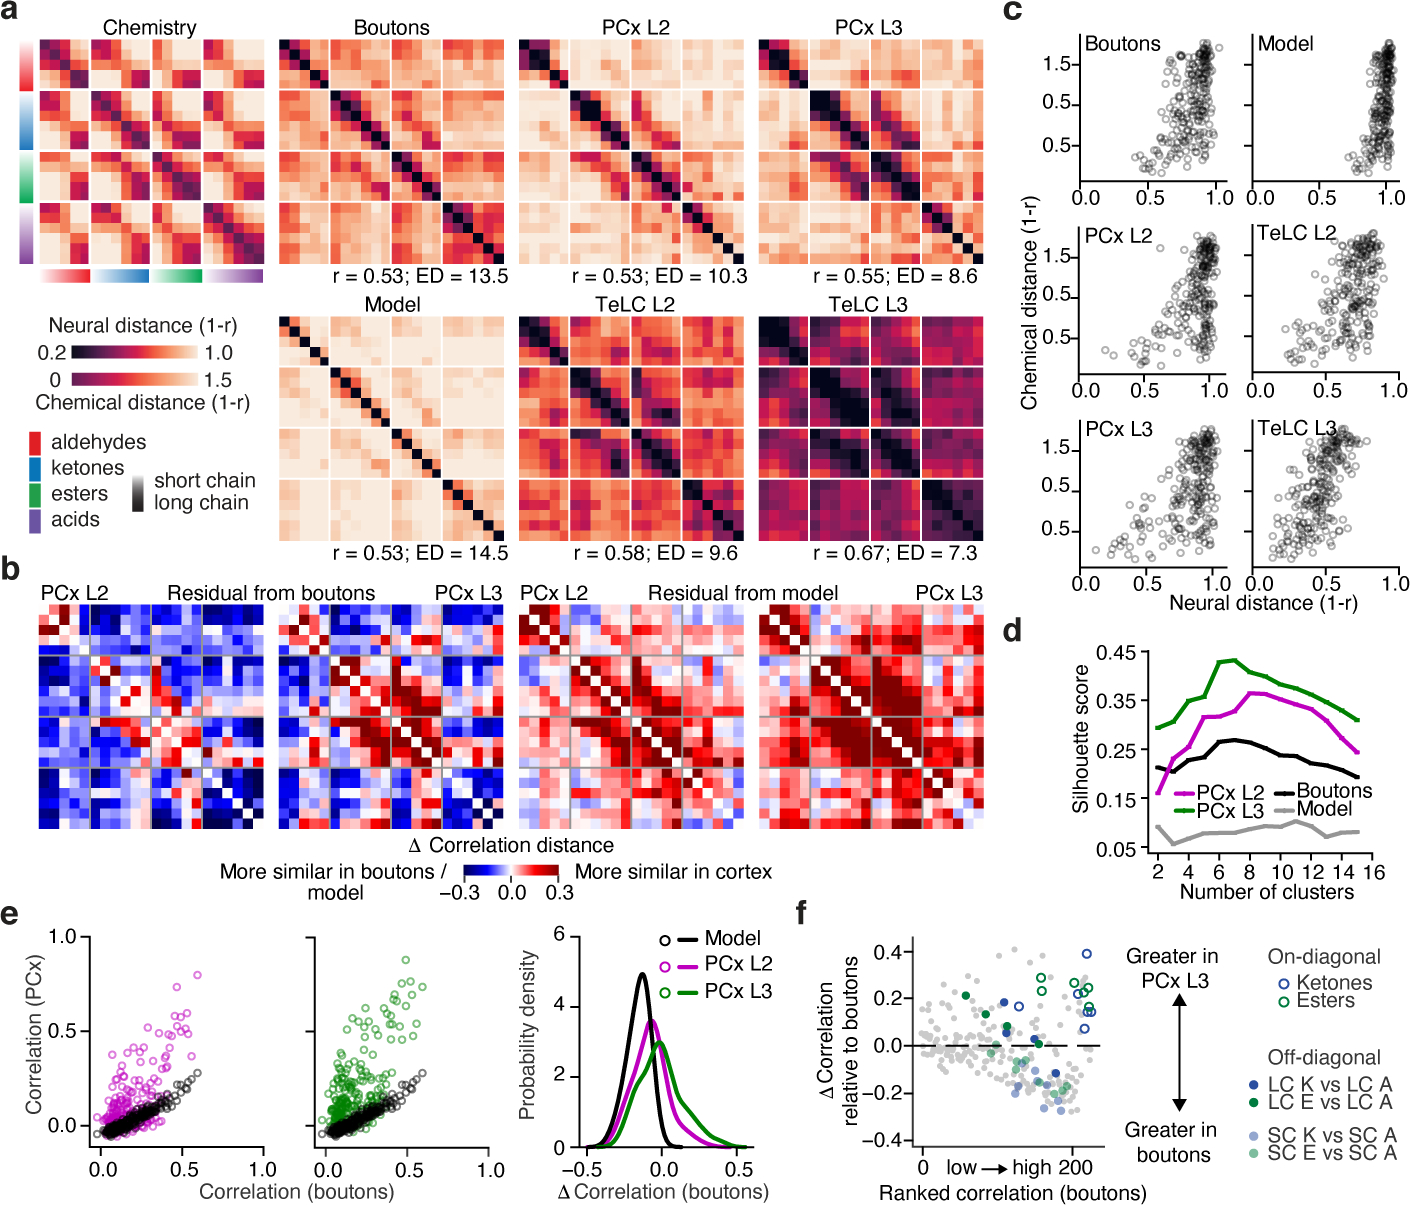
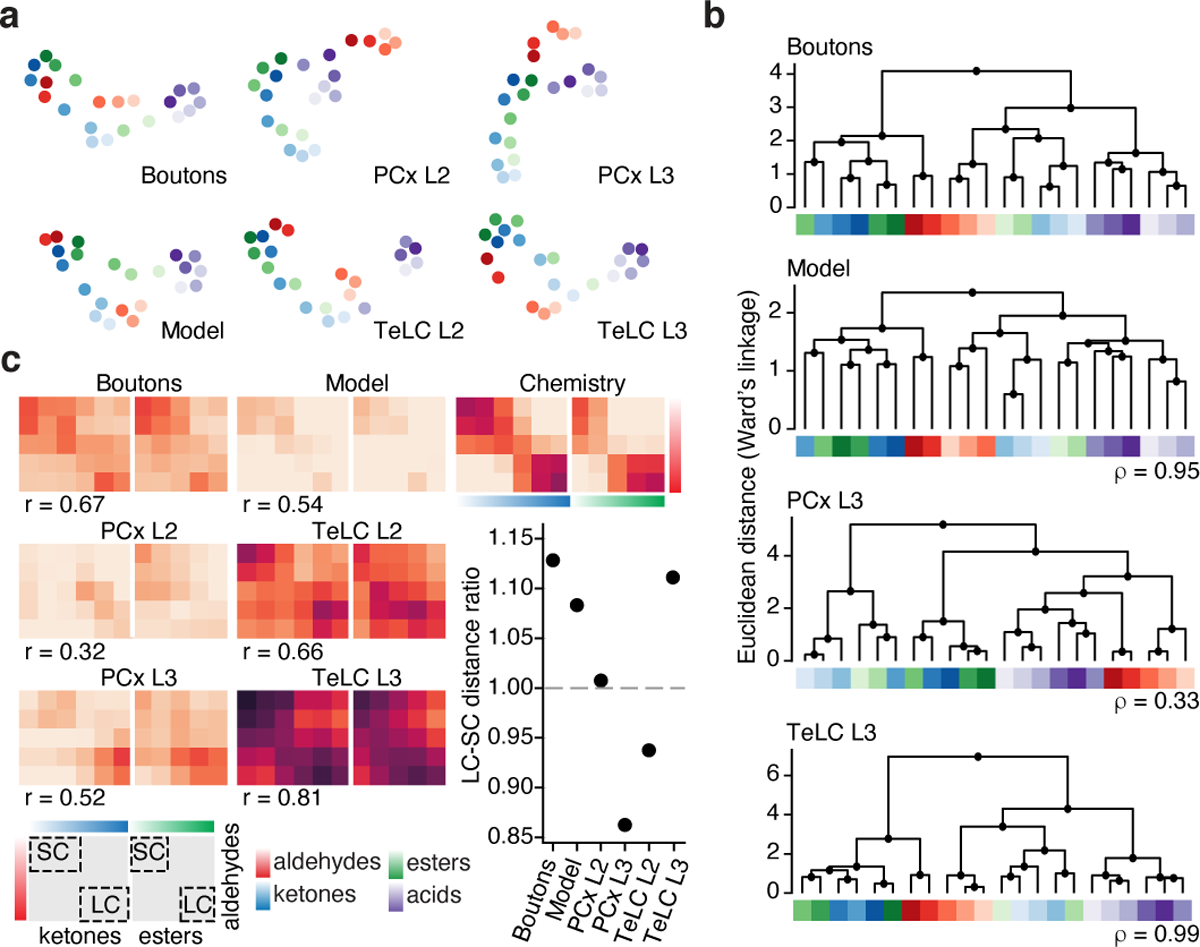
The cortex organizes sensory information to enable discrimination and generalization1-4. As systematic representations of chemical odour space have not yet been described in the olfactory cortex, it remains unclear how odour relationships are encoded to place chemically distinct but similar odours, such as lemon and orange, into perceptual categories, such as citrus5-7. Here, by combining chemoinformatics and multiphoton imaging in the mouse, we show that both the piriform cortex and its sensory inputs from the olfactory bulb represent chemical odour relationships through correlated patterns of activity. However, cortical odour codes differ from those in the bulb: cortex more strongly clusters together representations for related odours, selectively rewrites pairwise odour relationships, and better matches odour perception. The bulb-to-cortex transformation depends on the associative network originating within the piriform cortex, and can be reshaped by passive odour experience. Thus, cortex actively builds a structured representation of chemical odour space that highlights odour relationships; this representation is similar across individuals but remains plastic, suggesting a means through which the olfactory system can assign related odour cues to common and yet personalized percepts.


Conflict of interest statement

Authors declare no competing interests.

Figures

Extended Data Figure 1.
Extended Data Figure 1.. Volumetric population imaging of PCx L2 and L3 during wakefulness using rationally designed odor sets.
a, (Left), Cartoon of volumetric multiphoton imaging approach to characterize odor responses in PCx in wakeful, semi-paralyzed mice (see Methods). (Right), Approximate position of an imaging volume (green dotted line) in a typical experiment superimposed on a Nissl-stained coronal section through PCx. Scanning volumes were oriented to acquire similarly-sized cortical populations in L2 and L3 (red dotted lines), despite decreased neuron density in L3 (see Methods). Imaging was performed in the most anterior portion of the posterior PCx. b, Sample fields of view for a single imaging session. PCx L2 is depicted on top; PCx L3 on bottom. Segmentation masks associated with each layer are shown on the right. c, Global, clustered, and tiled odor sets superimposed on the collection of odors constituting odor space as defined by principal components analysis (see Methods). Global odors are indicated by black dots; tiled and clustered odor sets via the indicated color code d, Plot of the amount of molecular variance contributed by each additional principal component for each odor set in descriptor space; this analysis reveals that each odor set tiles odor space at a distinct level of resolution. e, Molecular structures and associated PID signals of the odors comprising the global, clustered, and tiled odor sets. These PID traces are shown to illustrate the controlled kinetics of the olfactometer only; because detector reports depend upon ability of an odor to be photo-ionized, the relative amplitudes of the traces between odors are not meaningful. For example, heavy aliphatics elicit a minimal PID response because their photo-ionization energies lie outside the range of the detector; however, odors with low/absent PID traces still induced cortical activity in 5–20% of the imaged population, consistent with effective odor delivery. Five odors are shared between the global and clustered odor sets. These are indicated by bold lettering (and in c, as black circles with colored edges). Color code as in c.
Extended Data Figure 2.
Extended Data Figure 2.. Odor responses in cortex are substantially altered by anesthesia.
a, (Left), EEG power spectral density plot from an individual subject depicting differences in cortical state between ketamine-medetomidine anesthesia and wakefulness (see Methods). Under anesthesia, the EEG signal is enriched in the delta band (0.5 – 4 Hz) at the expense of high frequency (40–100 Hz) gamma oscillations; in contrast, gamma frequency predominates over delta activity during wakfeulness. (Right) Summary of differences in EEG power content expressed as delta/gamma ratio during anesthesia and wakefulness averaged from 4 subjects. Error bars indicate SEM. b, Comparison of the fraction of responsive neurons (obtained from the population of neurons that respond to at least 1 odor during the wakefulness, see Methods) to the tiled odor set in the same field of view (obtained from PCx L2 and PCx L3) during the awake state and under anesthesia. Responses are defined according to auROC analysis (see Methods). Each dot represents a single odor (L2: 504 neurons, L3: 418 neurons). c, (Top), Black trace represents heart rate (average over 10 second, non-overlapping windows) recorded from an awake mouse in the home cage. Blue traces are example raw heart rate (HR) signal indicating the range of HR fluctuations observed during the awake state. The high variability in heart rates (which span ~350 to ~650 beats per minute) reflects ongoing behavior in the awake mouse. (Bottom), same as in the top panel, but for HR recorded during wakefulness and after induction of ketamine-medetomidine anesthesia (see Methods). Grey arrow indicates time of induction. Grey and Red rectangles and associated inset traces are 20-second segments of real-time heart-rate signal. During wakefulness, fluctuations in heart rate remain within a physiologically normal range of 300–500 beats per minute, without any detectible episodes of tachycardia (see Methods). Periodic dips in the recorded heart rate during wakefulness reflect moments when pharmacological agents are being administered, which briefly interrupts the heart rate monitor.
Extended Data Figure 3.
Extended Data Figure 3.. PCx L3 neurons exhibit denser, broader and more reliable odor responses than neurons in PCx L2
a, Examples of odor-evoked excitation and suppression in PCx. Each panel corresponds to a single cell-odor pair. Grey lines represent individual trials. Colored overlays represent trial-mean activity. Shaded grey rectangles delimit the odor presentation period. b, Trial-averaged population response raster depicting odor-evoked activity in response to 22 odors (global odor set) across L2 and L3. Responses are ΔF/F0 with redder colors indicating excitatory transients and bluer colors indicating odor-evoked suppression. x-axis is time; double vertical bars delimit 2-second odor presentation periods. c, Response types observed in L2 and L3 (clustered odor set). Individual panels correspond to clusters identified using a gaussian mixture model (see Methods). Grey traces correspond to trial-averaged cell-odor pairs. Colored overlays represent mean response time-course associated with each cluster. Right: fraction of all cell-odor pairs exhibiting excitation or suppression. d, Response amplitudes of cell-odor pairs obtained from PCx L3 depicted on a trial-by-trial basis. Each row represents a given neuron’s response to 10 consecutive presentations of the same odor. Neurons are sorted hierarchically using average linkage and correlation distance. Despite the presence of some habituation in response to multiple presentations of the same odorant across the experiment, habituation does not appear uniform across the neural population nor does it appear to dominate neural responses to odors. Different groups of neurons were identified with maximal responses to an odor peaking at different times across the experiment; see examples depicted on the right. Each row of traces corresponds to a single cell-odor pair. e, At the population level, odor responses do not uniformly habituate across the experiment. (Top), Cartoon depiction of procedure for determining change in response amplitude over the course of the experiment for a single cell odor pair. (Middle and Bottom), pooled data for all cell-odor pairs, sorted by layer. Red lines correspond to distribution means (clustered odor set). f, Lifetime sparseness distributions (used to quantify tuning breadth, see Methods) in L2 and L3 across all experiments (1 = perfectly odor selective, 0 = completely non-selective, * = p<0.01, permutation test on layer label). Distributions are built using all responsive neurons (significant response to at least one odor by auROC analysis) pooled by layer across all experiments (here and throughout, global: n = 3 mice, L2 = 854 neurons, L3 = 616 neurons; clustered: n = 3 mice, L2 = 867 neurons, L3 = 488 neurons; tiled: n = 3 mice, L2 = 427 neurons, L3 = 334 neurons). g, Population sparseness distributions (used to quantify response density, see Methods) in L2 and L3 (1 = few neurons active overall, 0 = all neurons active overall to an equal level. * = p<0.01, permutation test on layer label). h, Probability density distributions of coefficient of variation for all significant cell-odor pairs identified with auROC analysis. (* = p<0.01, permutation test on layer label). i, Probability density distributions of ensemble correlations (i.e., pairwise correlations between odor-evoked ensembles) between trial-averaged population odor responses in L2 (left) and L3 (middle). Dashed control curves indicate the distribution of ensemble correlations after shuffling odor labels independently across neurons. Ensemble correlations were determined independently for each animal, and subsequently pooled (* = p<0.01). L3 exhibits greater correlations at the population level than L2 (right) (* = p<0.01, permutation test on layer label).
Extended Data Figure 4.
Extended Data Figure 4.. Cortical odor representations are stable from trial to trial and not chemotopically organized.
a, (Left), Pairwise odor chemical correlation matrices for the global, clustered and tiled odor sets. Rows and columns are sorted according to the chemical similarity between odors as assessed by hierarchical clustering (see Methods). (Middle and Right), Pairwise correlation distances of single-trial, population representations for odors in the global, clustered, and tiled odor experiments in PCx L2 and L3 (and boutons for the tiled odor set). Rows and columns are sorted according to the chemical similarity between odors as on (Left). Chemical color code (x and y axis labels of matrices, indicating functional group associated with each group of molecules) is shown in the legend. R values indicate Pearson’s correlation to odor chemistry. b, (Top), Structured odor relationships persist from trial to trial over the course of the experiment. Blue line represents the similarity of two correlation distance matrices built from population responses obtained on consecutive trials. Grey dashed line indicates mean across all trial-pair comparisons (10 trials, 9 trial pairs; clustered odor set, L3). (Bottom), chemistry-based odor relationships correspond to matched cortical relationships obtained on a trial-by-trial basis. Dashed grey line represents the similarity of chemical and neural activity distances on a trial-by-trial basis. c, Correspondence between odor structure in PCx L3 (clustered odor set) and odor chemistry using 3 different distance metrics (correlation distances, Euclidean distances and cosine distances). Distance matrices calculated from population activity are obtained using instantaneous ΔF/F0 over 130 ms increments (F0: baseline fluorescence averaged over a 1 second sliding window). Vertical lines delimit the 2 second odor presentation. d, Odor chemical relationships emerge within a few hundred milliseconds after odor onset and persist for several seconds after odor offset (see Extended Data Fig. 1e for associated PID traces. e, Example PCx L2 and L3 FOVs from a single animal with each responsive neuron colored according to its preferred odor in the clustered odor set. Neurons preferring odors belonging to different classes (legend) appear spatially intermingled in both L2 and L3. f, Contour plots of pairwise signal correlations, plotted with respect to distance in L2 and L3 for the clustered and tiled experiments. Darker colors indicate increased density (see margin distributions). Pearson’s r is overlaid and indicates no spatial organization of odor representations in PCx.
Extended Data Figure 5.
Extended Data Figure 5.. Lasso optimization identifies parsimonious sets of chemical descriptors that predict neural odor relationships.
a, (Left), Descriptors identified through training on one odor set also improve Pearson’s correlation (r) between corresponding chemical and neural distances for held-out sets of odors (G = global, C= clustered, T=tiled. A value of 1 in the matrix corresponds to no improvement from baseline Pearson’s r after optimization. Baseline chemical-neural correlation is 0.22 for global; 0.48 for clustered; 0.37 for tiled (see SI Table 1 for optimal descriptor sets). (Right), Reduction in mean-squared error (MSE) between chemical and neural odor pair distances for held-out odor sets (indicated below the x-axis) after training on a single odor set (indicated above). Note that the 5 odors in common between the global and clustered odor sets (names in bold case in Extended Data Fig. 2e) were discarded when evaluating performance on held-out data. The chemical features learned from the tiled odor set improved chemical-neural Pearson’s correlations in the clustered odor experiment but not the global odor experiment, consistent with the odors belonging to the tiled set covering only a limited region of chemical odor space (left). However, despite the limited chemical overlap between the tiled and global odor sets, training on the tiled odor set still improved the correspondence between odor chemistry and neural responses for the global odor set as assessed by a reduction in MSE (right). b, Identifying a subset of chemical descriptors (from the original superset used to define odor space) using Lasso optimization on odor distances improves the correspondence to cortical activity (see Methods, SI Table 1). Training data was derived from the bouton dataset, and testing was performed for bouton responses to held-out odors within the tiled odor set, and also to cortical responses of the tiled odor set; Data is mean ± SEM over cross-validation folds. c, The same procedure as in b was performed on a limited subset of 15 semantically-relevant descriptors that comprise the “molecular properties” block of the Dragon database; these descriptors include metrics that reflect molecular properties associated with functional groups (e.g. donor or acceptor atom surface area), molecular weight (e.g. van der Waals molecular volume) or a combination of both, like “hydrophilic factor,” and reflect the main axes of diversity in the tiled odor set. Most descriptors enriched in the olfactory bulb covary with molecular weight (red descriptors). Most descriptors enriched in PCx reflect the combined presence of a charged atom and variable number of carbon atoms along the aliphatic series of the tiled odor set (blue descriptors). Note that these descriptors differ from those identified when querying the entire Dragon set using Lasso optimization (SI Table 1), as this limited set of targeted descriptors (selected because their semantic meaning is transparent) may not afford optimal predictions over neural data.
Extended Data Figure 6.
Extended Data Figure 6.. Functional imaging of OB axons in PCx via axonally-targeted gCaMP6s.
a, (Left), Whole-mount depicting Tbx21-Cre dependent expression of AAV PHP.eB hSynapsin1-FLEX-axon-GCaMP6s in OB projection neuron axons. GCaMP6s fluorescence is broadly distributed across piriform cortex. (Right), coronal sections depicting GCaMP6s signal (green) in the mitral cell layer across the entire anterior-posterior extent of the olfactory bulb and cortex. (Inset, bottom), GCaMP6s labelled axons shown coursing through PCx layer 1a. (Bottom left), En face image of layer 1a depicts dense and uniform distribution of axonal boutons. b, Difference heatmap of a typical field-of-view (FOV) depicting baseline and odor-driven fluctuations in GCaMP6s signal. The strongest activation (light color) is associated with axonal boutons. c, Time-averaged fluorescence signal of FOV in b. Overlay: segmented ROIs corresponding to axonal boutons depicting increases (red) or decreases (blue) in fluorescence, averaged over multiple presentations of a single odor from the tiled odor set. d, Example average fluorescence from several boutons in a. Grey bar indicates odor delivery period, scale bar indicates response amplitude. For clarity, fluorescence time-courses for each example bouton are offset along the y-axis. e, Example bouton responses for the tiled odor set. Each row represents the trial-averaged response of a single bouton for two seconds during and after odor exposere (columns) depicted as z-scored ΔF/F0; rows are sorted hierarchically using correlation distance and average linkage. The functional group and carbon chain-length associated with each odor are indicated below each column; light-to-saturated gradient indicates progression from short-chain (SC) to long-chain (LC) odors. Note that, as has been observed previously for OB projection neurons, boutons exhibit a substantial amount of odor-driven suppression.
Extended Data Figure 7.
Extended Data Figure 7.. Bouton odor response properties.
a, Probability density distributions for boutons, PCx L2, and PCx L3 for signal correlations. b, (Left), Same as in a, but for ensemble correlations. (Right), for the top 5% most similar odor pairs identified in boutons, correlation for the same odor pairs in PCx. Ensemble responses in both PCx L2 and PCx L3 exhibit stronger similarity than boutons. c-d, Probability density distributions for boutons, PCx L2, and PCx L3, for lifetime and population sparseness. e, Cumulative neural variance explained with increasing numbers of principal components, indicating relatively higher dimensionality in boutons compared to PCx (i.e., more uniform distribution of variance across principal components). f, Probability density distributions for boutons, PCx L2, and PCx L3 for coefficient of variation representing trial-to-trial response variability across cell-odor pairs. These data demonstrate that observed odor responses in boutons are more reliable than similar responses in cortex. For a-f only the tiled odor set is used. For lifetime sparseness, 1 = perfectly odor selective, 0 = completely non-selective. For population sparseness, 1 = few neurons responsive, 0 = all neurons equally responsive. Distributions are built using all responsive neurons/boutons (significant response to at least one odor by auROC analysis; Boutons: 3160 ROIs across 6 subjects, PCx L2: 427 neurons across 3 subjects. PCx L3: 334 neurons across 3 subjects). (* indicates significant difference between boutons and either L2 or L3: a, vs L2 p<10−27; vs L3 p=0.02; b, vs L2 p<10−20; vs L3 p<0.005; c, vs L2 p<10−9; vs L3 p=0.93; d, vs L2 p<10−7 vs L3 p<10−4; f, vs L2: p<10−20; vs L3: p<10−23; two-sided Wilcoxon Rank Sum test for all comparisons). g, Single-trial Z-scored ΔF/F0 for 1000 boutons recorded in PCx L1a during presentation of 22 odors belonging to the tiled odor set indicated by black lines. Redder colors indicating excitatory transients and bluer colors indicating odor-evoked suppression. h, Response types observed in boutons (tiled odor set). Individual panels correspond to clusters identified using a gaussian mixture model (see Methods). Grey traces correspond to trial-averaged bouton-odor pairs. Colored overlays represent mean response time-course associated with each cluster. Blue vertical lines mark periods of odor presentation. i, Fraction of total odor-driven bouton variance in each individual animal that can be attributed to the shared across-animal structure as quantified by distance covariance analysis (see Methods).
Extended Data Figure 8.
Extended Data Figure 8.. Habituation-dishabituation test for assessing perceptual similarity of odor pairs.
a, (Left) Mice presented with novel odors exhibit investigation that diminishes over multiple consecutive presentations of the same odorant. Subsequent presentation of a perceptually different odor reinstates investigation while presentation of a similar odor has little effect. The extent to which two odorants are perceptually related is assessed by the magnitude of rekindled interest in the second odor after habituation has occurred to the first. b, Investigation times for two different odor triplets. Data is mean ± SEM, (n=7 and n=8 mice, respectively). After habituation to heptanal, investigation of the closely related octanal (1-carbon difference) does not significantly increase. Presentation of butanal following habituation to octanal (4-carbon difference) induces greater investigation. For the second triplet, presentation of heptanal following habituation to heptanone (0-carbon difference, different functional group) induces greater investigation, while subsequent presentation of octanal following habituation to heptanal (1-carbon difference, same functional group), induces much less investigation.
Extended Data Figure 9.
Extended Data Figure 9.. Inhibition of the associative network through cell-autonomous expression of tetanus toxin light chain in excitatory PCx neurons.
a, Uniform infection of excitatory pyramidal neurons in PCx L2 and L3 with AAV-hSyn-FLEX-TeLC-P2A-NLS-dTom in an Emx1-Cre mouse. b, (Left), Coronal section through PCx indicating placement of recording electrode. (Right), Single-unit odor-evoked activity (grand-average of all excitatory responses deemed as significant by auROC analysis) in Emx1-cre mice expressing TeLC or wild-type controls. Disruption of cortical recurrent excitation enhances odor-evoked excitation, consistent with disruption of feedback inhibition. Grey bar indicates odor presentation (n = 121 cell-odor pairs from two Emx1-cre mice expressing TeLC; n = 229 cell-odor pairs from four mice). c-g, Probability density distributions for the TeLC experiment for signal and ensemble correlations, lifetime and population sparseness, and coefficient of variation, constructed as in Extended Data Fig. 7, here only for the tiled odor set. For lifetime sparseness, 1 = perfectly odor selective, 0 = completely non-selective. For population sparseness, 1 = few neurons responsive, 0 = all neurons equally responsive. Distributions are built using all responsive neurons (significant response to at least one odor by auROC analysis; TeLC L2: 435 neurons across 3 subjects. TeLC L3: 590 neurons across 3 subjects. PCx L2: 427 neurons across 3 subjects. PCx L3: 334 neurons across 3 subjects). (* TeLC is significantly different from PCx L2 or L3: c, L2 p<10−8; L3 p<10−198; d, L2 p<10−46; L3 p<10−55; e, L2 p<10−05; L3 p<10−37; f, L2 p<10−7 L3 p<10−8; g, L2: p<10−10; L3: p<10−4; two-sided Wilcoxon Rank Sum test for all comparisons).
Extended Data Figure 10.
Extended Data Figure 10.. Passive odor experience modifies odor relationships.
a, Correlation distance matrices for the tiled odor set obtained from odor-naïve (same data as in Figs 1–4) mice as well as mice passively exposed to a target mixture of two short-chain aldehydes and two short-chain ketones in the home cage (see Methods, Fig. 4 e–f). Passive experience with the mixture increases odor similarity specifically between mixture components (target comparisons indicated in the legend in blue), but not between target ketones and long-chain aldehydes or short-chain esters and short-chain acids with which mice had no prior experience (off-target comparisons indicated in legend in black, naïve: 334 neurons, n=3 mice; exposed: 742 neurons, n=3 mice).
Figure 1.
Figure 1.. Systematically probing relationships between odor chemistry and cortical odor representations.
a, Global, clustered and tiled odor sets (see Extended Data Fig. 1e for odor identities and structures), depicted in principal component space (see Methods). Color indicates functional group associated with each odor. Variance of full odor space (gray dots) spanned by each odor set is indicated. b, Example single neuron responses for the clustered odor set, representing the trial-averaged response of single neurons (rows) across 22 odors (columns). Rows are sorted using hierarchical clustering, with PCx L2 and L3 rasters sorted independently (see Methods). c, Pairwise odor distances (Pearson’s correlation) for all odor sets based on chemical descriptors (see Methods). Rows and columns represent individual odors sorted using hierarchical clustering (ordering identical to that in Extended Data Fig. 1e). Color bars indicate functional groups associated with each odor. d, Pairwise odor distances based on pooled neural population responses in PCx L2 and L3 (see Methods), sorted as in c. Pearson’s correlation coefficient between the chemical and neural distance matrices reported below each matrix (global: p<10−7; clustered: p<10−16; tiled: p<10−18); rs (shuffle) obtained by independently permuting odor labels for each neuron. Blue boxes highlight ketone-ester and ketone-acid relationships between chemistry and PCx L3. e, UMAP embeddings of cortical responses to the tiled odor set. Each dot represents a population response for one odor presentation (7 per odor), color-coded as in d. f, Fraction of total variance in each mouse (L3 activity) attributable to shared across-animal structure determined by distance covariance analysis (see Methods). g, k-nearest-neighbor classification of odor identity in a held-out mouse using odor distances from other mice. Data are bootstrap mean ± SEM; grey bars indicate shuffle control on odor labels (see Methods). (Accuracy is greater in PCx. global: p<10−3; clustered: p<10−60; tiled: p<10−22, Wilcoxon Rank Sum, two-sided). b, d-g, are based on all responsive neurons (see Methods) pooled by layer across mice (n mice, neurons (L2/L3) for global: 3, (854/616), clustered: 3, (867/488), tiled: 3, (427/334); see Methods for subject-specific statistics).
Figure 2.
Figure 2.. Correlation structure differs in olfactory bulb and cortex.
a, Correlation distance matrices for the tiled odor set across all conditions. (Top left), Distances obtained using chemical descriptors. (Right), Distances based on odor responses. Odor sorting as in Fig 1c. R values indicate Pearson’s correlation with odor chemistry (Boutons: p<10−17; PCx L2: p<10−17; PCx L3: p<10−19; Model: p<10−17; TeLC L2: p<10−21; TeLC L3: p<10−32; Shuffled Pearson’s r = 0.0 ± 0.063 SD, 1000 permutations on odor label). ED = effective dimensionality (see Methods). b, (Left), Difference between PCx and bouton distances in a. (Right), Difference between PCx and random network model distances in a (see Methods). c, Pairwise odor correlation distances based on neural responses plotted against corresponding chemical distances. d, Silhoutte scores for clustered population responses (based upon Euclidean distances and grouped via k-means clustering) over a range of cluster sizes. Higher values indicate better clustering (see Methods). e, Pairwise odor correlations in boutons and PCx predicted by the feed-forward random network model (see Methods) compared to observed correlations in PCx L2 and L3. (Right), Probability density distribution of differences between cortical (PCx L2 and L3) and input (boutons) pairwise odor correlations, superimposed on the distribution expected with the model (model vs L3: p<10−33, vs L2: p<10−17, Kolmagorov-Smirnov test). f, Difference in pairwise odor correlations between PCx L3 and boutons (grey dots). Positive values indicate greater correlation in cortex. Odor pairs are ranked along the x-axis from least to highest correlation in the bouton data. Short-chain (SC) and long-chain (LC) comparisons between ketones (K), esters (E), and aldehydes (A) are color-coded as in legend.
Figure 3.
Figure 3.. Cortical odor responses reformat odor relationships inherited from the OB.
a, UMAP embeddings for all experimental conditions. Note that UMAP emphasizes relationships rather than distances, so these embeddings are similarly scaled (see Fig. 2a, Methods). b, Hierarchical clustering of neural population responses; ρ values indicate clustering similarity to OB boutons (Spearman correlation on cophenetic distances between boutons and the other datasets). c, Pullouts from panels in Fig. 2a depicting conserved and rearranged odor relationships between aldehydes, ketones and esters; inset: ratio of correlations between long-chain (LC) and short-chain (SC) comparisons (each dot indicates mean across odor pairs); r values indicate Pearson’s correlation to odor chemistry. For a,b, color code as in c.
Figure 4.
Figure 4.. Cortical odor representations generalize across odors, are consistent with perception, and can be modified by experience.
a, (Left) Schematic depicting a linear SVM classifier trained to identify an odor associated with a held-out neural population response on a trial-by-trial basis. (Right) Decoding accuracy plotted against neural/bouton populations of different sizes. b, Decoding analysis to quantify odor generalization; each line represents classifier confusion between any odor and all other odors, rank ordered by the degree of confusion. c, Decoding accuracy of SVM classifiers predicting whether a held-out odor is a short-chain (SC) or long-chain (LC) molecule. The acid block was excluded for this analysis. Data are bootstrapped mean ± SEM across held-out odors and neural/bouton ensembles, (For a-c: tiled odor set, 22 odors; number of mice, neurons/boutons for PCx L2/L3 same as Fig. 1b, d–g, for boutons, 6 mice /3160 boutons. For b,c: 300 units, 100 bootstraps. See Methods for all decoding analyses). d, (Left), Pairwise neural and behavioral odor distances from a cross-habituation assay for the tiled odor set (see Extended Fig. 8); ρ is Spearman correlation coefficient. Black line indicates regression fit (mean ± 95th % CI, 1000 bootstraps). Black circles are mean ± SEM across mice (n>3 for each comparison). (Right), Coefficient of determination (R2) based on short-chain:short-chain (SC) and long-chain:long-chain (LC) or all comparisons (median ± 66th % CI indicated, 1000 bootstraps. N=26 odor triplets; 122 mice across all conditions, see Methods for behavioral distance and odor identities). e, (Left), Probability density estimates of cell-wise class preference index for naïve and passive odor exposure conditions, for neurons responding to at least one short-chain (SC) ketone or aldehyde (see Methods). (Right), Example z-scored fluorescence (and preference index) from neurons tuned to either SC ketones (cell 1), SC aldehydes (cell 2), or both (cell 3). Grey bars indicate odor onset. f, Pairwise odor distances in PCx L3 from odor-naïve and odor-exposed animals. Passive exposure to the target mixture (short-chain (SC) ketones (K) and aldehydes (A)) specifically increased similarity between ketones and aldehydes, but not between control odor pairs SC K vs long-chain (LC) A and SC esters (E) vs SC acids (Ac) (see Extended Data Fig 10; *: p<0.002; n.s. middle: p=0.62; n.s. right: p=0.45, independent t-test, 2-tailed; number of mice / neurons for naïve: 3/334; exposed: 3/742).

Similar articles

Cited by

References

    1. Haberly LB Parallel-distributed processing in olfactory cortex: new insights from morphological and physiological analysis of neuronal circuitry. Chemical Senses 26, 551–576 (2001). - PubMed
    1. Courtiol E & Wilson DA The Olfactory Mosaic: Bringing an Olfactory Network Together for Odor Perception. Perception 46, 320–332, doi:10.1177/0301006616663216 (2017). - DOI - PMC - PubMed
    1. Barnes DC, Hofacer RD, Zaman AR, Rennaker RL & Wilson DA Olfactory perceptual stability and discrimination. Nature Neuroscience 11, 1378–1380, doi:10.1038/nn.2217 (2008). - DOI - PMC - PubMed
    1. Wilson DA & Sullivan RM Cortical Processing of Odor Objects. Neuron 72, 506–519, doi:10.1016/j.neuron.2011.10.027 (2011). - DOI - PMC - PubMed
    1. Haddad R et al. A metric for odorant comparison. Nature methods 5, 425–429, doi:10.1038/nmeth.1197 (2008). - DOI - PubMed

Publication types

Substances