. 2020 Jul;583(7815):296-302.
doi: 10.1038/s41586-020-2424-4. Epub 2020 Jul 1.

Structural cells are key regulators of organ-specific immune responses

Affiliations

Structural cells are key regulators of organ-specific immune responses

Thomas Krausgruber et al. Nature. 2020 Jul.

Abstract

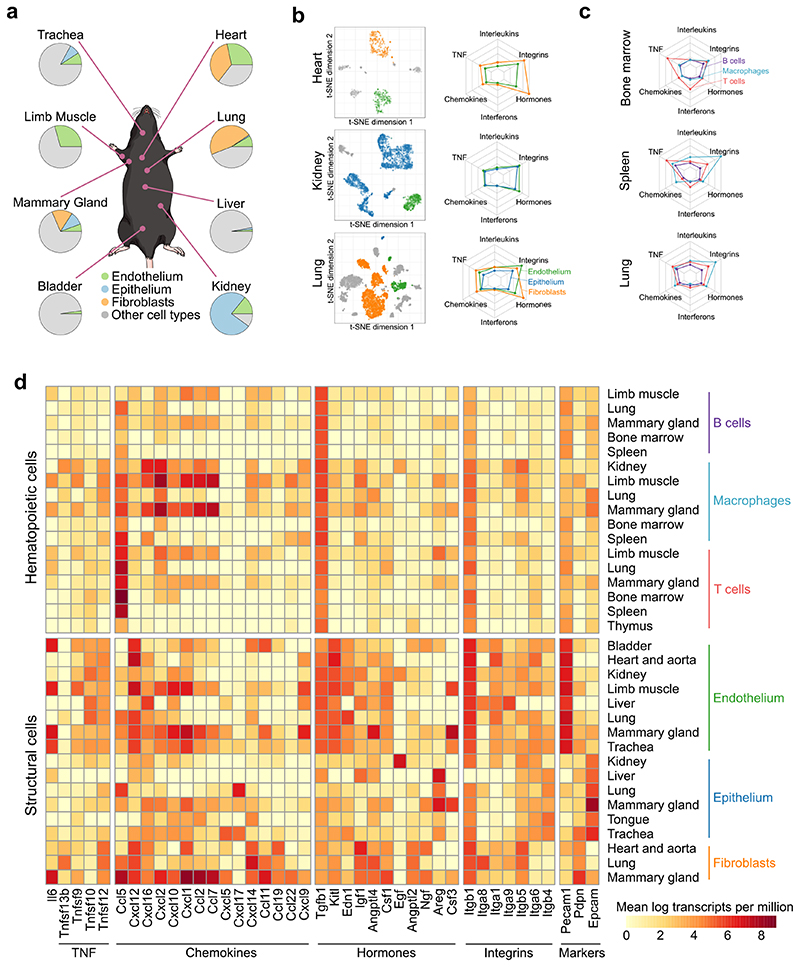
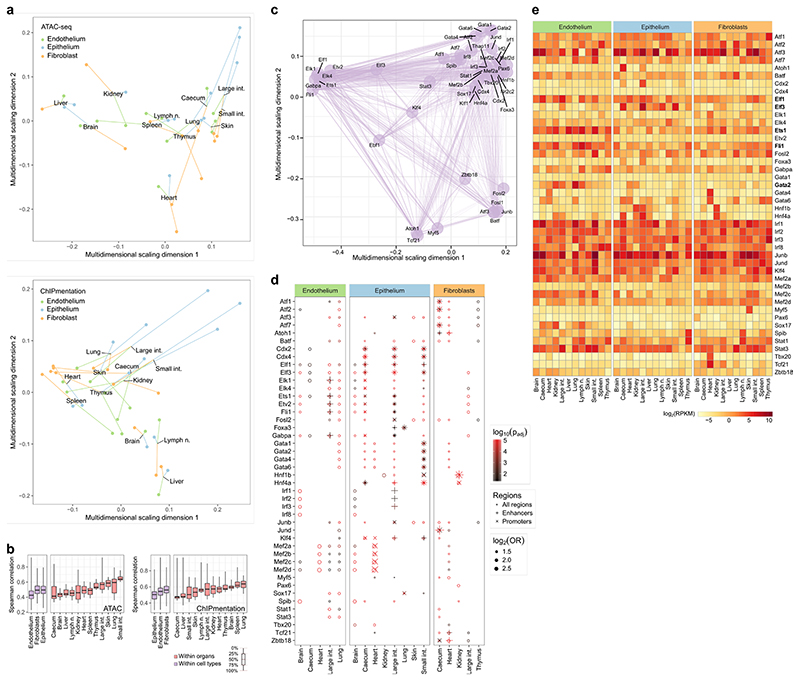
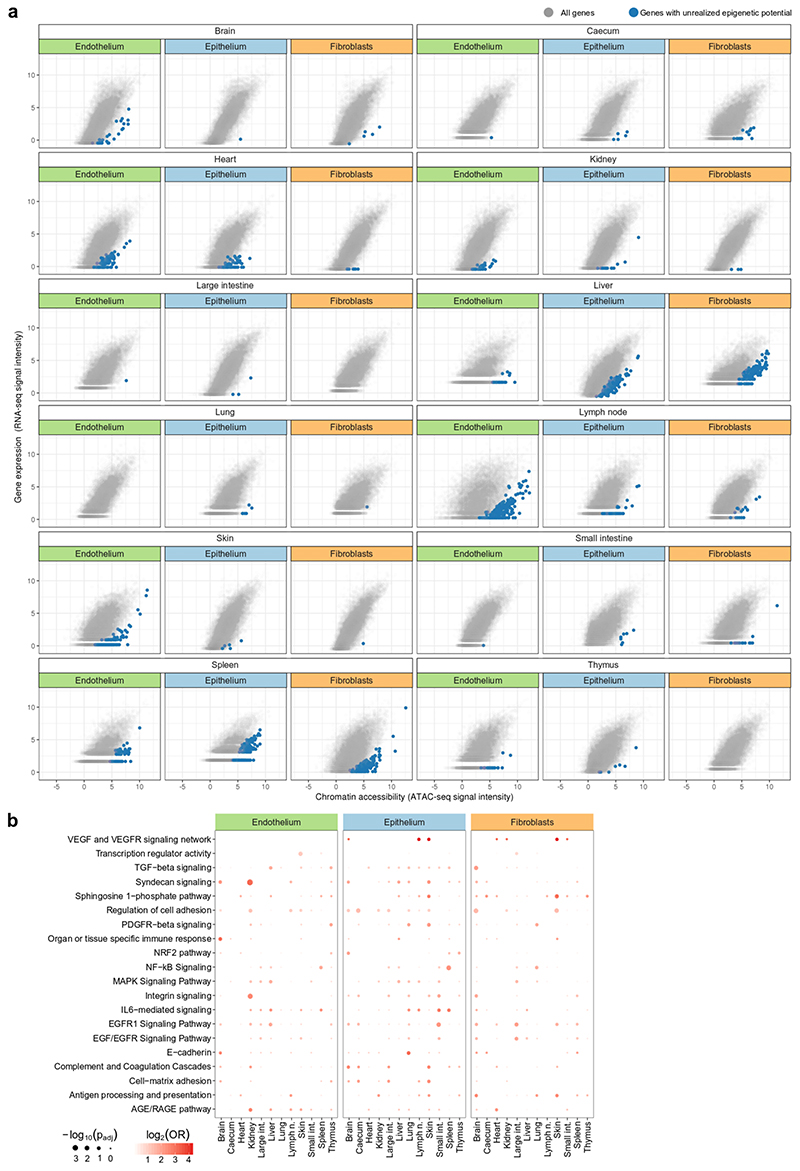
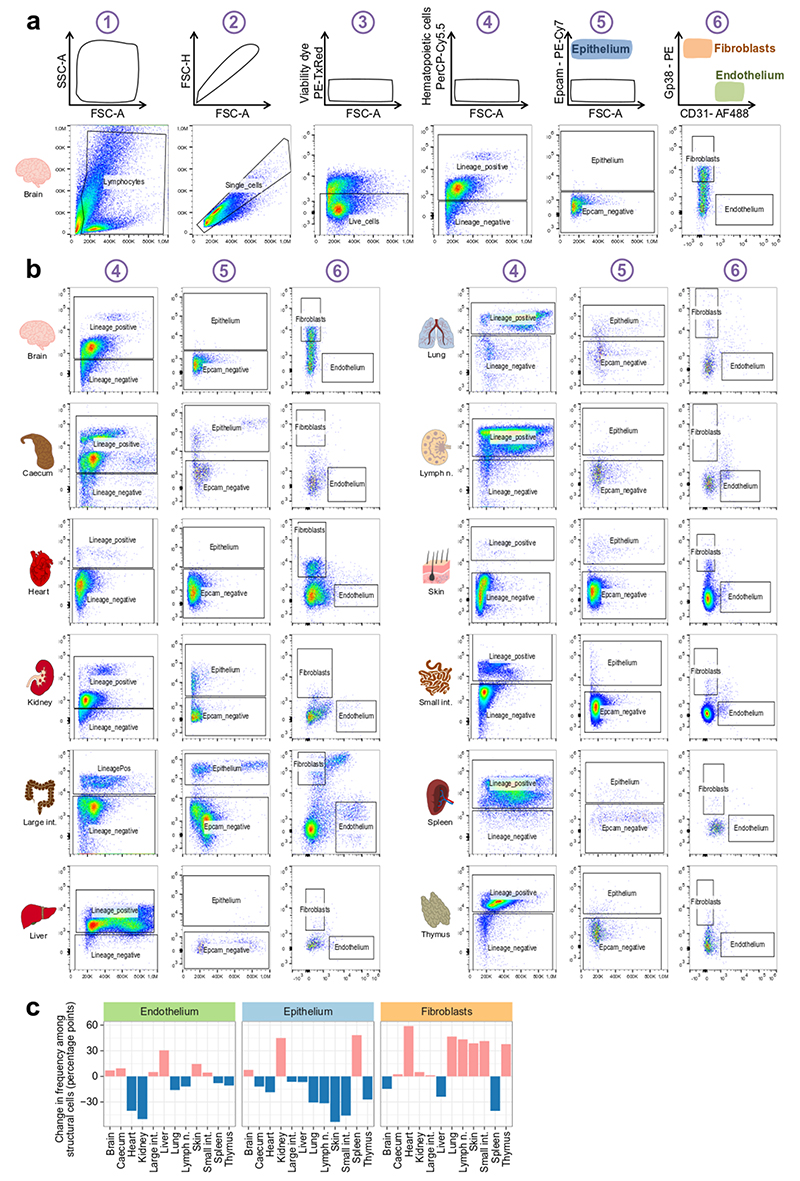
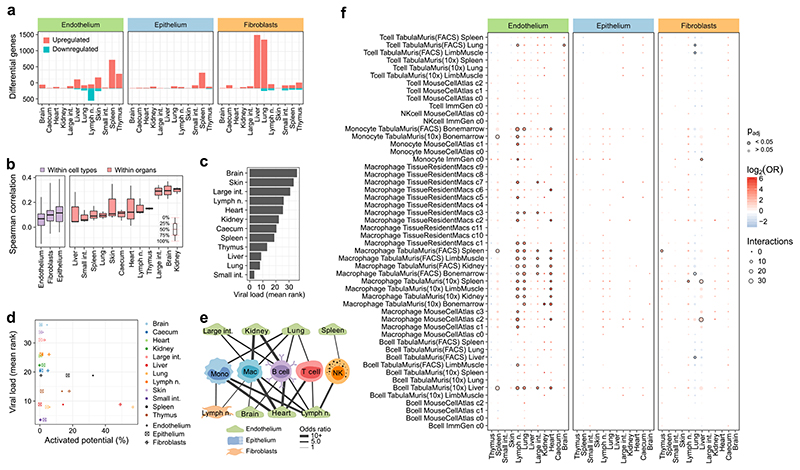
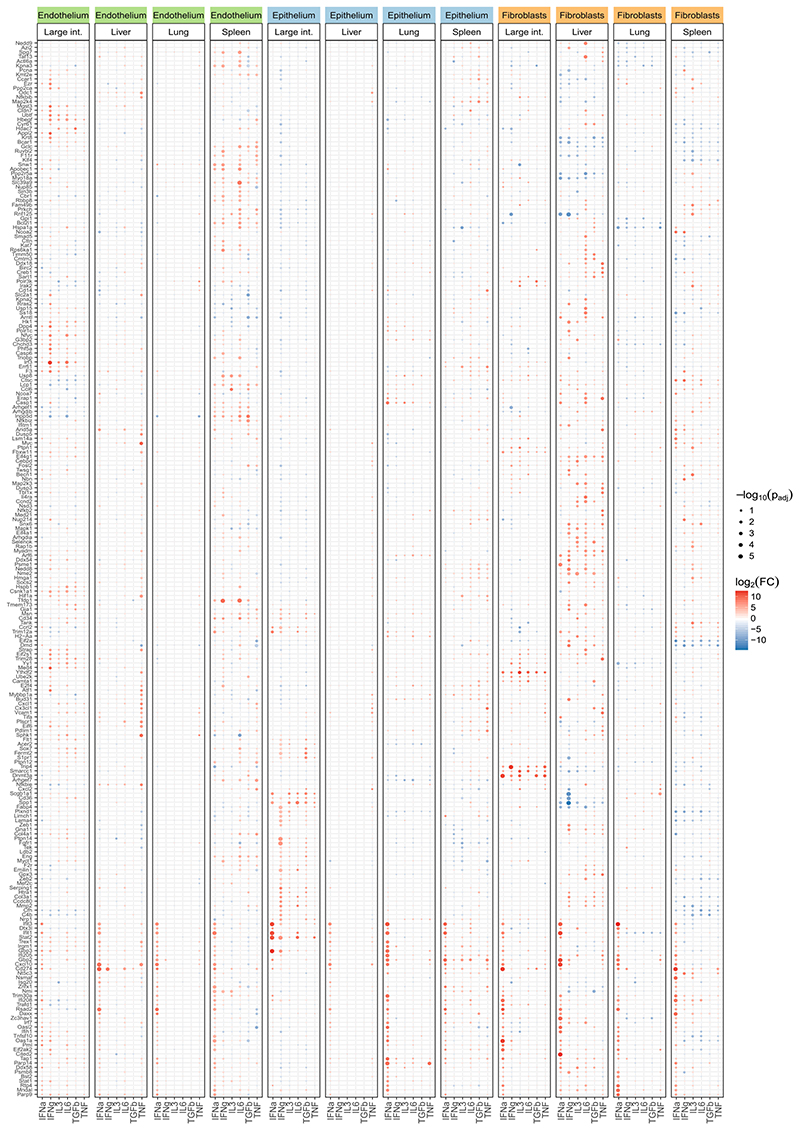
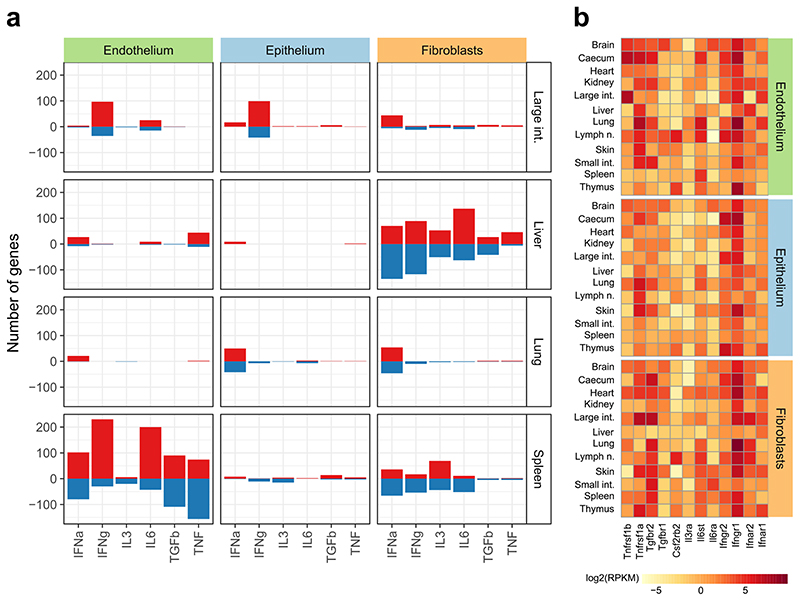
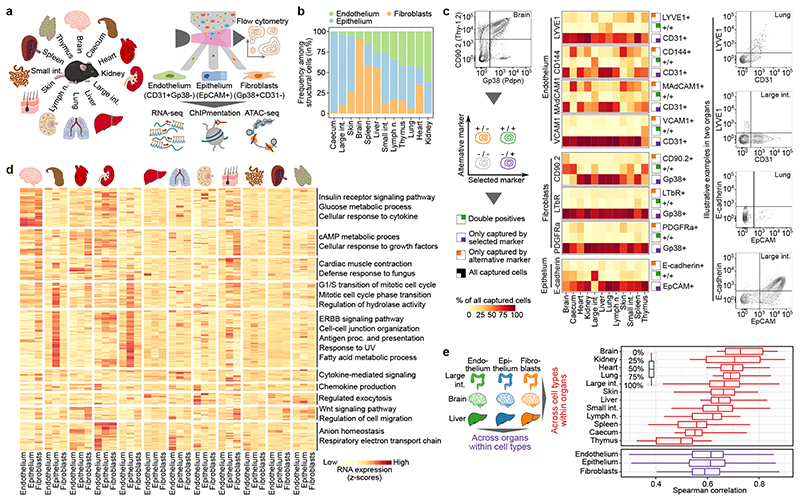
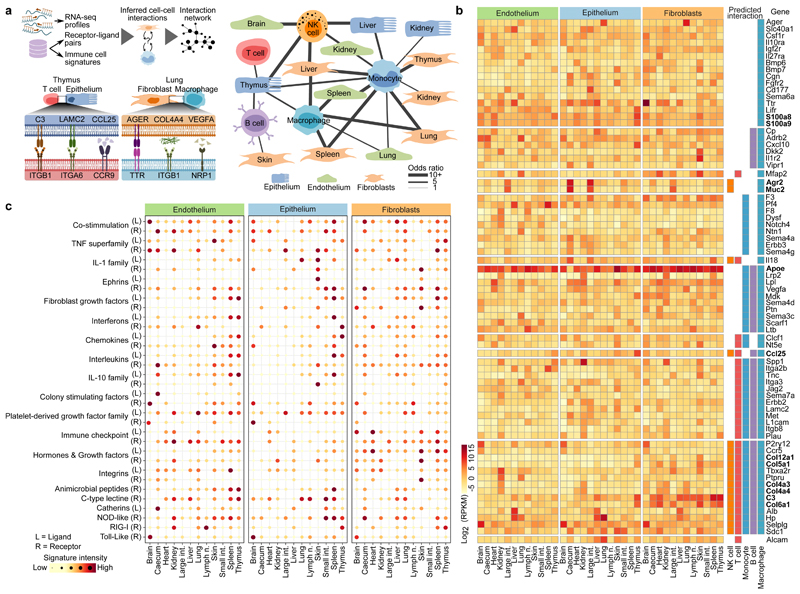
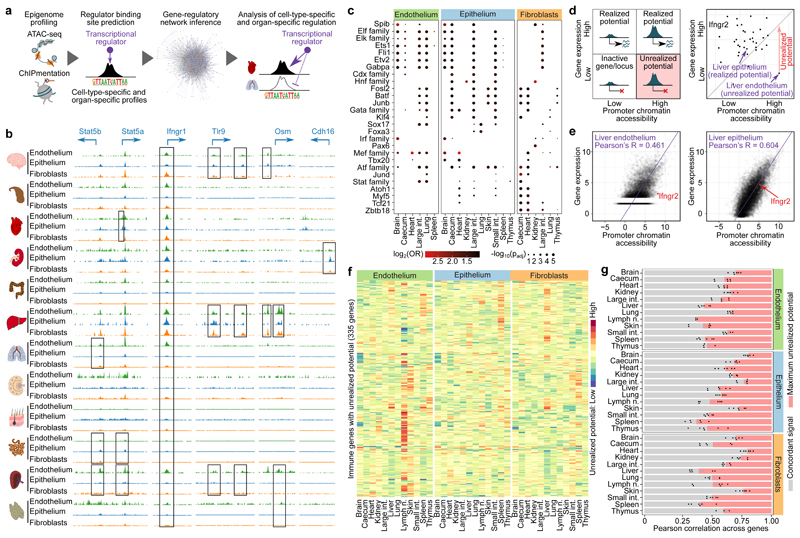
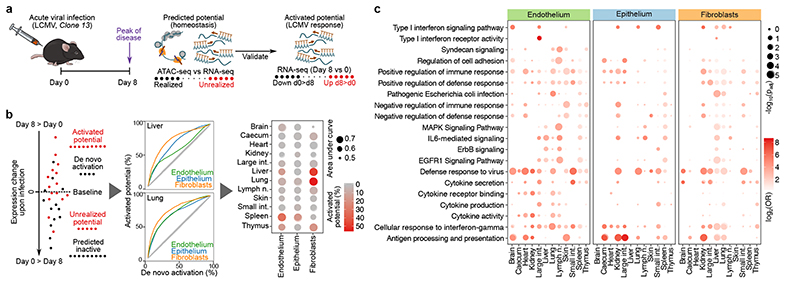
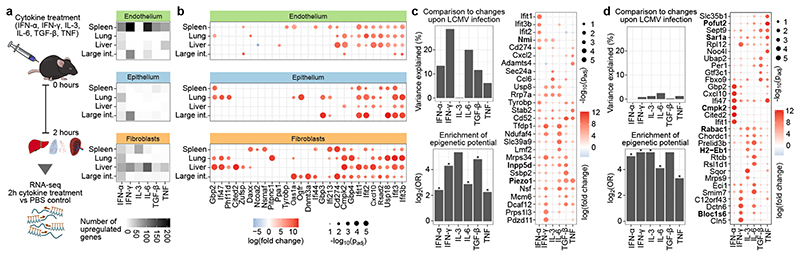
The mammalian immune system implements a remarkably effective set of mechanisms for fighting pathogens1. Its main components are haematopoietic immune cells, including myeloid cells that control innate immunity, and lymphoid cells that constitute adaptive immunity2. However, immune functions are not unique to haematopoietic cells, and many other cell types display basic mechanisms of pathogen defence3-5. To advance our understanding of immunology outside the haematopoietic system, here we systematically investigate the regulation of immune genes in the three major types of structural cells: epithelium, endothelium and fibroblasts. We characterize these cell types across twelve organs in mice, using cellular phenotyping, transcriptome sequencing, chromatin accessibility profiling and epigenome mapping. This comprehensive dataset revealed complex immune gene activity and regulation in structural cells. The observed patterns were highly organ-specific and seem to modulate the extensive interactions between structural cells and haematopoietic immune cells. Moreover, we identified an epigenetically encoded immune potential in structural cells under tissue homeostasis, which was triggered in response to systemic viral infection. This study highlights the prevalence and organ-specific complexity of immune gene activity in non-haematopoietic structural cells, and it provides a high-resolution, multi-omics atlas of the epigenetic and transcriptional networks that regulate structural cells in the mouse.


Conflict of interest statement

Additional information:

Competing interests: The authors declare no competing financial interests

Supplementary Information is available for this paper.

Figures

Extended Data Fig. 1
Standardized identification and purification of structural cells across 12 organs. a, Cell-type identification and cell sorting scheme (top row) and representative flow cytometry plots (selected from n=4 independent biologically replicates) in one representative organ (brain) under homeostatic conditions (bottom row). b, Representative plots (selected from n=4 independent biologically replicates) for gating steps 4 to 6 of the standardized cell-type identification and cell sorting scheme (panel a) across the 12 organs under homeostatic conditions. c, Relative frequencies of structural cell types among non-hematopoietic (CD45-) cells across 12 organs, for cell suspensions obtained by standardized organ dissociation. d, Relative frequencies of structural cell types among non-hematopoietic (CD45-) cells across three organs, for cell suspensions obtained by either standardized organ dissociation or organ-specific dissociation protocols. Shown are mean and s.e.m. values. Sample size: n = 4 (c) and n = 3 (d) independent biological replicates.
Extended Data Fig. 2
Surface marker profiling of structural cells under homeostatic conditions. a, Gating strategy for the flow cytometry-based validation of the structural cell sorting scheme. Identification of structural cells starts with gating for intact cells (1), single cells (2), live cells (3) and non-haematopoietic cells (4). From the resulting non-haematopoietic (CD45-) cell population, potential epithelial cells (5.1) are gated for epithelial cell markers (5.2). Similarly, potential endothelial cells and fibroblasts (6.1, 6.2) are gated for endothelial cell markers (6.3) and fibroblast markers (6.4). b, Relative frequencies of potential structural cell types based on gates 5.2, 6.3 and 6.4 (from a), comparing the selected markers with alternative markers. c, Expression of the selected surface markers of structural cell types (top row) and potential alternative markers for cells gated as in Extended Data Fig. 1a. Shown are mean and s.e.m. values. Sample size (all panels): n = 3 independent biological replicates.
Extended Data Fig. 3
Comparison of the structural cell transcriptomes to published reference data. a, Overlap of the identified cell-type-specific and organ-specific marker genes (derived from the RNA-seq experiments in the current study) with tissue-specific gene sets from a microarray-based expression atlas (two-sided Fisher’s exact test with multiple-testing correction). b, Gene expression across cell types and organs (from the current study) aggregated across marker genes of structural cell clusters in a single-cell RNA-seq atlas of the mouse19. c, Gene expression across cell types and organs (from the current study) plotted for a manually curated list of commonly used markers of structural cells. d, Hierarchical clustering of structural cells across cell types and organs based on the transcriptome profiles from the current study. Sample size (all panels): n = 3 independent biological replicates.
Extended Data Fig. 4
Inference of cell-cell interactions across cell types and organs. a, Enrichment analysis for potential cell-cell interactions between structural cells and hematopoietic immune cells, based on gene expression of known receptor-ligand pairs (two-sided Fisher’s exact test with multiple-testing correction). For each combination of one structural cell type and one hematopoietic immune cell type, the analysis assesses whether all pairs of marker genes between the two cell types are enriched for annotated receptor-ligand pairs. b, Differently expressed genes across cell types and organs, based on a manually curated list of receptors and ligands (Supplementary Table 4). Sample size (all panels): n = 3 independent biological replicates.
Extended Data Fig. 5
Analysis of immune gene expression among structural cells in an independent dataset. a, Relative frequencies of single-cell transcriptomes classified as endothelium, epithelium, and fibroblasts in selected organs according to the Tabula Muris dataset20. b, Expression of immune gene signatures in structural cells according to the Tabula Muris dataset, jointly normalized across all plots (for comparability). c, Expression of immune gene signatures in hematopoietic immune cells according to the Tabula Muris dataset, normalized in the same way as in panel b. d, Expression of selected immune genes in structural cells and in hematopoietic immune cells according to the Tabula Muris dataset. Sample size: n = 7 (all panels) independent biological replicates, comprising 4 male and 3 female mice.
Extended Data Fig. 6
Analysis of transcription regulation in structural cells. a, Multidimensional scaling analysis of the similarity of chromatin profiles across cell types, organs, and replicates based on ATAC-seq (top) and H3K4me2 ChIPmentation (bottom). b, Correlation of chromatin profiles across cell types and organs for ATAC-seq (left) and H3K4me2 ChIPmentation (right). c, Transcriptional regulators of the inferred gene-regulatory network for structural cells, arranged by similarity using multidimensional scaling. d, Motif enrichment for transcriptional regulators among differential chromatin peaks, shown separately for each regulator (one-sided hypergeometric test with multiple-testing correction). e, Gene expression of the transcriptional regulators across cell types and organs (genes discussed in the text are in bold). Sample size (all panels): n = 2 independent biological replicates.
Extended Data Fig. 7
Detection and analysis of genes with unrealized epigenetic potential. a, Scatterplot showing the correlation between chromatin accessibility in promoter regions and the corresponding gene expression levels in structural cells across cell types and organs. Genes with significant unrealized epigenetic potential (calculated as the difference between normalized ATAC-seq and RNA-seq signals) are highlighted in blue. b, Enrichment of immune-related gene sets among the genes with unrealized epigenetic potential (two-sided Fisher’s exact test with multiple-testing correction). Sample size (all panels): n = 2 independent biological replicates.
Extended Data Fig. 8
Standardized identification and purification of structural cells after LCMV infection. a, Cell-type identification and cell sorting scheme (top row) and representative flow cytometry plots (selected from n=3 independent biologically replicates) in one representative organ (brain) after LCMV infection (bottom row). b, Representative plots (selected from n=3 independent biologically replicates) for gating steps 4 to 6 of the standardized cell-type identification and cell sorting scheme (a) across the 12 organs upon LCMV infection. c, Change in the relative frequenct of structural cells upon LCMV infection. size (all panels): n = 3 independent biological replicates.
Extended Data Fig. 9
Analysis of differential gene expression in response to LCMV infection. a, Number of differentially expressed genes in structural cells upon LCMV infection (this includes not only immune genes but for example also genes associated with the substantial organ-specific tissue damage induced by LCMV infection). b, Correlation of the observed changes in gene expression upon LCMV infection across cell types and organs. c, Organ-specific viral load at day 8 of LCMV infection, measured by qPCR in whole-tissue samples collected from each organ (without FACS purification of individual cell types). Five reference genes were used for normalization and results were ranked across organs, in order to make the analysis robust toward tissue-specific differences in the expression of these housekeeping genes. However, the experimental results do not support an absolute quantification of viral load in each organ nor do they account for differences in the relative frequencies of cells that are susceptible to LCMV infection in each organ. d, Scatterplot illustrating the low correlation between the activated epigenetic potential and the measured viral load across cell types and organs. e, Network analysis (e) and enrichment analysis (f) of potential cell-cell interactions between structural cells and hematopoietic immune cells, inferred from gene expression of known receptor-ligand pairs upon LCMV infection (two-sided Fisher’s exact test with multiple-testing correction). For each combination of one structural cell type and one hematopoietic immune cell type, the analysis assesses whether all pairs of marker genes between the two cell types are enriched for annotated receptor-ligand pairs. Sample size: n=3 (all panels).
Extended Data Fig. 10
Visualization of differential gene expression in response to in vivo cytokine treatments. The heatmap visualizes changes in the expression of genes associated with immune functions, plotted across cell types, organs, and cytokines (two-sided linear model with multiple-testing correction). Sample size: n = 3 independent biological replicates.
Extended Data Fig. 11
Analysis of differential gene expression in response to in vivo cytokine treatments. a, Number of differentially expressed genes in response to the individual cytokine treatments. b, Gene expression for the known receptors involved in the response to the individual cytokine treatments, plotted across cell types and organs under homeostatic conditions. Sample size (all panels): n = 3 independent biological replicates.
Figure 1
Figure 1
Multi-omics profiling establishes cell-type-specific and organ-specific characteristics of structural cells. a, Schematic outline of the experimental approach. b, Relative frequencies of structural cell types based on flow cytometry. c, Expression of surface markers among structural cells, comparing the standardized sorting of endothelium, epithelium, and fibroblasts to potential alternative markers (left: schematic outline; center: heatmaps showing marker overlap; right: illustrative FACS plots). d, Expression of differentially regulated genes across cell types and organs. Gene clusters are annotated with enriched terms based on gene set analysis. e, Correlation of gene expression across cell types and organs. Sample size: n = 4 (b) and n = 3 (c-e) independent biological replicates.
Figure 2
Figure 2
Gene expression of structural cells predicts cell-type-specific and organ-specific crosstalk with hematopoietic immune cells. a, Network of potential cell–cell interactions between structural cells and haematopoietic immune cells inferred from gene expression of known receptor–ligand pairs. NK cell, natural killer cell. b, Expression of receptors and ligands in structural cells, annotated with the cell–cell interactions that they may mediate (genes discussed in the text are in bold). RPKM, reads per kilobase of transcript per million mapped reads. c, Gene signatures of receptors (R) and ligands (L) in structural cells. Sample size (all panels): n = 3 independent biological replicates.
Figure 3
Figure 3
Structural cells implement characteristic gene-regulatory networks and an epigenetic potential for immune gene activation. a, Schematic outline of the gene-regulatory network analysis. b, ATAC-seq signal tracks (average across replicates) for selected genomic regions. Differences between cell types and organs are highlighted by black boxes. c, Motif enrichment for transcriptional regulators in cell-type-specific and organ-specific chromatin marker peaks (one-sided hypergeometric test with multiple-testing correction). d, Schematic outline (left) and a concrete example (right) of the epigenetic potential, based on the comparison of chromatin accessibility (ATAC-seq) in promoter regions with matched gene expression (RNA-seq). e, Scatterplot showing the correlation between promoter chromatin accessibility across all genes in liver endothelium and epithelium with Ifngr2 highlighted by the red dot. f, Immune genes with unrealized epigenetic potential across cell types and organs. g, Pearson correlation between promoter chromatin accessibility and gene expression across cell types and organs (mean and s.e.m across pairwise correlations; red bars indicate the maximum scope for unrealized epigenetic potential). Sample size: ATAC-seq n = 2 (b-g), RNA-seq n = 3 (c-g) independent biological replicates.
Figure 4
Figure 4
Systemic viral infection activates the immunological potential of structural cells in vivo. a, Schematic outline of the lymphocytic choriomeningitis virus (LCMV) infection analysis. b, Comparison of the changes in gene expression upon LCMV infection (day 8) to the epigenetic potential observed under homeostatic conditions (day 0), using a threshold of zero for differential gene expression (left) or a variable threshold analogous to a ROC curve (center). The area under the curve is interpreted as a measure of the epigenetic potential’s predictiveness for LCMV-induced gene activation, plotted together with the percentage of upregulated genes that carry unrealized epigenetic potential (right). c, Enrichment of immune-related gene sets among the LCMV-induced genes (two-sided Fisher’s exact test with multiple-testing correction). Sample size (all panels): n = 3 independent biological replicates.
Figure 5
Figure 5
Cytokine treatment induces cell-type-specific and organ-specific changes in structural cells in vivo. a, Schematic outline of the cytokine treatment experiments (left) and number of genes upregulated in each experiment (right). b, Genes upregulated in response to IFN-α treatment. c,d, Cytokine-induced changes in spleen endothelium (c) and liver fibroblasts (d), showing the percentage of LCMV-induced changes that are recapitulated by cytokine treatment (top left), enrichment for genes with unrealized epigenetic potential among the cytokine-induced genes (bottom left), and genes upregulated upon cytokine treatment (genes discussed in the text are in bold). Significant enrichments (two-sided Fisher’s exact test, adjusted p-value < 0.05) are labeled with an asterisk. Differential expression is based on a linear model (two-sided test) with multiple-testing correction (panels b-d). Sample size (all panels): n = 3 independent biological replicates.

Comment in

References

    1. Kotas ME, Medzhitov R. Homeostasis, inflammation, and disease susceptibility. Cell. 2015;160:816–827. doi: 10.1016/j.cell.2015.02.010. - DOI - PMC - PubMed
    1. Abbas AK, Lichtman AH, Pillai S. Cellular and Molecular Immunology. 2019
    1. Buckley CD, Barone F, Nayar S, Benezech C, Caamano J. Stromal cells in chronic inflammation and tertiary lymphoid organ formation. Annu Rev Immunol. 2015;33:715–745. doi: 10.1146/annurev-immunol-032713-120252. - DOI - PubMed
    1. Pober JS, Sessa WC. Evolving functions of endothelial cells in inflammation. Nat Rev Immunol. 2007;7:803–815. doi: 10.1038/nri2171. - DOI - PubMed
    1. Schleimer RP, Kato A, Kern R, Kuperman D, Avila PC. Epithelium: At the interface of innate and adaptive immune responses. J Allergy Clin Immunol. 2007;120:1279–1284. doi: 10.1016/j.jaci.2007.08.046. - DOI - PMC - PubMed

Publication types

MeSH terms

LinkOut - more resources