. 2020 Sep;585(7826):597-602.
doi: 10.1038/s41586-020-2444-0. Epub 2020 Jul 1.

A substrate-specific mTORC1 pathway underlies Birt-Hogg-Dubé syndrome

Affiliations

A substrate-specific mTORC1 pathway underlies Birt-Hogg-Dubé syndrome

Gennaro Napolitano et al. Nature. 2020 Sep.

Abstract

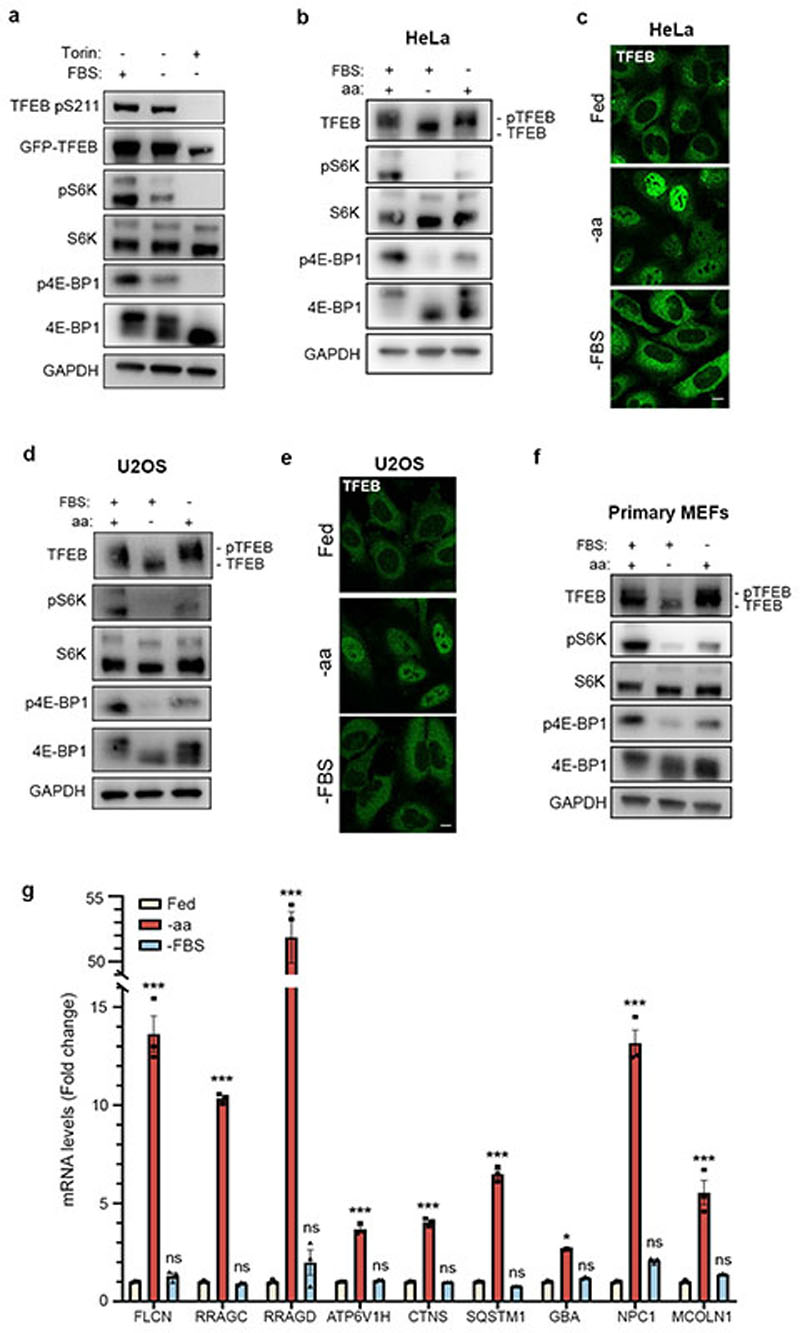
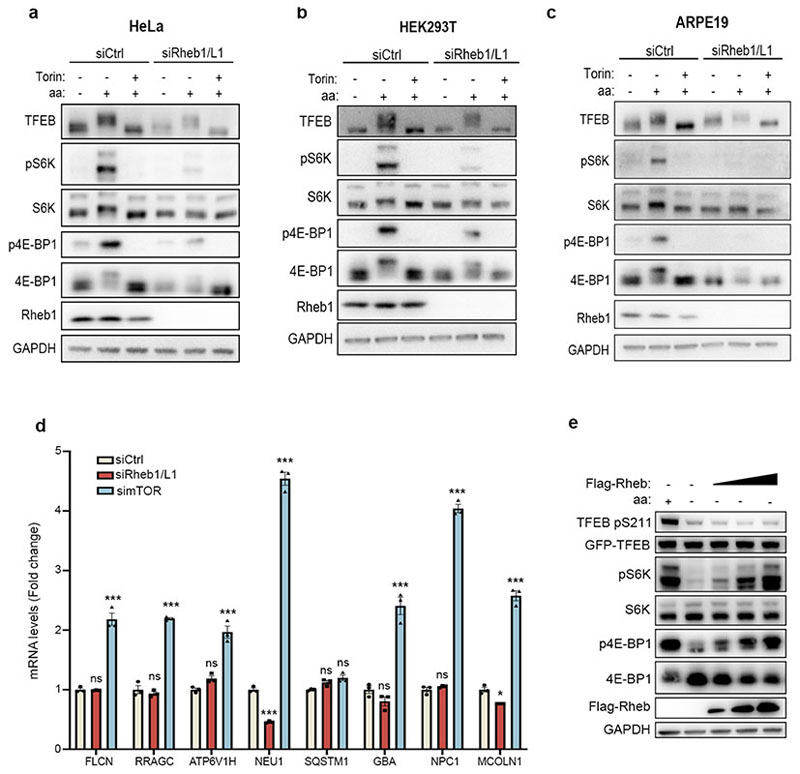
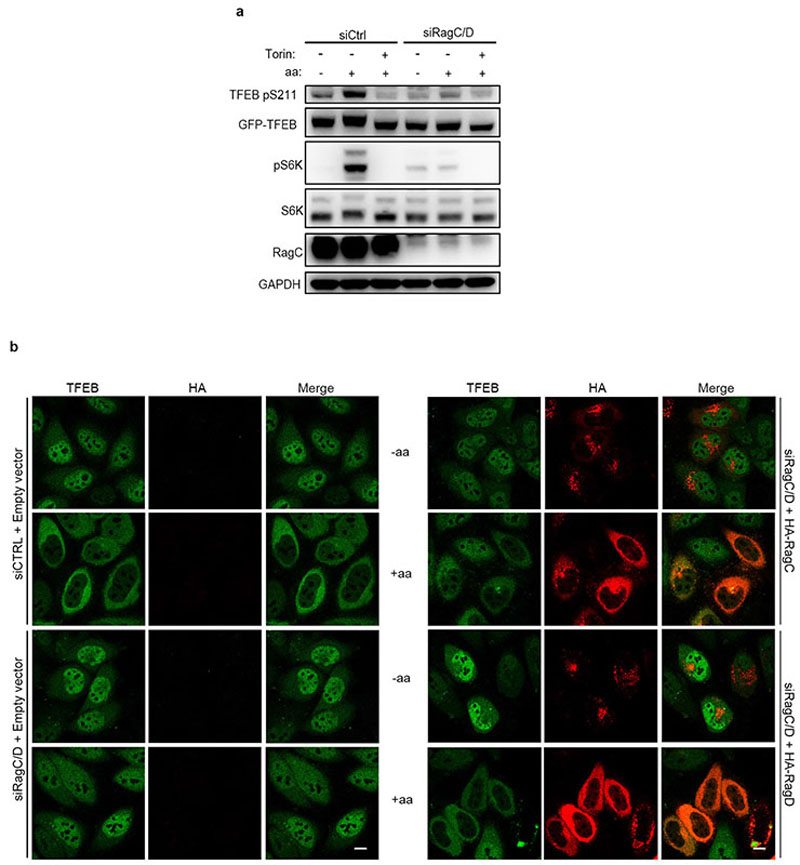
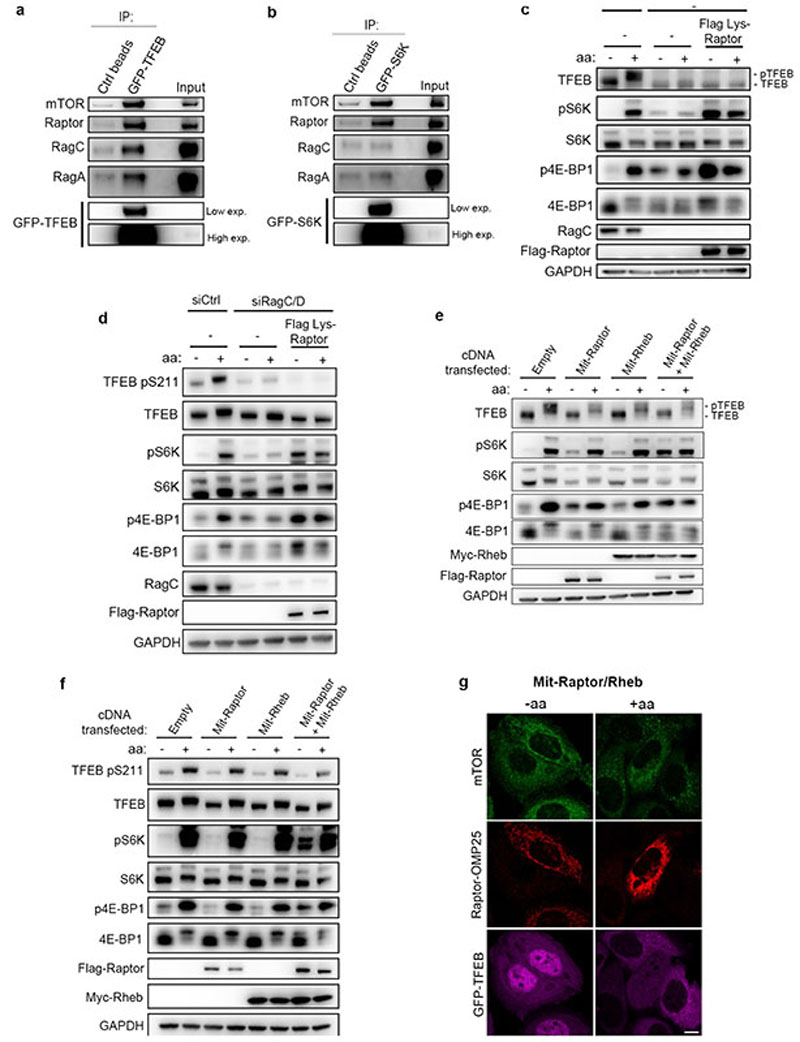
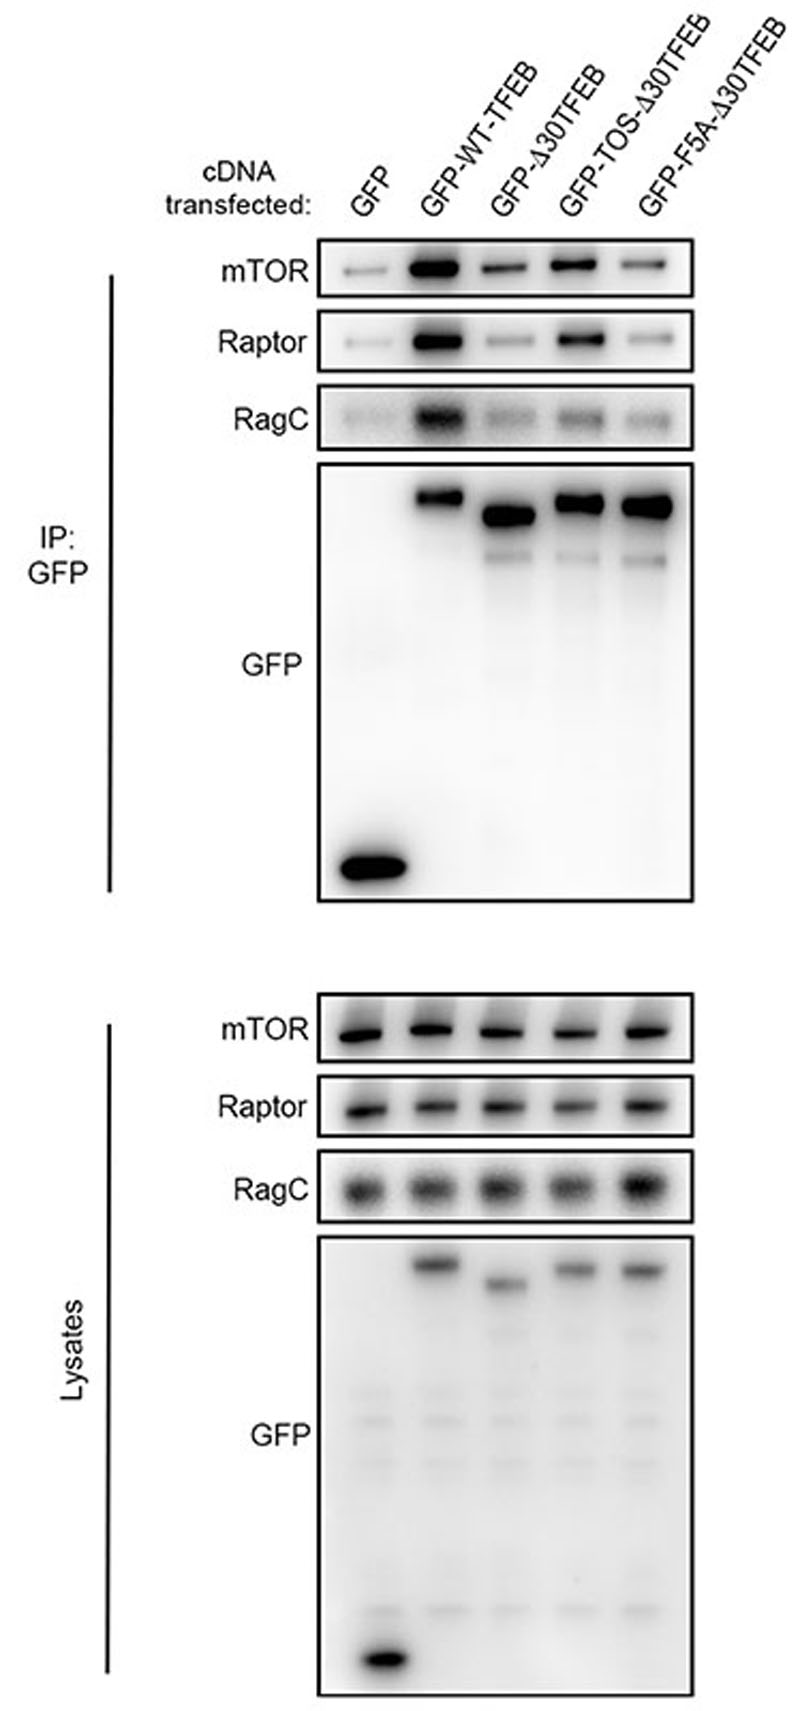
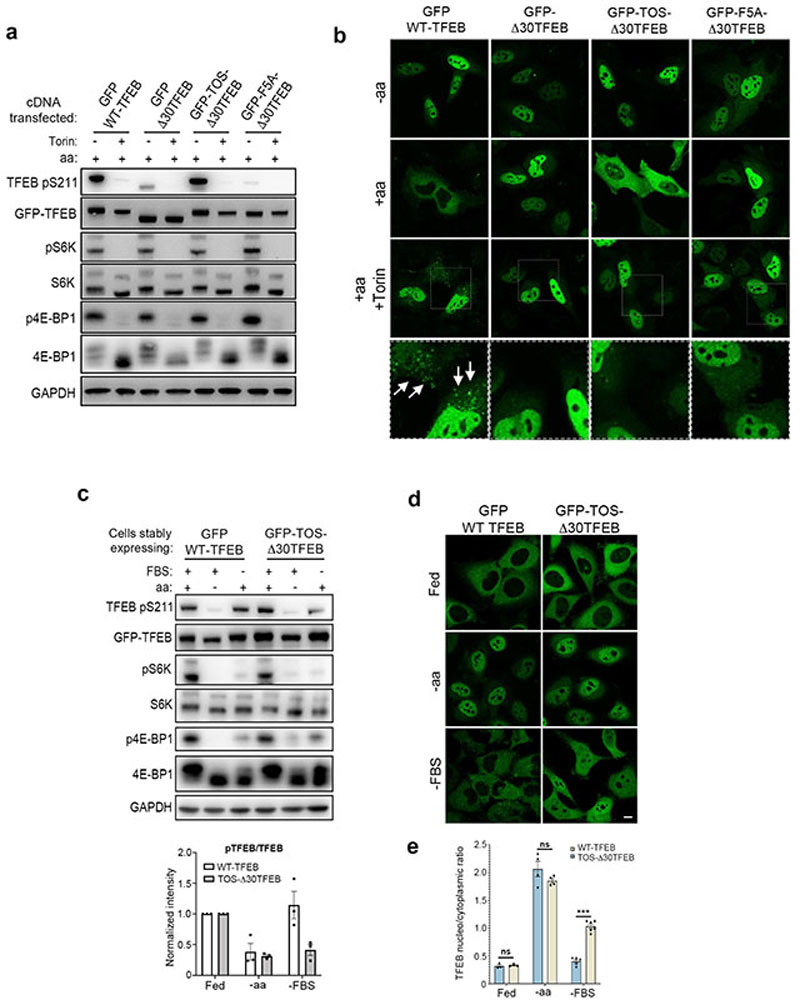
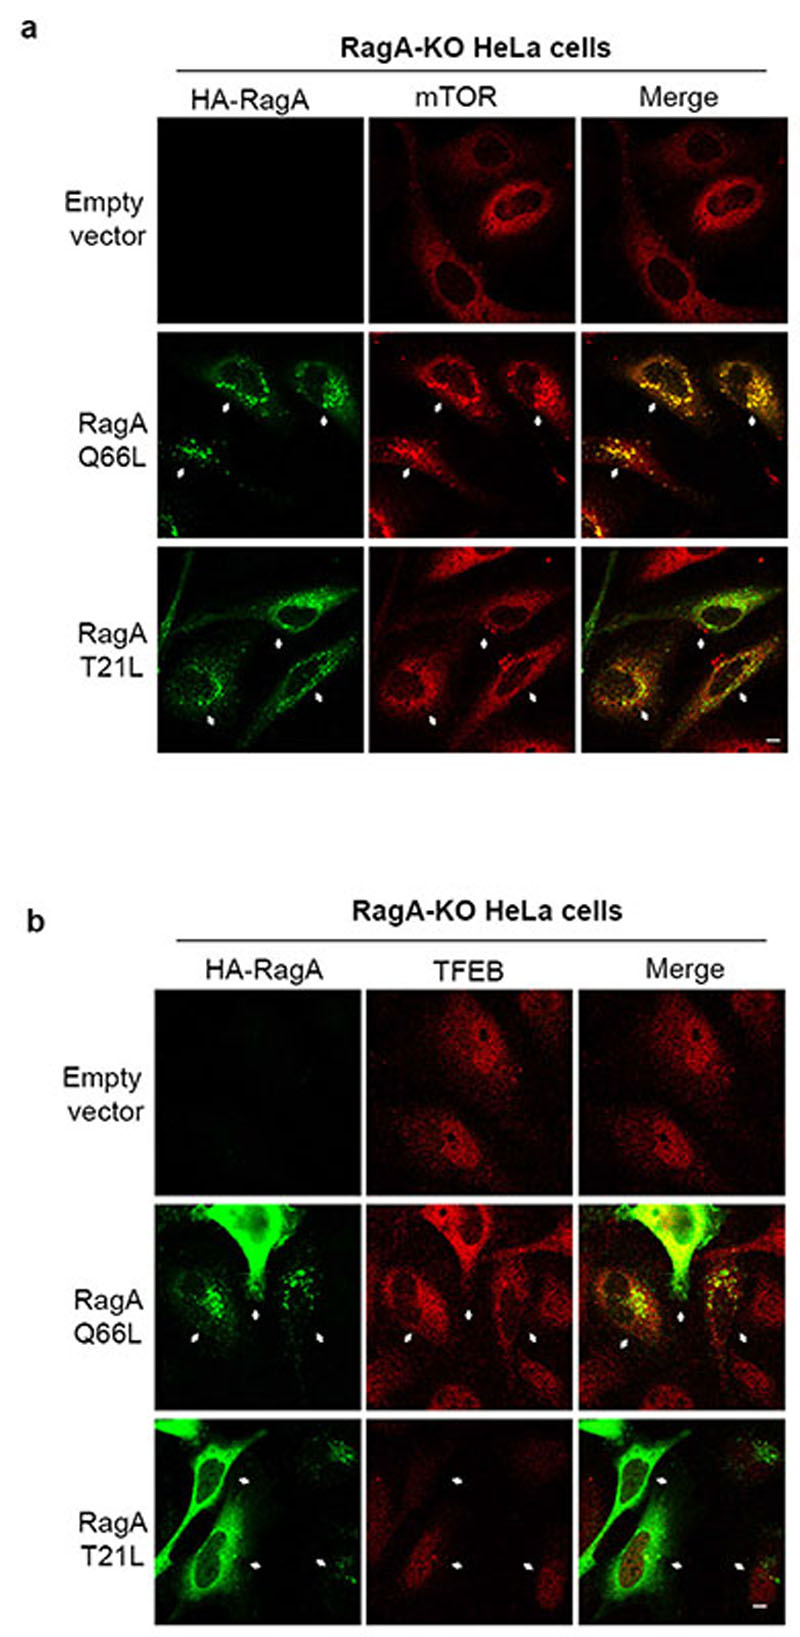
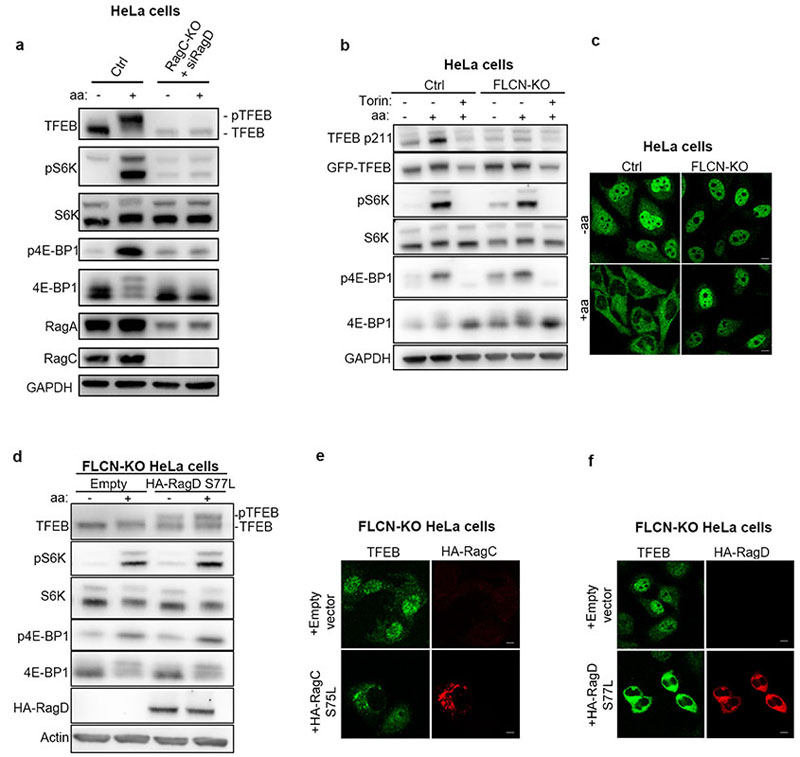
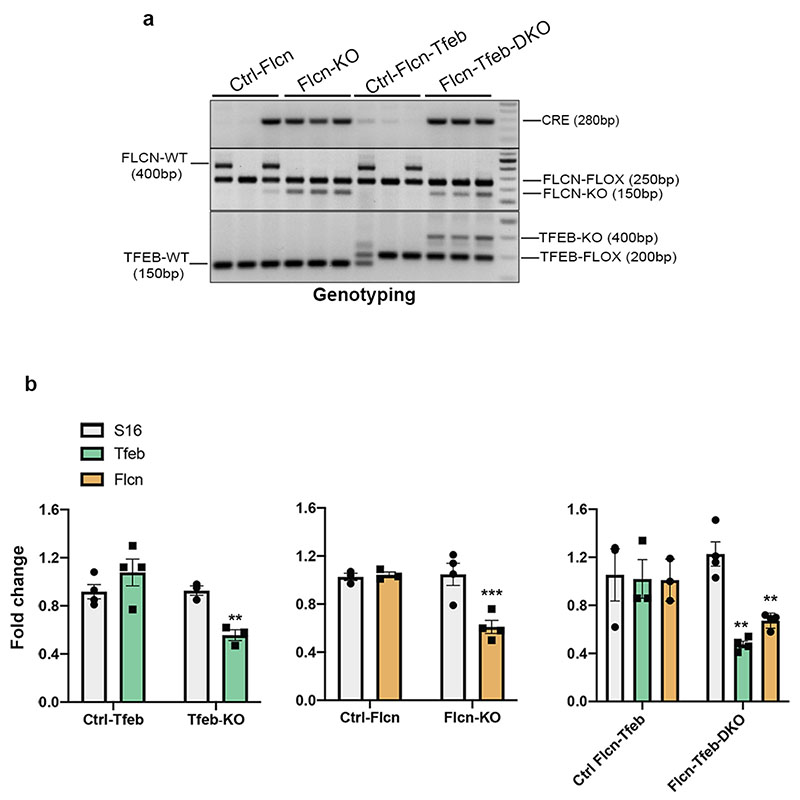
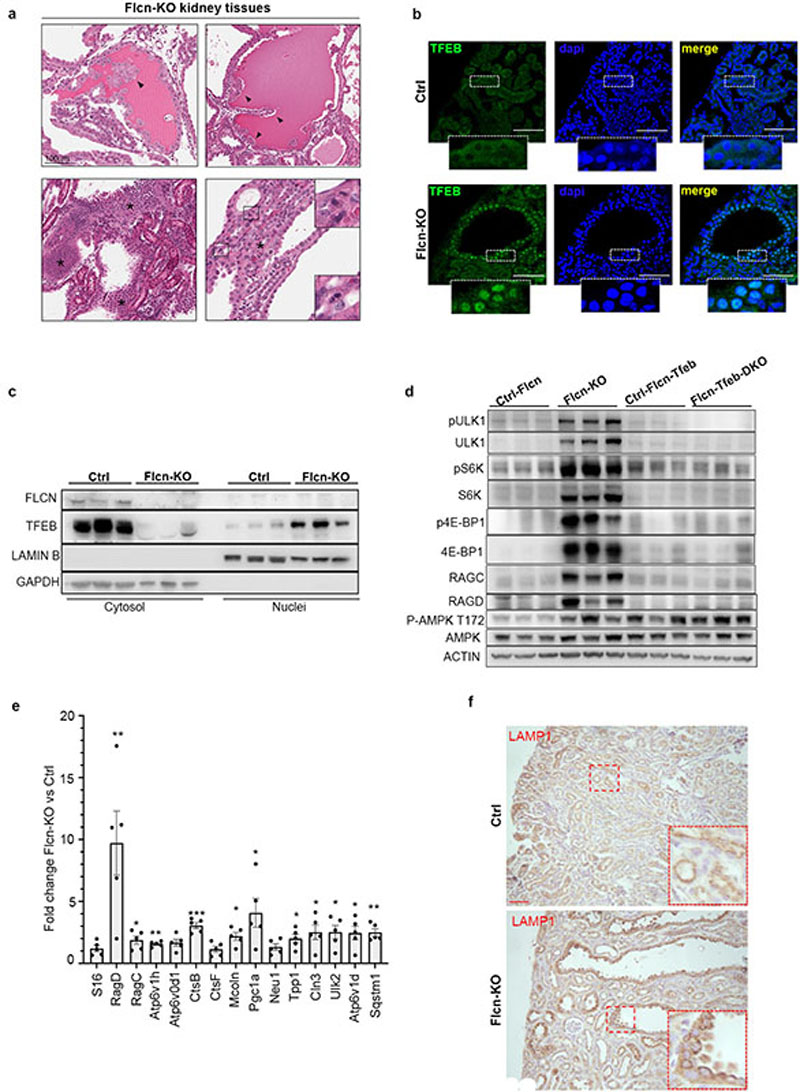
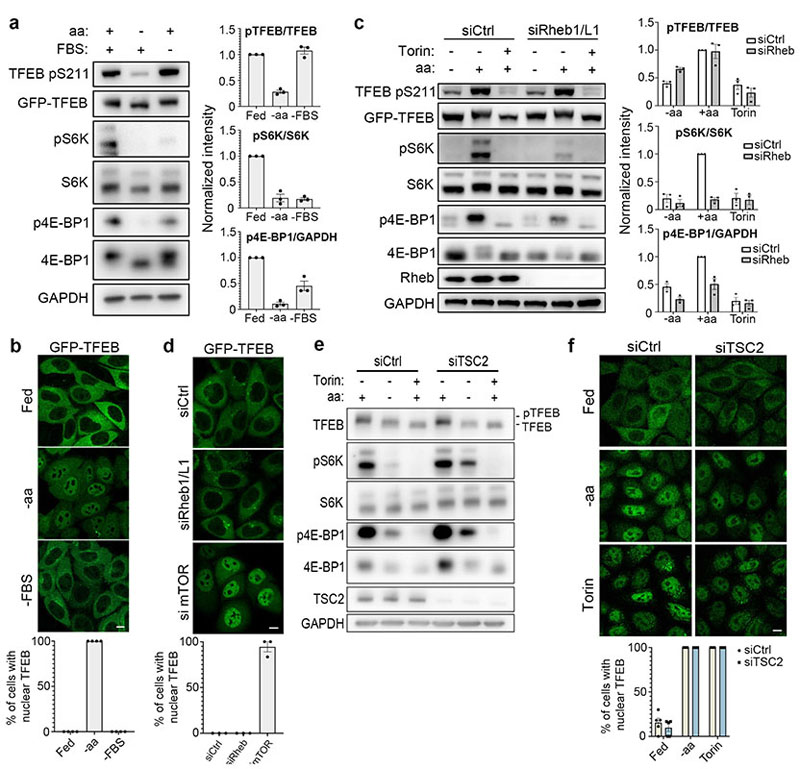
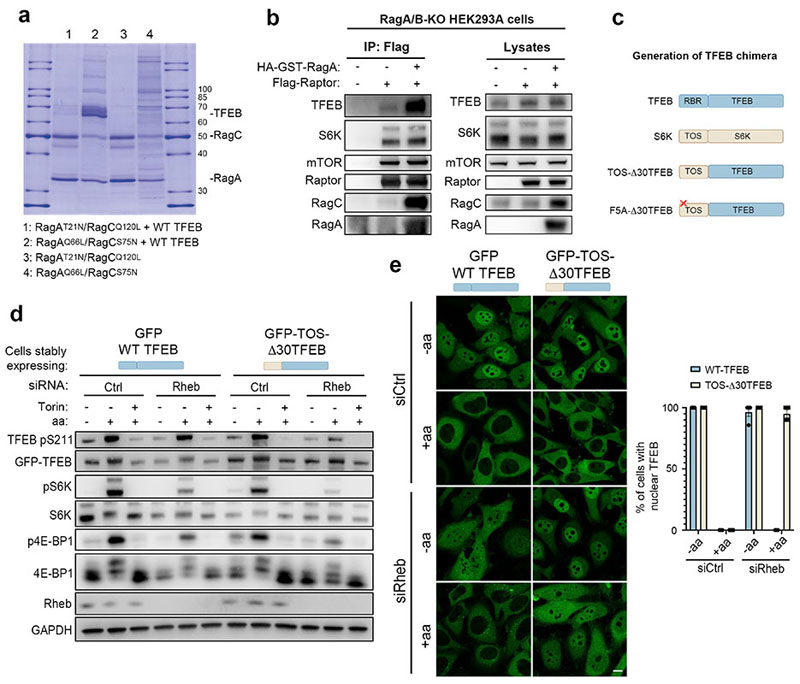
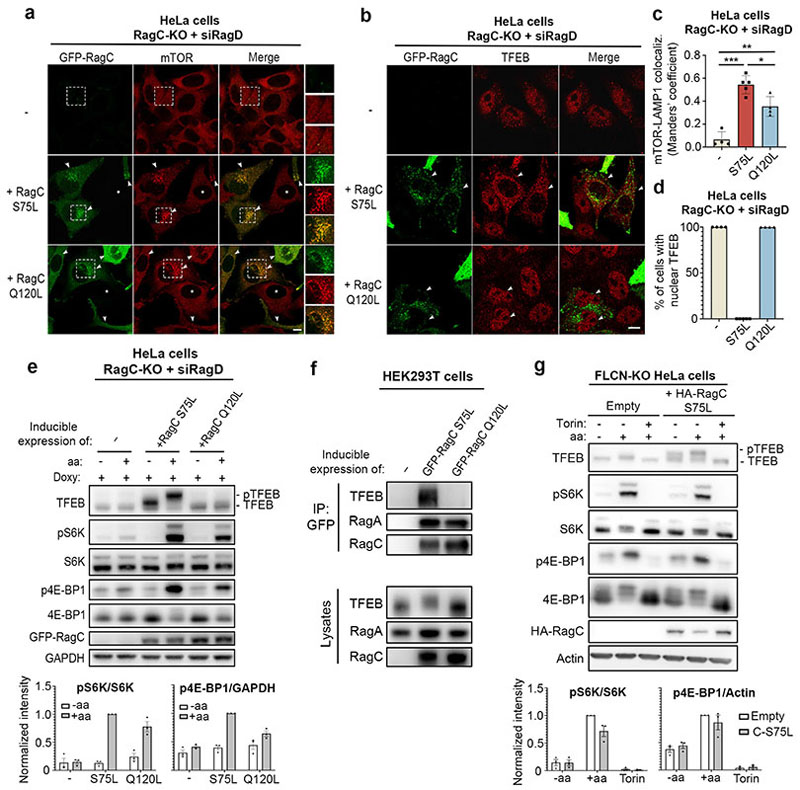
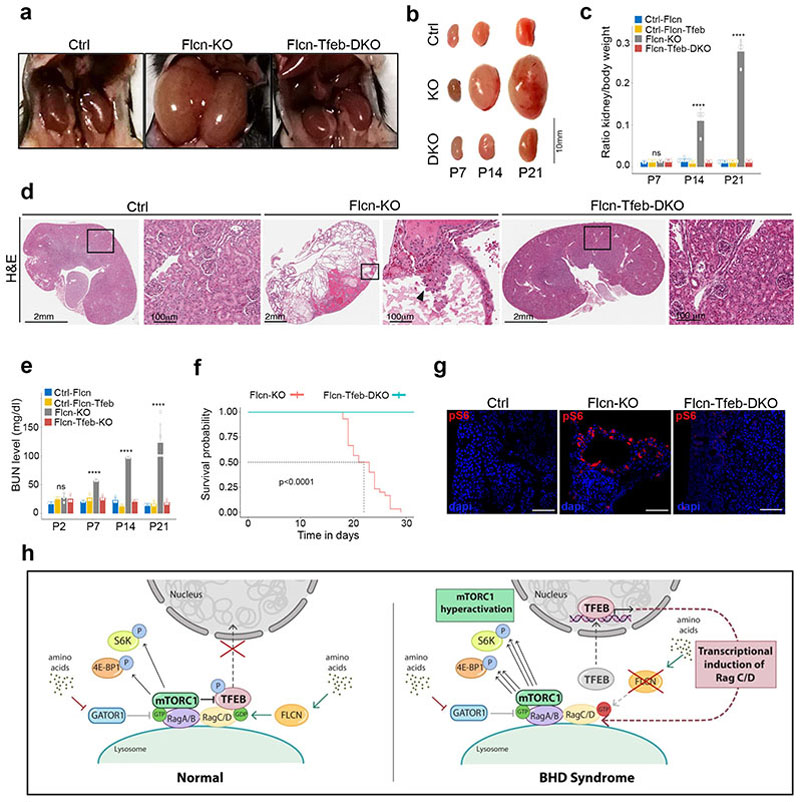
The mechanistic target of rapamycin complex 1 (mTORC1) is a key metabolic hub that controls the cellular response to environmental cues by exerting its kinase activity on multiple substrates1-3. However, whether mTORC1 responds to diverse stimuli by differentially phosphorylating specific substrates is poorly understood. Here we show that transcription factor EB (TFEB), a master regulator of lysosomal biogenesis and autophagy4,5, is phosphorylated by mTORC1 via a substrate-specific mechanism that is mediated by Rag GTPases. Owing to this mechanism, the phosphorylation of TFEB-unlike other substrates of mTORC1, such as S6K and 4E-BP1- is strictly dependent on the amino-acid-mediated activation of RagC and RagD GTPases, but is insensitive to RHEB activity induced by growth factors. This mechanism has a crucial role in Birt-Hogg-Dubé syndrome, a disorder that is caused by mutations in the RagC and RagD activator folliculin (FLCN) and is characterized by benign skin tumours, lung and kidney cysts and renal cell carcinoma6,7. We found that constitutive activation of TFEB is the main driver of the kidney abnormalities and mTORC1 hyperactivity in a mouse model of Birt-Hogg-Dubé syndrome. Accordingly, depletion of TFEB in kidneys of these mice fully rescued the disease phenotype and associated lethality, and normalized mTORC1 activity. Our findings identify a mechanism that enables differential phosphorylation of mTORC1 substrates, the dysregulation of which leads to kidney cysts and cancer.


Conflict of interest statement

Competing interest

A.B. is Co-Founder of CASMA Therapeutics, Inc, Cambridge, MA 02139

Figures

Extended Data Fig. 1
Extended Data Fig. 1. TFEB phosphorylation is insensitive to serum starvation
a, HeLa cells stably expressing GFP-TFEB were starved of serum (FBS) for 2h in the presence or absence of 250nM Torin and analyzed by immunoblotting with the indicated antibodies (replicated twice). b-f HeLa (b,c), U2OS (d,e) or primary mouse embryonic fibroblasts (MEFs, f) were starved of amino acids (aa) or serum (FBS) for 2h and then analyzed by immunoblotting for the indicated proteins (b,d,f) or by immunofluorescence to assess TFEB subcellular localization (c,e) (replicated twice). Scale bars, 10 μm. g, HeLa cells stably expressing GFP-TFEB were either starved of amino acids (-aa) or serum (-FBS) for 8h and subjected to qRT-PCR (replicated twice). Relative mRNA levels of the indicated genes were normalized to HPRT levels and expressed as fold-change relative to control (Fed) samples. Results are mean ± SEM; n=3; *P<0.05 (GBA: -aa p=0.0322); ***P<0.001 (FLCN: -aa p<0.0001; RRAGC: -aa p<0.0001; RRAGD: -aa p<0.0001; ATP6V01H: -aa p=0.0004; CTNS: -aa p<0.0001; SQSTM1: -aa p<0.0001; NPC1: -aa p<0.0001; MCOLN1: -aa p<0.0001); ns, non-significant (FLCN: -FBS p=0.8619; RRAGC: -FBS p=0.99; RRAGD: -FBS p=0.2558; ATP6V01H: -FBS p=0.9890; CTNS: -FBS p>0.9999; SQSTM1: -FBS p=0.9270; GBA: -FBS p=0.9359; NPC1: -FBS p=0.1933; MCOLN1: -FBS p=0.7916). Dunnett’s multiple comparisons test.
Extended Data Fig. 2
Extended Data Fig. 2. TFEB phosphorylation is insensitive to the Rheb/TSC axis
a-c, HeLa (a), HEK293T (b) or ARPE19 (c) cells were transfected with either siRNA targeting both Rheb1 and RhebL1 or with scramble siRNA. 72h after transfection cells were either starved of amino acids (aa) for 60 min or starved and re-stimulated with amino acids for 30 min, in the presence or absence of 250 nM Torin, and analyzed by immunoblotting with the indicated antibodies (replicated twice). d, HeLa cells stably expressing GFP-TFEB were transfected with siRNA targeting either Rheb1/RhebL1 (siRheb1/L1), mTOR (simTOR), or control siRNA (siCtrl) for 72h and subjected to qRT-PCR (replicated three times). Relative mRNA levels of the indicated genes were normalized to HPRT levels and expressed as fold-change relative to control (siCtrl) samples. Results are mean ± SEM; n=3; *P<0.05 (MCOLN1: siRheb p=0.0212); ***P<0.001 (FLCN: simTOR p<0.0001; RRAGC: simTOR p<0.0001; ATP6V01H: simTOR p<0.0001; Neu1: siRheb p<0.0001; Neu1: simTOR p<0.0001; GBA: simTOR p<0.0001; NPC1: simTOR p<0.0001; MCOLN1: simTOR p<0.0001); ns, non-significant (FLCN: siRheb p=0.9908; RRAGC: siRheb p=0.6937; ATP6V01H: siRheb p=0.0714; SQSTM1: siRheb p=0.2846; SQSTM1: simTOR p=0.0528; GBA: siRheb p=0.0597; NPC1: siRheb p=0.7753). Dunnett’s multiple comparisons test. e, HEK293A cells stably expressing GFP-TFEB, transfected with either empty vector or with increasing amounts of Flag-Rheb, were either left untreated or starved of amino acids (aa) for 60 min and analyzed by immunoblotting (replicated three times).
Extended Data Fig. 3
Extended Data Fig. 3. Rag GTPases are required for TFEB phosphorylation
a, HeLa cells stably expressing GFP-TFEB were transfected with siRNAs targeting RagC/D or with a control siRNA (siCtrl). 72h after transfection, cells were either starved for amino acids (aa) for 60 min or starved and re-stimulated with amino acids for 30 min in the presence or absence of Torin and analyzed by immunoblotting using the indicated antibodies (replicated three times). b, Immunofluorescence analysis of TFEB localization in HeLa cells stably expressing GFP-TFEB and transfected with a RagC/D-targeting siRNA or with control siRNA (siCtrl) and after 48 hours with empty vector (left panels), HA-RagC or HA-RagD (right panels). Cells were either starved for amino acids for 60 min (-aa) or starved and then re-stimulated with amino acids for 30 min (+aa) (replicated three times). Scale bar, 10 μm.
Extended Data Fig. 4
Extended Data Fig. 4. mTORC1 constitutive activation requires Rag GTPases for TFEB phosphorylation
a,b, GFP immunoprecipitates were prepared from HEK293A cells stably expressing GFP-TFEB (a) or GFP-S6K (b) and analyzed by immunoblotting for the indicated proteins (replicated three times). c,d, HEK293T cells (c) or HeLa cells stably expressing GFP-TFEB (d) were transduced with lentiviruses expressing Lys-Raptor or with control lentiviruses and transfected with siRNA targeting both RagC/D (siRagC/D) or with scramble siRNA (siCtrl). 72h after transfection, cells were either starved of amino acids (aa) for 60 min or starved and re-stimulated with amino acids for 30 min and analyzed by immunoblotting using the indicated antibodies (replicated three times). e,f, HEK293T cells (e) or HeLa cells stably expressing GFP-TFEB (f) transiently expressing the indicated combinations of mitochondria-targeted Raptor (Mit-Raptor: Flag-Raptor-OMP25) and Rheb (Mit-Rheb: Myc-Rheb-OMP25) were starved of amino acids (aa) for 60 minutes or starved and restimulated with amino acids for 30 min and analyzed by immunoblotting using the indicated antibodies (replicated three times). g, HeLa cells stably expressing GFP-TFEB were transfected and treated as in f and analyzed by immunofluorescence for the indicated proteins. GFP-TFEB was pseudo-colored to magenta to allow better visualization of mTOR/Raptor-OMP25 staining (replicated three times). Scale bar, 10 μm.
Extended Data Fig. 5
Extended Data Fig. 5. The mTORC1-substrate recruitment mechanism of TFEB is determined by its N-terminal region.
HeLa cells were transiently transfected with plasmids expressing either GFP alone or GFP-tagged versions of the following proteins: WT TFEB (GFP-WT-TFEB), a TFEB deletion mutant lacking the first 30 amino acids (GFP-Δ30-TFEB), a chimeric protein in which the first 30 amino acids of S6K, containing the TOS motif, were fused to the Δ30-TFEB mutant (GFP-TOS-Δ30TFEB), or the TOS-Δ30TFEB chimeric protein in which a key phenylalanine residue (F5) of the TOS motif was mutagenized to alanine (GFP-F5A-Δ30TFEB). 24h after transfection cell lysates were incubated with GFP-beads and subjected to immunoblotting using the indicated antibodies (replicated three times).
Extended Data Fig. 6
Extended Data Fig. 6. Addition of a TOS motif to a Rag-binding deficient TFEB mutant rescues its phosphorylation and subcellular localization.
a,HeLa cells transiently expressing the cDNAs described in Extended Data Fig. 5 were starved of amino acids (aa) for 60 min and re-stimulated with aa for 30 min, in the presence or absence of 250nM Torin, and analyzed by immunoblotting using the indicated antibodies (replicated three times). b, Cells described in a were either starved of amino acids (aa) for 60 min or starved and re-stimulated with amino acids for 30 min, in the presence or absence of Torin, and analyzed for TFEB subcellular localization by immunofluorescence (replicated twice). c, Representative immunoblotting and quantification (mean ± SEM; n=3) of HeLa cells stably expressing GFP-WT-TFEB or a chimeric plasmid in which the first 30 aa of TFEB were substituted with the first 30 aa of S6K containing the TOS motif (GFP-TOS-Δ30TFEB). Cells were either kept fed, starved of amino acids (-aa) or serum (-FBS) for 2h. d, Cells described and treated as in c were analyzed by immunofluorescence to assess TFEB subcellular localization (replicated three times). Scale bar, 10 μm. e, Analysis of TFEB localization performed using a dedicated script (Columbus software; Perkin-Elmer) that calculates the ratio value resulting from the average intensity of nuclear TFEB-GFP fluorescence divided by the average of the cytosolic intensity of TFEB–GFP fluorescence. Results are mean ± SEM. p-values were calculated on the basis of mean values from 3 or 4 independent fields (Sidak's multiple comparisons test). ***P<0.0001; ns: non-significant (Fed: P=0.9989; -aa: P=0.0946).
Extended Data Fig. 7
Extended Data Fig. 7. Activation of RagA is essential for mTOR lysosomal recruitment and TFEB cytosolic localization.
a,b Representative immunofluorescence images of endogenous mTOR (a) and endogenous TFEB (b) upon transfection of a construct encoding active (RagAQ66L) or inactive (RagAT21L) HA-tagged RagA or an empty vector in RagA-KO HeLa cells. Cells were deprived of amino acids for 50 min and then stimulated with amino acids for 15 min. Scale bars, 10 μm.
Extended Data Fig. 8
Extended Data Fig. 8. TFEB phosphorylation and cytosolic retention requires active RagC/D
a, RagC-KO HeLa cells were transfected with RagD-targeting siRNA (siRagD) for 72h, then either starved of amino acids (aa) for 60 min or starved and re-stimulated with amino acids for 30 min and analyzed by immunoblotting using the indicated antibodies (replicated three times). b, Fien KO and control HeLa cells overexpressing TFEB-GFP construct were either starved of amino acids (aa) for 60 min, or starved and re-stimulated with amino acids for 30 min in the presence or absence of 250nM Torin, and then analysed by immunoblotting with the indicated antibodies (replicated three times). c, Immunofluorescence analysis representative of triplicate experiments of TFEB in FLCN KO and control HeLa cells kept in amino acid deprived medium (-aa) or re-stimulated lx amino acid containing medium (+aa). Scale bars, 10 μm. d FLCN KO HeLa cells transfected with empty vector or with constitutively active RagC (RagDS75L) were either starved of amino acids (aa) for 60 min, or starved and re-stimulated with amino acids for 30 min, and analyzed by immunoblotting with the indicated antibodies (replicated three times). e,f Flcn KO Hela cells transfected with empty vector or constitutively active RagC (RagCS75L) (d) or constitutively active RagD (RagDS77L) (e) and kept in basal medium were immunostained with the indicated antibodies (replicated three times). Scale bars, 10 μm.
Extended Data Fig. 9
Extended Data Fig. 9. Genomic and mRNA analysis of transgenic mouse lines.
a, PCR analysis of genotypes from kidney samples of mice Flcnflox/flox;Ksp-Cre+ (Flcn-KO) mice and Ficnflox/flox;Tfebflox/flox; Ksp-Cre+ (Flcn-Tfeb-DKO) mice and corresponding controls (replicated three times). In detail, genotypes of Ctrl-Flcn mice were the following: Flcnflox/+-Flcnflox/flox-Flcnflox/+;Ksp-Cre+. Genotypes of Ctrl-Flcn-Tfeb mice were the following: Flcnflox/+; Tfebflox/+-Flcnflox/flox; Tfebflox/flox - Flcnflox/+; Tfebflox/flox. b, mRNA levels of the indicated genes in Tfebflox/flox;Ksp-Cre+ (Tfeb-KO), Flcnflox/flox;Ksp-Cre+ (Flcn-KO), Flcnflox/flox;Tfebflox/flox;Ksp-Cre+(Flcn-Tfeb-DKO) and corrispondent control mice at P2 of age. Bars represent means ± SEM for each group and are expressed as fold change compared with control mice normalized to cyclophilin gene expression (**=p < 0.01, ***p < 0.001 two-sided Student t test). S16 expression was shown as control unrelated gene. (n= Ctrl-Tfeb; n=3 Tfeb-KO; n3 Ctrl-Flcn; n=4 Flcn-KO; n=3 Ctrl-Flcn-Tfeb; n=4 Flcn-Tfeb-DKO).
Extended Data Fig. 10
Extended Data Fig. 10. TFEB is constitutively nuclear and active in Flcn-KO kidneys and its depletion rescues mTORC1 hyperactivation.
a, Representative images from three independent histopathological analysis of Flcn-KO kidney tissues showing magnifications of areas with tubular papillary atypical hyperplasia (arrowheads, top panels), hyperplasia with profound alterations of the tubular morphology (marked by asterisks in the bottom left panel) and atypical hyperplasia with multiple mitoses (represented in boxed areas and magnified in indents in bottom right panel). Bar, 100 μm. b, Representative immunofluorescence analysis of triplicate experiments of TFEB in kidney sections from the indicated genotypes. Insets show higher magnification of the boxed area. Scale bars, 100 ;Cm. c, Immunoblotting analysis of the indicated proteins in cytosolic and nuclear fractions of kidneys from Flcnflox/flox (Ctrl) and Flcnflox/flox;Ksp-Cre (Flcn-KO) mice (replicated three times). d, Immunoblotting analysis of the indicated proteins in kidneys from Flcnflox/flox;Ksp-Cre+ (Flcn-KO) mice and Flcnflox/flox;Tfebflox/flox; Ksp-Cre+ (Flcn-Tfeb-DKO) mice and corresponding controls (replicated three times). e, mRNA levels of several TFEB target genes were analyzed in kidney samples from Flcn-KO mice relative to control mice. Bars represent means ± SEM for n=5 mice for each group and are expressed as fold change compared with control mice normalized to cyclophilin gene expression (*=p < 0.05, **=p < 0.01, ***p < 0.001 two-sided Student t test). S16 expression was shown as control unrelated gene. f, Immunohistochemical analysis of LAMP-1 in kidney sections from Flcn-KO mice and control mice (replicated three times). Insets show higher magnification of the boxed area. Scale bars, 50 μm. In (a-f) analysis was performed from mice of 21 days of age.
Fig. 1
Fig. 1. TFEB phosphorylation is insensitive to the Rheb/TSC axis
a, Representative immunoblotting and quantification (mean ± SEM; n=3) of HeLa cells stably expressing GFP-TFEB either starved of amino acids (aa) or serum (FBS) for 2h. b, Cells as in a were analyzed by immunofluorescence (replicated three times) and quantified to calculate the percentage of cells showing TFEB nuclear localization. Scale bar, 10 μm. n=4 independent fields per condition. c, Representative immunoblotting and quantification (mean ± SEM; n=3) of HeLa cells stably expressing GFP-TFEB, transfected with the indicated siRNAs and subjected to amino acid (aa) starvation/re-feeding (see Methods) in the presence or absence of 250 nM Torin. d, Confocal microscopy analysis (replicated twice) of HeLa cells depleted for either Rheb1/RhebL1 (siRheb1/Ll) or mTOR (simTOR) and in control cells (siCtrl). Scale bar, 10 μm. The graph shows the percentage of cells showing TFEB nuclear localization. n=3 independent fields per condition. e, HeLa cells transfected for 48h with either TSC2-targeting (siTSC2) or control siRNA (siCtrl) were either left untreated, starved of amino acids (aa) for 60 min or treated with 250 nM Torin for 60 min prior to immunoblotting analysis (replicated three times). f, Cells described in e were stained with TFEB antibodies, analyzed by confocal microscopy (replicated three times) and quantified to calculate the percentage of cells showing TFEB nuclear localization. Scale bar, 10 μm. Results are mean β SEM. n=5 independent fields per condition.
Fig. 2
Fig. 2. An “unconventional” mTORC1 substrate-recruitment mechanism
a, Coomassie stained gel of eluted SEC fractions containing the different combinations of active/inactive Rag GTPases, in the presence or absence of TFEB. b, RagA/B-deficient HEK293A cells transfected with the indicated constructs were lysed, incubated with Flag-beads and analyzed by immunoblotting (replicated three times). c, Schematic representation of TFEB chimeric constructs (see Methods for details). RBR: Rag-binding region; TOS: TOR signaling motif. d, HeLa cells stably expressing GFP-WT-TFEB or the GFP-TOS-Δ30TFEB chimeric construct described in c were transfected with either Rheb-targeting or control (Ctrl) siRNA, subjected to amino acid (aa) starvation/refeeding (see Methods) in the presence or absence of 250 nM Torin, and analyzed by immunoblotting (replicated three times). e, Cells as in (d) were analyzed by immunofluorescence (replicated three times) and quantified to calculate the percentage of cells showing TFEB nuclear localization. Scale bar, 10 μm. Results are mean ± SEM. n–4 independent fields per condition.
Fig. 3
Fig. 3. Activation of RagC has a differential effect on mTORC1 substrates
a,b RagC KO HeLa cells were transfected for 24h with siRNA targeting RagD, treated with doxycycline for additional 48h to allow the inducible expression of either active (S75L) or inactive (Q120L) GFP-RagC and stained with mTOR (a) or TFEB (b) antibodies (replicated three times). Scale bar, 10 μm. c, Cells described in a were analyzed for mTOR-LAMP1 co-localization by calculating Manders’ co-localization coefficient. Results are mean ± SD. n=4 independent fields per condition. *P=0.0119; **P=0.001; ***P<0.0001. Tukey’s multiple comparisons test. d, Cells in (b) were quantified to calculate the percentage of cells showing TFEB nuclear localization. n=4 independent fields per condition. e, Cells as in a were subjected to amino acid (aa) starvation/refeeding (see Methods), analyzed by immunoblotting and quantified (mean ± SEM; n=3). f, Cell lysates from HEK293T cells with inducible expression of either active (S75L) or inactive (Q120L) GFP-RagC were incubated with GFP-beads and analyzed by immunoblotting (replicated three times). g, Representative immunoblotting and quantification (mean ± SEM; n=3) of FLCN KO HeLa cells transfected with control vector (empty) or RagCS75L and subjected to amino acid (aa) starvation/refeeding, in the presence or absence of 250 nM Torin.
Fig. 4
Fig. 4. TFEB depletion rescues renal pathology and lethality in Flcn KO mice
a, Abdominal cavities of Flcnflox/flox(Ctrl), Flcnflox/flox;Ksp-Cre+(Flcn-KO), and Flenllox/flox ; Tfebfox/nox; Ksp-Cre+(Flcn-Tfeb-DKO) mice at 21 days of age. b, Pictures of kidneys from the indicated mice at postnatal (p) day 7, 14, 21. c, Ratio of kidney to body weight for Flcn-KO, Flcn-Tfeb-DKO, Ficnflox/flox mice (Ctrl-Flcn) and Flcnflox/flox;Tfebflox/flox mice (Ctrl-Flcn-Tfeb) at the indicated time-points. One-Way ANOVA was applied for each time point (p=0.14 at p7, p=3.4e-07 at p14, p=9.3e- 14 at p21). For p-value < 0.05, a post-hoc Tukey was applied (significance for each comparison is provided in Methods section). At p7 n=3 for Ctrl-Flcn, Flcn-KO and Flcn-Tfeb-DKO, n=4 for Ctrl-Flcn-Tfeb; at p14 n=7 for Ctrl-Flcn, n=4 for Flcn-KO, n=3 for Ctrl-Flcn-Tfeb and Flcn-Tfeb-DKO; at p21 n=6 for Ctr-Flcn, n=4 for Flcn-KO, n=5 Ctrl-Flcn-Tfeb, n=3 for Flcn-Tfeb-DKO. Error bars represent s.d. d, Hematoxylin/eosin (H&E) of kidneys from Flcn-KO, Flcn-Tfeb-DKO and control mice at p21 (replicated three times). Scale bars, 2mm. Boxed areas are magnified on the right. Arrowhead indicates tubular papillary atypical hyperplasia. Scale bars, 100 μm. e, Blood urea nitrogen (BUN) levels of mice of the indicated genotypes/timepoints. Statistics was applied as in (c)(p=0.23 at p2, p=1.2e-05 at p7, p=1.9e-09 at p14, p=6.4e-04 at p21), N=3 mice for each genotype/timepoint. Error bars represent s.d. f, Kaplan-Meyer survival analysis of Flcn KO (N=30) and Flcn-Tfeb-DKO (N=29) mice. Two-sided log-rank test, p < 0.0001. Median survival time (dashed line) of Flcn-KO group is 22 days, g, Immunofluorescence of p-S6 in kidney sections from the indicated genotypes (replicated three times). Scale bars, 100 pm. h, model illustrating differential regulation of mTORC1 substrates in normal and BHD condition. Activation of Rag GTPases by amino acids leads to phosphorylation of S6K and 4E-BP1 and of TFEB, which is retained in the cytoplasm. In BHD syndrome loss of function of FLCN leads to TFEB nuclear translocation and mTORC1 hyperactivation.

Comment in

References

    1. Liu GY, Sabatini DM. mTOR at the nexus of nutrition, growth, ageing and disease. Nat Rev Mol Cell Biol. 2020 doi: 10.1038/s41580-019-0199-y. - DOI - PMC - PubMed
    1. Ben-Sahra I, Manning BD. mTORC1 signaling and the metabolic control of cell growth. Curr Opin Cell Biol. 2017;45:72–82. doi: 10.1016/j.ceb.2017.02.012. - DOI - PMC - PubMed
    1. Gonzalez A, Hall MN. Nutrient sensing and TOR signaling in yeast and mammals. EMBO J. 2017;36:397–408. doi: 10.15252/embj.201696010. - DOI - PMC - PubMed
    1. Sardiello M, et al. A gene network regulating lysosomal biogenesis and function. Science (New York, N Y) 2009;325:473–477. doi: 10.1126/science.1174447. - DOI - PubMed
    1. Settembre C, et al. TFEB links autophagy to lysosomal biogenesis. Science (New York, N. Y.) 2011;332:1429–1433. doi: 10.1126/science.1204592. - DOI - PMC - PubMed

Publication types

MeSH terms

Substances